James Murdoch CEO - Media Corporate IR Net
←
→
Page content transcription
If your browser does not render page correctly, please read the page content below
James Murdoch CEO
Forward-looking statements
This document contains certain forward-looking statements within the meaning of the United States Private
Securities Litigation Reform Act of 1995 with respect to the Group’s financial condition, results of operations and
business, and management’s strategy, plans and objectives for the Group. These statements include, without
limitation, those that express forecasts, expectations and projections with respect to the potential for growth of
free-to-air and pay television, advertising growth, DTH subscriber growth and Multiroom and Sky+ penetration,
DTH revenue, profitability and margin growth, cashflow generation, SAC and marketing expenditure, capital
expenditure programmes and proposals for rewarding shareholders.

These statements (and all other forward-looking statements contained in this document) are not guarantees of
future performance and are subject to risks, uncertainties and other factors, some of which are beyond the
Group's control, are difficult to predict and could cause actual results to differ materially from those expressed or
implied or forecast in the forward-looking statements. These factors include, but are not limited to, the fact that
the Group operates in a highly competitive environment, the effects of government regulation upon the Group's
activities, its ability to continue to obtain exclusive rights to movies, sports events and other programming
content, risks inherent in the implementation of large-scale capital expenditure projects, the Group’s ability to
continue to communicate and market its services effectively, and the risks associated with the Group's operation
of digital television transmission in the UK and Ireland.

Information on some risks and uncertainties are described in the "Risk Factors" section of Sky's Annual Report on
Form 20-F for the year ended 30 June 2003. Copies of the Annual Report on Form 20-F are available on request
from British Sky Broadcasting Group plc, Grant Way, Isleworth TW7 5QD. All forward-looking statements in this
document are based on information known to the Group on the date hereof. The Group undertakes no obligation
publicly to update or revise any forward-looking statements, whether as a result of new information, future
events or otherwise.

Our goal

    to maximise value for
 shareholders by focusing on
 profitable subscriber growth
Results highlights

• Quarterly DTH subscriber growth of 81,000 to 7.4 million
• Total revenue up 15% to £3,656 million
• Operating profit before goodwill and exceptional items up
  65% to £600 million
• EPS before goodwill and exceptional items increases to
  18.3 pence
• Proposed final dividend 3.25 pence per share
DTH subscriber growth

                                                                               7,355
                                                              6,845
                                                   6,101
                                   5,453
               4,513

               2000                2001            2002       2003             2004

                                 Closing subscribers       YTD net additions

Subscribers ’000 as at 30 June
DTH subscriber growth
               Quarterly net subscriber additions (000)
        150
                                             133

                                                          81
                      66

               Q3                                  Q4
        2003         2004                   2003          2004
Revenue growth
                                                             £3,656m

                                                   £3,186m
                                         £2,776m

                      £2,306m

                         2001               2002    2003      2004

Total revenue for twelve months ended 30 June
Turnover

 £m                           June 03   June 04   % +/-
 DTH                           2,341     2,660    +14%
 Wholesale                       202       215     +6%
 Advertising                     284       312    +10%
 Interactive                     218       307    +41%
 Other                           141       162    +15%
 Total                         3,186     3,656    +15%

Twelve months ended 30 June

Programming costs

 £m                           June 03   June 04     % +/-
 Sports                          723       803     +11%
 Movies                          397       393       -1%
 Third party channels            351       360       +3%
 Entertainment & News            133       155     +17%
 Total                         1,604     1,711       +7%
 Gross margin                   50%       53%     +3% pts

Twelve months ended 30 June
Strong operating profit growth
                                             Operating profit
                                                                       £600m

                                                               £364m

                                           £186m
                        £153m

                         2001                2002              2003    2004
Note: operating profit before goodwill and exceptional items
Twelve months ended 30 June
Continued progression in operating margin
Operating profit margin
20%
16.4%
15%
11.4%
10%
6.7%
5%
0%
2002 2003 2004
Note: operating profit margin before goodwill and exceptional items
Twelve months ended 30 JuneNet debt
£1,833m
£1,528m
£1,386m
Net debt (£m)
£1,105m
£759m
£429m
Dec 01 Jun 02 Dec 02 Jun 03 Dec 03 June 04Financial summary • Revenue growth continues • Strong operational gearing • High conversion of profitability to cashflow
The next phase of growth

• The market is large
• Strategies for growth
• Investing in long-term value
Sky in 2010

• Over 10 million DTH subscribers in 2010
• Over 25% Sky+ penetration
• Over 30% multiroom penetration
• Significant cashflow generation
The market is large
We’ve only scratched
the surface
Significant growth potential
                          UK and Ireland pay TV homes (millions)

                                                                                      ~80%
 25
                                                                                    penetration
 20

 15                                                  43%
                                                  penetration    Still 10 million
                                                                homes to switch
 10                                                                 to pay-TV

  5

  0
           Jun 01          Jun 02        Jun 03     Jun 04                          Equilibrium

                                   Sky        Cable/Other

Source: Sky, BARB, as at 30 June
UK pay TV penetration is relatively immature
90%
80%
70%
60%
Penetration rate
50%
40%
30%
20% Failure of
ITV Digital
10%
0%
2 4 6 8 10 12 14 16 18 20 22 24
US pay TV penetration (1977 – 2000)
UK pay TV penetration (1994 – 2004E)
Source: UBS May 2004UK viewers value pay TV
US 1989 UK 2004
50% pay TV penetration 43% pay TV penetration
80% 81%
20%
19%
Free Pay TV Free Pay TV
to air to air
Share of viewing in US homes Share of viewing in UK homes
Source: Veronis Suhler 2000, BARB (March to June 2004)Long-term progression of advertising funded TV
• Narrowing of the range of programming shown on the main
advertising funded TV networks
• ‘Ad skipping’ has major implications for advertising funded channels
US TV revenues $’billion
80
60
40
20
0
1997 1998 1999 2000 2001 2002 2003 2004F 2005F 2006F 2007F
Subscription revenue Advertising revenue
Source: Zenith Optimedia/CSFB June 2004Generational effect
Percentage of UK population with access to pay TV
60%
56% 57% 56%
52%
% of age group
29%
4-15 16-24 24-34 35-44 45-54 55+
Age group
Source: BARB June 2004Generational effect amplified
Baby Boom generation move to the next life stage
22.8%
Proportion of the population
21.5%
20.7%
18.6% 18.8% 18.9% 19.1%
17.6% 17.7%
13.3%
0-14 15-29 30-44 45-59 60-74
2002 2021
Source: Population projections by the Government Actuary’s Department
(2002-based principal projection)Additional catalysts • Government-backed analogue switch-off • Basic tier packages • Technological advances — Digital television, delivering greatly increased channel choice — Advanced programme guide — Interactive services — PVRs — HDTV
Growth consistently underestimated
                                Rolling t+ 3 years DTH subscribers forecast vs actual
                    8,000
                    7,500
                    7,000
Subscribers (000)

                    6,500
                    6,000
                    5,500
                    5,000
                    4,500
                    4,000
                            Jun 01                 Jun 02               Jun 03               Jun 04

                                      Sky actual            Combined third party forecasts
Source: Sky, Third party forecasts
Good quality potential customers
UK population by social grade*
People (000) People (000)
826 54% A 46% 696
5,442 54% B 46% 4,618
7,444 55% C1 45% 6,189
5,545 57% C2 43% 4,243
4,065 53% D 47% 3,572
1,660 39% E 61% 2,608
Pay TV Non pay TV
*Includes adults only (age 15+)
Source: TGI April 2003 – March 2004Affordability
Average weekly household expenditure
Recreation and culture £56.40
Food & non-alcoholic drinks £42.70
Restaurant & Hotels £35.40
Miscellaneous goods & services £33.10
Alcoholic drinks & tobacco £11.40
Communication £10.60
Sky World £9.23
Sky Family Pack £4.50
Sky Value Pack £3.12
Source: National Statistics - Family Spending 2003, SkyDiminishing uniqueness of cable
2,500
UK broadband connections (000)
2,000
1,500
1,000
500
0
Oct Jan Apr Jul Oct Jan Apr Jul Oct Jan Apr Jul Oct Jan Apr
2000 2001 2001 2001 2001 2002 2002 2002 2002 2003 2003 2003 2003 2004 2004
Cable modem DSL
Source: OFCOMEvolution of Free to air
Long-term migration to pay TV services
Target switch-off date Equilibrium
90%
80%
70%
60%
50%
40%
30%
20%
10%
0%
Medium term equipment replacement cycle
2003 2004
Pay TV penetration Digital FTA (only) penetration
Source: Sky ResearchDigital FTA and analogue FTA are very similar
% viewing share in digital FTA homes
84%
• Only a marginal
shift in viewing
• Move to pay TV
over the long-term
16%
Other
Source: BARB, 12 months to June 2004Free Satellite offering
• Provides single call, instant upgrade path to Sky packages
• 196 channels
• £150 for set top box, satellite dish, viewing card, cabling and standard installation
— Full access to 7 day programme guide and regional channels
— Access to interactive services including Government Direct
— Multiroom options will be available
— Launch October 2004
Sky’s EPG Sky News Active UK OnlineUniversal coverage of satellite
Free Satellite
offering
99% household 73% household
coverage* coverage*
*Note: current line of sight estimates only
Source: ITC, NAO June 2004No aerial upgrade required
Free Satellite
offering
99% household 48% household
coverage* coverage*
*Note: current line of sight estimates only
Source: ITC, NAO June 2004There’s a lot to play for • Equilibrium will be ~80% penetration • Potential customers abound across demographic groups • Digital FTA and analogue FTA are very similar • Free Satellite offering will be an important route for future Sky customers
The prospects couldn’t
be better
Sky couldn’t be better placed
Strategies for growth
The run rate of gross additions is declining
                       Quarterly gross additions (000)*
  350

  300

  250
                                                          • Diminishing
  200                                                       return on Top
                                                            Tier focused
  150
                                                            marketing
  100

   50

     0
           Q4 Q1 Q2 Q3 Q4 Q1 Q2 Q3 Q4
          2002 2003 2003 2003 2003 2004 2004 2004 2004

* = Four quarter rolling average
Barriers to subscription
Focus on knocking down key barriers
• “It costs too much”
• “Pay TV is just about sports and movies, I’m not
interested in those”
• “Hundreds of channels of rubbish”
• “They make you pay for channels we would
never watch”
• “There are too many repeats”
• “You get cheap calls with cable”
• “With a 12
month subscription, it’s a
big commitment”What we’re doing about it A lot of the challenge centres on marketing • Re-introducing the brand • Emphasizing the range of entry points • Segmentation • Prospects database • Continued investment in “must-see” programming • New pricing and packaging • New technologies
Those who don’t get
Sky, don’t ‘get’ Sky
And those who buy Sky,
value the product more
than the brand
It’s time to
re-introduce Sky
and invite people to
join in
To reappraise Sky

I didn’t know Sky did that.
That Sky could be like that.
That’s different.
I want it.
Less

Sell Sell Sell
Re-introducing the Sky brand
More

Surprise
Show
Seduce
Less

Utility
More

It’s fun
It’s good
Join in
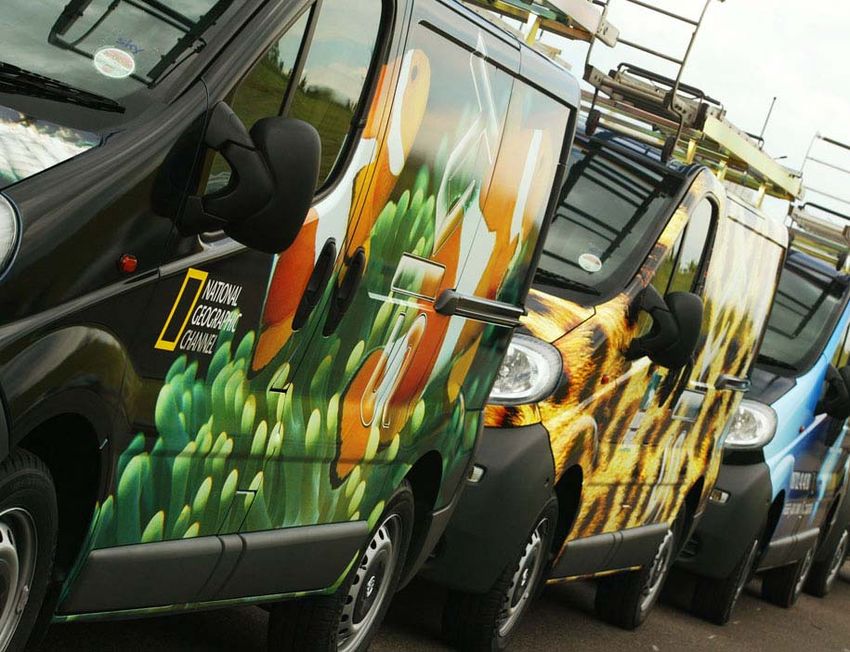
Vans
Investing in future growth

• 40-50% increase in above the line expenditure in 2005
• Marginal growth in short-term SAC
• 10% increase in SAC in medium-term
Segmentation
                                                         Profile of non-pay TV homes

                                    1.6

                                    1.4
        lions)

                                    1.2
        Number of Households (mil

                                    1.0

                                     0.8

                                     0.6

                                     0.4

                                      0.2                                                                  Least affluent
                                                                                                        Low/mid
                                      0.0
                                             Young,                                                 Mid/high
                                                        Young
                                               no                  Mature                        Most affluent
                                                       families              Empty
                                            children              families             Retired
                                                                             nesters
Source: Claritas / Sky marketing January 2004                                          seniors
Segmentation
Young Singles Couples Older & Retired Singles
Nursery Primary Secondary Empty Retired Older Retired
Female Male No Kids Kids Kids Kids Adult Kids Nesters Retired Older Male Male Female Female
Top Potential:
Excess Viewing Concerns
Don't Watch Enough TV
Anti Paying for More TV
Financially Constrained
Can't Agree Priority
Unconstrained
Marginals:
Excess Viewing Concerns
Don't Watch Enough TV
Anti Paying for More TV
Financially Constrained
Can't Agree Priority
Unconstrained
Remainder:
Excess Viewing Concerns
Don't Watch Enough TV
Anti Paying for More TV
Financially Constrained
Can't Agree Priority
Unconstrained
Illustrative only
Source: Simpson Carpenter / Sky marketing January 2004Actions Increasingly effective and targeted marketing • Strengthening expertise • Prospect database built by 2005 • Profile all 14 million non-subscribing households • Augmented with Sky’s own past marketing knowledge • Test and learn starts 2005
Segmentation
We’ve already started
• Young affluent families
• 45+ single affluent males
• Nursery families
Short term DTH subscriber growth profile
                      Quarterly net additions

100,000

     Q1   Q2            Q3                 Q4    Q1          Q2
               2005                                   2006

                             Illustrative only
Must-see programming
Must-see programming
Disciplined on-screen investment an important
component of success
• 10-20% increase in Sky One programming budget in 2005
• 5-10% saving in sports and movie costs in 2005
• Continued focus on third party channel renewals
Pricing + Packaging
Goal of new package structures
— attract subscribers at very profitable levels of subscription
— facilitate greater flexibility for consumers to select an appropriate package
— increase control over viewing, supplemented by enhanced parental controls
— promote high quality documentary and arts programming
Long-term evolution from current packages, no revolution
     Small Basic (£13.50) 2%
                                                                               Small Top Tier
                                                                               Basic Plus
    Big Basic
    (£19.50)                   Changing the mix across price points   Middle
      25%           Top Tier                                           Basic
                     (£40)                                                                  Top Tier
 1 or 2 Premium      52%         Current                   Future
                                                                      Big Basic
   (£30 - £34)
                                                                                   1 or 2
       20%
                                                                                  Premium

                                           Illustrative only
Overstated risk of spin down
Satisfaction consistent across tiers
Overall experience rating by package
87%
82% 82% 84%
Percentage rating 6-10
Basic Sports Movies Top Tier
Source: Sky monthly tracker May 2004ARPU progression • £380 now • Achieve £400 by December 2005 • Profitability, not ARPU, will be key
Profitability, not ARPU, will be key
Subscribers at many levels are worth having
                        Economics of the Sky Family Pack

                Net                Programming                c70%
              Revenue                  costs               gross margin

Source: Sky
New products strategy
More new products, faster
New range of high end, niche services
HDTV
Sky+
Evolving Sky packages
Free to air satellite
Low entry, sub-subscription offerSky+
Over 25% penetration in 2010
Quarterly net additions (households 000)
New pricing policy
129
72 75
Loyalty offer
27 26
10 14 16
8 9 10
1
Q1 Q2 Q3 Q4 Q1 Q2 Q3 Q4 Q1 Q2 Q3 Q4
2002 2002 2002 2002 2003 2003 2003 2003 2004 2004 2004 2004
Source: SkySky+ 160 Image shown is for illustrative purposes only and does not represent the final version • Availability October 2004 • Pricing £399 • Hard Disk Size 160 gigabytes • Extra Connectivity 2 x USB Ports
Multiroom

• 293,000 multiroom households
• High satisfaction levels
• Over 80% purchase direct
• High margin subscription
• 26% of multiroom
  subscribers were new to Sky
• Significant opportunity
  - an average of 2.9 TV sets
    in Sky digital homes
Multiroom
Over 30% penetration in 2010
Quarterly net additions (Households 000)
53
42
33
28
23 21 23
20 19
15 14
2
Q1 Q2 Q3 Q4 Q1 Q2 Q3 Q4 Q1 Q2 Q3 Q4
2002 2002 2002 2002 2003 2003 2003 2003 2004 2004 2004 2004
Source: SkyBenefits of HDTV • The ultimate TV experience • Higher customer satisfaction and lower churn • Underlines Sky's leadership in technology • Incremental subscription revenue opportunities from niche segments • Launch in 2006
Strategies for growth
Conclusion
• Focus on barriers to subscription
• Re-introduce the brand
• Better segmentation
• Disciplined on screen investment
• Pricing and packaging evolving
• New technologies

Over 10 million customers in 2010
Investing in
long-term value
Long-term value
           DTH subscriber growth
                       10.0

                        9.5
Subscribers millions

                        9.0

                        8.5

                        8.0

                        7.5

                              2004   2005        2006        2007           2008        2009   2010

                                            Consensus view               Growth opportunity

                                                     Illustrative only
Infrastructure to support over 10 million subscribers • Customer Relationship Management (CRM) • Property • Advanced Technology Centre • New projects
Capital investment - CRM
Fundamental to the future of the business

• Increased demands
• Capacity constraints
• Leading edge system
• Serve customers better
• Work to date
• c£50m over next 4 years
Capital investment - Property
Flexibility and efficiency

• Contained site
• Flexibility with potential for
  growth/reduction
• Efficiency of building stock
• Quality of working environment
• Access and parking
• Health and safety compliance
• c£300m over next 4 years
Capital investment – Advanced Technology Centre
Operational continuity programme

• Purpose built for
  business continuity
• Mirror image of
  broadcast platform
• Remove single points
  of failure
• c£50m over next 2 years
Capital investment – New projects
Build upon first class customer service

• Training facility
   — Centre for recruitment, operational training and
     management development
• Increased contact centre capacity
   — Meet long-term significant demand for pay TV
   — Improve flexibility
• Current estimates c£50m over next 4 years
Infrastructure investment • Maintain core on-going capex of £100 million p.a. • Five one-off projects require up to an additional £450 million over the next four years • Estimated peak financial year 2005
Long-term value
Operating profit

                              Marketing
                                                                   FRS 20
                                SAC
                                                               CRM depreciation
                            Programming

             2004                2005                 2006                2007                 2008   2009   2010

                                                  Consensus view           Growth opportunity
                                                         Illustrative only
Note: Prepared on a consistent basis with current UK GAAP and has not been adjusted for IFRS
Capital structure
Capital structure

• Financing structure – legacy of digital investment
• Strong cashflow generation
• Credit profile continues to improve
• Comfortably able to support a BBB rating
• Intention to return surplus capital to shareholders
Returning cash to shareholders

• Ordinary dividend
   — Proposed final dividend of 3.25p
   — Total of 6p for 2004 – 3.1x covered
   — 2005 dividend to grow in line with earnings
• Share buy-back
   — Programme to begin after AGM, subject to shareholder approval
• Developing proposals to overcome distributable reserves
  constraints
Conclusion
Conclusion

• Significant market opportunity
• Drive subscriber growth, profitably
• Investing in long-term value
• Intention to return surplus cash to shareholders
You can also read