The New SeaSpine Accelerating the Pace of Innovation & Design - August 2021

Page created by Jimmy Curtis
 
CONTINUE READING
The New SeaSpine Accelerating the Pace of Innovation & Design - August 2021
The New SeaSpine
 Accelerating the Pace
 of Innovation & Design
 August 2021

©2021 SeaSpine Orthopedics Corporation. All rights reserved.   1
The New SeaSpine Accelerating the Pace of Innovation & Design - August 2021
Forward-looking Statements & Disclaimer
This presentation includes statements that may be forward-looking statements within the meaning of the Private Securities Litigation Reform
Act of 1995. The words “believe,” “estimate,” “expect,” “anticipate,” “project,” “forecast” and similar expressions, or the negative thereof, among
others, generally identify forward-looking statements. Forward-looking statements used in this presentation include revenue guidance; future
revenue and revenue growth; liquidity to fund growth; new product launches and market opportunity, market share and market share growth.
SeaSpine® cautions that these forward-looking statements are based on management's current expectations, estimates, forecasts and
projections, and assumptions management believes are reasonable, and are subject to risks and uncertainties that may cause actual results to
differ materially from those indicated in the forward-looking statements. Such risks and uncertainties include, but are not limited to, the ongoing
impact of the COVID-19 pandemic on the elective surgery market and the global healthcare system generally; risks that the COVID-19
pandemic may disrupt the Company’s business and/or the global healthcare system more severely than anticipated; surgeons’ willingness to
use the Company’s existing and newly launched products; the Company’s ability to continue to invest in medical education and training,
product development, and/or sales and marketing initiatives at levels sufficient to drive future revenue growth; the Company’s ability to attract
new, high-quality distributors and potential disruption to the Company’s existing distribution network; continued pricing pressure, as well as
exclusion from major healthcare systems; the risk of supply shortages and the associated, potentially long-term disruption to product sales;
unexpected expense and delay; changes to laws and regulations applicable to the Company and the industry in which it competes; and general
economic and business conditions in the markets in which the Company does business, both in the U.S. and abroad. Additional information
about the factors that may affect the operations of SeaSpine and results is set forth in SeaSpine’s annual and quarterly reports filed with the
U.S. Securities and Exchange Commission. Forward-looking statements contained in this presentation are made only as of the first day of the
month and year set forth on the cover hereof and SeaSpine undertakes no obligation to release publicly any revisions or updates to forward-
looking statements as a result of subsequent events or developments, except as required by law.

©2021 SeaSpine Orthopedics Corporation. All rights reserved.                                                                                          2
The New SeaSpine Accelerating the Pace of Innovation & Design - August 2021
®
SeaSpine Journey

                                                               Accell®
                                                                Bone
                                                               Matrix

                                                NanoMetalene®            Modular
                                                   Surface               Fixation
                                                 Topography              Systems

                                    Our Beginning–                                                       The Journey/                     Growth/Innovation
                                  Keeping Foundation                                                    Transformation                     2021 & Beyond

    Spin-off of a spinal implants                                                   SeaSpine has established a           Focus on better patient
    and orthobiologics division                                                     profound identity as a               outcomes through research
    into a pure-play spine                                                          customer focused, pure-play          and product development
    company with a renewed                                                          spine company, creating its          that is driven by science
    focus on investing for growth                                                   unique pathway as a market-          and data, coupled with
    and innovation.                                                                 share taker. Under proven            market leading FLASH™
                                                                                    leadership the organization          Navigation system with 7D
                                                                                    drives to create innovative          Technology, SeaSpine aims
                                                                                    solutions and deepen                 to be a market leader in
                                                                                    partnership with committed,          Spine.
                                                                                    growth-oriented distributors.

©2021 SeaSpine Orthopedics Corporation. All rights reserved.                                                                                                  3
The New SeaSpine Accelerating the Pace of Innovation & Design - August 2021
SEASPINE
      TODAY
  We collaborate with surgeons with the goal of developing
    best-in-class, cost-effective solutions that combine
   efficient spinal implant systems with industry leading
    enabling technologies and orthobiologics to deliver
    clinical value to the surgeon, hospital and patient.

©2021 SeaSpine Orthopedics Corporation. All rights reserved.   4
The New SeaSpine Accelerating the Pace of Innovation & Design - August 2021
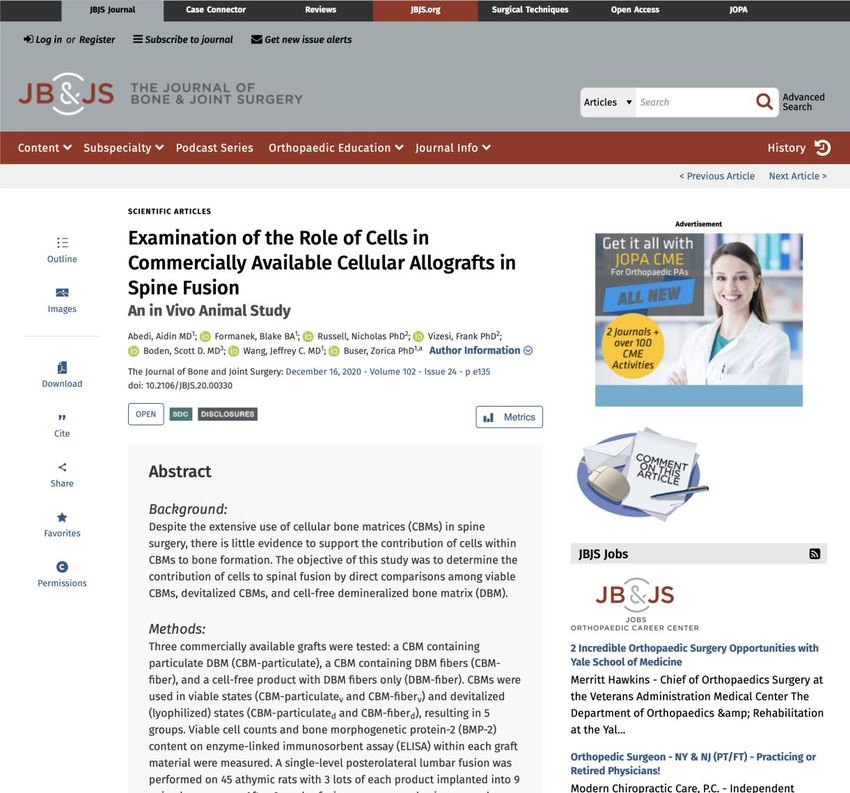
Senior Leadership Team
An assembly of experienced leadership to drive vision forward with 230+ years in spine/orthopedics

                                                               Beau Standish, PhD,                     John Bostjancic              Dennis Cirino                    Tyler Lipschultz                        Laetitia Cousin
                                                               PEng                                    Senior Vice President,       Senior Vice President,           Senior Vice President,                  Vice President,
                                                                                                       Chief Financial Officer      Global Spinal Systems            Orthobiologics & Business Development   Regulatory & Quality Assurance
                                                               President Enabling Technologies

  Keith C. Valentine                                           Patrick Keran                           Bill Rhoda                   Frank Vizesi, PhD                 John Winge                             Troy Woolley
                                                               Senior Vice President                   General Manager of Process   Vice President, Orthobiologics    Vice President, Sales                  Vice President, Marketing
  President & Chief Executive Officer                          General Counsel & Corporate Secretary   Innovation & Development     Research & Development,
                                                                                                                                    & Clinical Affairs

©2021 SeaSpine Orthopedics Corporation. All rights reserved.                                                                                                                                                                                  5
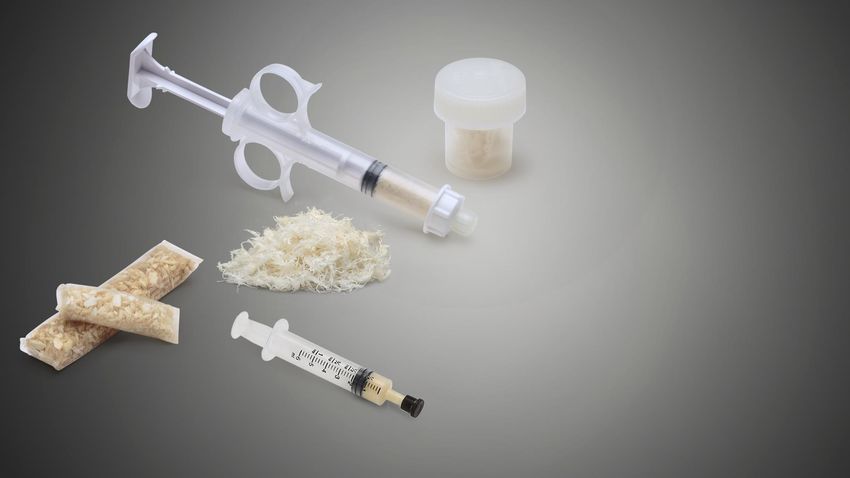
The New SeaSpine Accelerating the Pace of Innovation & Design - August 2021
Mariner® MIS

 Foundational Products
 Expected to Drive                                                                                Mariner®
                                                                                                OsteoBallast®
                                                               OsteoStrand®

 Double-Digit Growth                                           Shoreline RT™

 Differentiated, biologic-friendly
 spinal implants and advanced
 orthobiologics coupled with
 market leading image                                              Waveform TA
                                                                                                     FLASH™ Navigation
 guidance enabling technology                                                                        with 7D Technology

©2021 SeaSpine Orthopedics Corporation. All rights reserved.                                                          6
The New SeaSpine Accelerating the Pace of Innovation & Design - August 2021
Medical Education Programs
Furthering our commitment to deliver value to distributors and surgeons

                                                      95+
                                          COASTs visits, trainings, labs

                                            350+
                                            Cases supported by MDMs:
                                            Alpha cases, new users and
                                               complex case support

Medical education programs were significantly limited in 2020 due to travel restrictions related to COVID-19 pandemic.

©2021 SeaSpine Orthopedics Corporation. All rights reserved.                                                             7
The New SeaSpine Accelerating the Pace of Innovation & Design - August 2021
7D Surgical Navigation Value Proposition
 Leading the charge in accuracy, safety and hospital economic benefit

            FLASH™                                              SEGMENTAL             SURGEON
          REGISTRATION                                         REGISTRATION           CONTROL

                                      RADIATION-FREE                   FLEXIBLE PURCHASE
                                                                            OPTIONS

The acquisition of 7D Surgical closed on May 20, 2021.

©2021 SeaSpine Orthopedics Corporation. All rights reserved.                                    8
The New SeaSpine Accelerating the Pace of Innovation & Design - August 2021
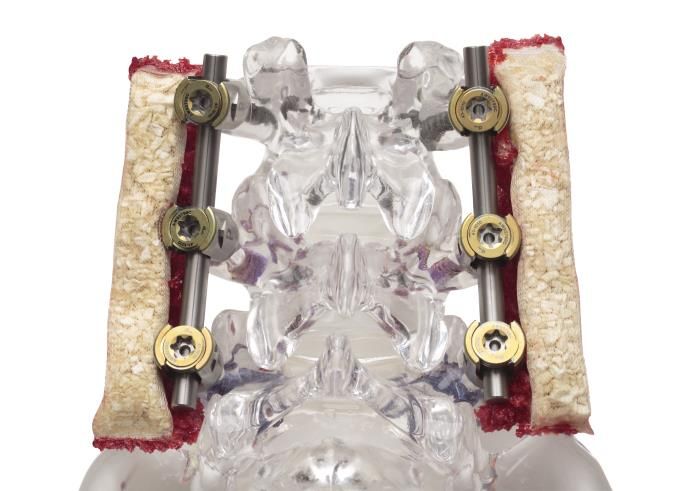
SeaSpine is the Complete Procedural Solution
 Market leading, radiation-free navigation in the OR for surgeon, staff and patient

               INTERBODY                                              FIXATION                    NAVIGATION              SPINAL ACCESS         ORTHOBIOLOGICS
               PORTFOLIO                                             SOLUTIONS                                               SYSTEMS

               NanoMetalene                                     Modular Posterior Open /            Radiation-Free         MIS TLIF Retractor      Premium DBM
           with Reef Topography                                MIS Pedicle Screw Systems       Image-Guidance System                             Products (#2 in US)
                                                                                                with Cranial and Spinal     Lateral Retractor
         3D Printed – Waveform                                    Posterior OCT Systems               Applications          (in development)     Vertically Integrated
                                                                                                                                                   Manufacturing
          Expandable – Explorer                                       Lateral Fixation            Agnostic Imaging
                                                                                                    Acquisition
                                                               Small Stature Fixation System
                                                                                                Segmental (FLASH™)
                                                                     Revision System                Registration

The acquisition of 7D Surgical closed on May 20, 2021

©2021 SeaSpine Orthopedics Corporation. All rights reserved.                                                                                                             9
The New SeaSpine Accelerating the Pace of Innovation & Design - August 2021
U.S. Spine and Orthobiologics Market

                                                                    ®
90% of SeaSpine                                                                      SEASPINE
revenue is from the                                                                ADDRESSABLE
                                                                                    U.S. MARKET
U.S. market
                                                                                  $ 7.1B
$5.4B                                                                                             $1.7B
                                                               CERVICAL AND                                                            BONE GRAFT
                                                               THORACOLUMBAR                                                           SUBSTITUTES,
                                                               INTERBODY AND                                                           GROWTH FACTORS,
                                                               FIXATION DEVICES                                                        CELLULAR GRAFTS

    SPINAL IMPLANTS                                                                                  ORTHOBIOLOGICS

Large established market with opportunity                                                         Opportunity to leverage #2 U.S. market
to take share through differentiated                                                              share position in demineralized bone
technology and value-added training/                                                              matrix (DBM) and strong distribution
education to deliver clinical value                                                               and GPO/IDN relationships
                                                                                                  Source: 2019 – Spine market report

©2021 SeaSpine Orthopedics Corporation. All rights reserved.                                                                                             10
Addressing Over
 $2 Billion of New
 Market Segments
 Launch cadence, speed to market, complexity

©2021 SeaSpine Orthopedics Corporation. All rights reserved.   11
Midline
                                                                                                 Revision

                                                                                                            Deformity
Fixation                                                                          $2.8B
Market Segment                                                                    Addressing
                                                                                less than 50%
                                                                                 of the market

                                                               Mariner® Degen                           Minimally
                                                                    2017
                                                                                                        Invasive
                                                                                                      Surgery (MIS)

©2021 SeaSpine Orthopedics Corporation. All rights reserved.                                                            12
Mariner Midline
                                                                                                                            2019
                                                                                                                                    Mariner Revision
                                                                                                                                          2019

                                                                                                                                                     Mariner
                                                                                                                                                    Deformity
Fixation                                                                                                            $2.8B
                                                                                                                                                        2021

Market Segment                                                                                                     Addressing
                                                                                                                 over $1.5 billion
                                                                                                                  of new market
                                                                                                                    segments
                                                                                            Mariner® Degen
                                                                                                         2017
                                                                                                                                         Mariner MIS
                                                                                                                                                 2019

NOTE: Estimated market size does not take into account any potential lasting impact from the COVID-19 pandemic

©2021 SeaSpine Orthopedics Corporation. All rights reserved.                                                                                                    13
Expandable

                                                                                        PEEK
Interbody                                                                    $1.6B
Market Segment

                                                                   3D
                                                                 Printed

                                                                            Composite

©2021 SeaSpine Orthopedics Corporation. All rights reserved.                                   14
PEEK
                                                                                       2015

                                                               Expandable

Interbody                                                                      $1.6B
Market Segment
                                                                                              Composite
                                                                                                 2015

                                                                       3D
                                                                     Printed

©2021 SeaSpine Orthopedics Corporation. All rights reserved.                                              15
Peek

                                                                                                    Expandable
                                                                                                             2020

Interbody                                                                                                                     $2.8B
Market Segment                                                                                                             Addressing over
                                                                                                                                              NanoMetalene®
                                                                                                                             $800 million       with Reef™
                                                                                                                            of new market      Topography
                                                                                                                              segments
                                                                                                                   3D
                                                                                                                 Printed
                                                                                                                    2021

NOTE: Estimated market size does not take into account any potential lasting impact from the COVID-19 pandemic

©2021 SeaSpine Orthopedics Corporation. All rights reserved.                                                                                              16
©2021 SeaSpine Orthopedics Corporation. All rights reserved.   17
Engineered™
                                                                  Scientific Surface   Economically Viable
 Fusion                                                             Topography             Solutions
 Modular Systems

                                                                     Modularity           Cutting Edge
                                                                                           Innovation
©2021 SeaSpine Orthopedics Corporation. All rights reserved.                                                 18
BEST IN CLASS Advanced DBM Product Portfolio
Proprietary macro features

                                                               ADVANCED
                                                                   DBMS
©2021 SeaSpine Orthopedics Corporation. All rights reserved.              19
Do Cells Improve Bone
 Healing in Spine?
 Preclinical Study

©2021 SeaSpine Orthopedics Corporation. All rights reserved.   20
Study Goal
 Determine the effectiveness of cells in spinal fusion by testing Cellular Bone Matrices
 (CBMs) both with and without cells in the scientifically valid athymic rat spinal fusion model

                                                                                                                                                Sample
                                                                                                                              #                   Size                      Sample Size
   Group                                                       Description                                                   Lots               (# rats)                  (fusion masses)                                    Fusion Rate
   Leading CBM 1                                               DBM Particles w/ cells (DEAD)                                     3                  N=9                                N=18                                     0/18 (0%)
                                                               DBM Particles w/ cells (LIVE)                                     3                  N=9                                N=18                                     0/18 (0%)
   Leading CBM 2                                               DBM Fibers w/ cells (DEAD)                                        3                  N=9                                N=18                                  11/18 (61%)
                                                               DBM Fibers w/ cells (LIVE)                                        3                  N=9                                N=18                                  11/18 (61%)
   OsteoStrand Plus                                            DBM Fibers                                                        3                  N=9                                N=18                                  17/18 (94%)

Abedi, MD, A., Formanek, BA, B., Russell, PhD, N., et al. “Examination of the Role of Cells in Commercially Available Cellular Allografts in Spine Fusion.” The Journal of Bone & Joint Surgery. October 20, 2020; 102 (24): e135. DOI 10.2106/JBJS.20.00330

©2021 SeaSpine Orthopedics Corporation. All rights reserved.                                                                                                                                                                                         21
Not Fused                                            Partially Fused                                                    Fused

 Conclusion
  • SeaSpine’s OsteoStrand Plus
    DBM product outperformed the
    cellular graft products tested

  • The cellular component of
    CBMs did not improve bone
    formation in spine in rats
                                                                                                  0/36 fused (0%)                                         22/36 fused (61%)                                       17/18 fused (94%)
                                                                                                  Leading CBM 1                                            Leading CBM 2                                          OsteoStrand Plus /
                                                                                                                                                                                                                      SeaSpine

Abedi, MD, A., Formanek, BA, B., Russell, PhD, N., et al. “Examination of the Role of Cells in Commercially Available Cellular Allografts in Spine Fusion.” The Journal of Bone & Joint Surgery. October 20, 2020; 102 (24): e135. DOI 10.2106/JBJS.20.00330

©2021 SeaSpine Orthopedics Corporation. All rights reserved.                                                                                                                                                                                         22
What Drives Spinal Fusion:
                                                                Cells or Growth Factors?

                                                                (it’s the growth factors)

©2021 SeaSpine Orthopedics Corporation. All rights reserved.                                23
Financial Highlights
 Q2 21 Financial Results and FY 21 Guidance

                                    Q2 21                                                                        FY 2021                                                                                 Liquidity
                                   Revenue                                                                      Guidance                                                                                 As of June 30, 2021

     Total Revenue $47.5M                                                                  Total Revenue                                                                          • $120.7M cash and cash
      • 66% Year-over-Year Growth                                                             • $201+6%
                                                                                                    million to $205 million                                                         equivalents
                                                                                                   (+7% 30%
                                                                                              • Reflects U.S.)to 33% YOY
     US Revenue $42.6M                                                                          growth vs. 2020
      • 64% Year-over-Year Growth                                                                                                                                                 • $157.2M total potential
                                                                                              • Reflects 26% to 29% YOY
         • Spinal Implants and Enabling                                                         growth vs. 2019
                                                                                                                                                                                    liquidity*
           Technologies: 62% YOY Growth
         • Orthobiologics:                      67% YOY Growth                             Adjusted Gross Margin                                                                  • No borrowings under credit
     Int’l Revenue $4.9M / 81% Growth                                                         • 100 to 150 bps increase vs. 2020                                                    facility

                                                                                                           56%
Revenue and Adjusted Gross Margin guidance information is as of August 2, 2021, based on guidance provided by SeaSpine leadership on that date. Inclusion of this information in this presentation is not a confirmation or an
                  update of, and should not be construed or otherwise assumed to reflect any confirmation or update of, that guidance by SeaSpine leadership as of any date other than August 2, 2021.

Adjusted Gross Margin is a non-GAAP financial measure that is not calculated in accordance with generally accepted accounting principles, or GAAP. This non-GAAP financial measure should not be considered a replacement
         for, and should be read together with, the most directly comparable GAAP financial measure. Reconciliations to the most directly comparable GAAP measures are provided in Appendix A to this presentation.

 *Total potential liquidity reflects cash on hand plus maximum potential borrowing capacity of credit facility, assuming exercise of $10M accordion feature, and based on eligible accounts receivable
 and inventory and assuming minimum fixed charge coverage ratio is not achieved

 ©2021 SeaSpine Orthopedics Corporation. All rights reserved.                                                                                                                                                                  24
Financial Highlights
   Accelerating Revenue Growth from Investments in Product Innovation

                                       Total Revenue ($ in millions)                                                                           New Product Revenue ($ in millions)
                                                                                                                $70.0                                                                                     80.0%
$160.0                                                                                           19%      20%               US Spinal Implants New Product Revenue
                                                                                                                                                                                                  74.0%
                                                                            $159.1                                                                                                     66.1%              70.0%
                                                                                       $154.3                   $60.0       US Orthobiologics New Product Revenue
                                                                   $143.4                                                                                                      57.8%
                                                                                                          15%                                                                                             60.0%
$120.0           $128.9                 $131.8                                                                  $50.0       US Spinal Implants New Products as % of Total
                                                                            11%                                                                                        46.6%
                                                                                                                                                                                                          50.0%
                                                                    9%                                    10%               US Ortho New Products as % of Total
                                                                                                                $40.0                                                                          40.0%
 $80.0                                                                                           $89.4                                                                                                    40.0%
                                                                                                                                                       30.1%                           31.5%
                                                                                                                $30.0
                                                                                                          5%
                                           2%                                                                                                                                                             30.0%
                                                                                                                                                                               21.9%
                                                                                                                $20.0
 $40.0                                                                                                                                                                                                    20.0%
                                                                                                          0%
                                                                                        -3%                                             9.7%                           8.4%
                   -3%                                                                                          $10.0                                                                                     10.0%
                                                                                                                                                       2.3%
   $-                                                                                                     -5%
                                                                                                                 $0.0                                                                                     0.0%
                   2016                   2017                     2018     2019        2020    H1 2021
                                                                                                                        Q3/Q4 15        2016           2017            2018    2019    2020    H1 21
                                                   Total Revenue            Revenue Growth

                     • 2020 revenue and revenue growth were negatively impacted by deferral of spine surgeries caused by the COVID-19 pandemic.
                     • YTD 2021 revenue growth is vs. comparable period for 2019, which management believes is a more informative comparison than 2020 because of
                       the significant adverse impacts of COVID-19 on 2020 revenue

    ©2021 SeaSpine Orthopedics Corporation. All rights reserved.                                                                                                                                       25
Financial Highlights
        Adjusted Gross Margin Expansion and Adjusted EBITDA Improvement
                                                      Adjusted Gross Margin                                                                                   Adjusted EBITDA Loss ($ in millions)
$35.0                                                                                                                 69.0%
                                                                 68.0%                                                         -$0.5                                         $(0.1)
                                                                                                                      68.0%
$30.0
                                                                                                                      67.0%
                                                                                                                                                                                              $(3.9)                    $(3.5)
$25.0
                                                                                                                      66.0%                                                                                    $(5.2)
                                                                                                                               -$3.0        $(6.2)
$20.0                                                                                                    64.5%        65.0%                                 $(6.8)
                                                                                        64.0%
$15.0                                   63.5%                                                            $30.6        64.0%
                                                                 $29.4   $29.4
                                                                                         $26.9
                 $22.6                                                                                                63.0%    -$5.5
$10.0                                                                     63.3%
                                         $18.1
                  62.6%                                                                                               62.0%
 $5.0
                                                                                                                      61.0%

 $0.0                                                                                                                 60.0%    -$8.0
                 Q1 20                   Q2 20                   Q3 20   Q4 20           Q1 21           Q2 21                              Q1 20           Q2 20            Q3 20            Q4 20            Q1 21    Q2 21
                                             Adjusted Gross Profit         Adjusted Gross Margin

                         • Q3 2020 Adjusted Gross Margin benefitted from very low excess and obsolete inventory charges, primarily as a result of atypically low investment
                           in spinal implant set purchases and deployments in the first half of 2020 due to COVID-19 business risks
                         • Q3 2020 Adjusted EBITDA loss benefitted from a sharp rebound in revenue and the benefits of reduced travel expense, tradeshow cancellations
                           and cost reduction measures implemented by SeaSpine in response to COVID-19 business risks

                                          Adjusted Gross Margin and Adjusted EBITDA Loss are non-GAAP financial measures that are not calculated in accordance with generally accepted accounting principles, or
                                           GAAP. These non-GAAP financial measures should not be considered a replacement for, and should be read together with, the most directly comparable GAAP financial
                                                                 measures. Reconciliations to the most directly comparable GAAP measures are provided in Appendix A to this presentation.

        ©2021 SeaSpine Orthopedics Corporation. All rights reserved.                                                                                                                                                             26
Financial Highlights
   Strong Liquidity Position Enables Continued Investment in Growth
    TOTAL POTENTIAL LIQUIDITY ($ in millions)

$160.0                                                                                                                                                  $157.2

$140.0                                                                                                                                                  $36.5
                                                                                                                                                                 ➢ Cash and Access to Cash to Fund our
                                                                                                                                               $113.3
                                                                                                                                                                   Growth Strategy
$120.0

$100.0                                                                                                     $90.5                                                 ➢ Investments to Support Growth
                                                                                                                                               $36.5
                                                                                                                                                                     o New Product Launches
 $80.0
                                             $59.9                                                        $36.5                                                      o Deploy Additional Spinal Implant Sets
                                                                                                                             $56.7
 $60.0             $47.0                                                                                                                                $120.7       o Training & Education
                                                                   $41.1
 $40.0
                                             $26.5                              $37.3                                                                                o Clinical Evidence/Studies
                                                                                                                            $36.5              $76.8
                                                                   $26.5                                  $54.0
                                                                                                                                                                     o Strategic acquisitions ($28.3M cash
 $20.0             $47.0                                                        $26.5
                                             $33.4                                                                                                                     used in May 2021 for 7D Surgical
                                                                   $14.6                                                    $20.2
   $-
                                                                                $10.8                                                                                  acquisition)
                    Jul-15                   Dec-15                Dec-16       Dec-17                    Dec-18             Dec-19            Dec-20   Jun-21

                                                        Cash and Investments   Credit Facility Capacity            Total Potential Liquidity
                                                                                                                                                                 ➢ Liquidity position further strengthened by
                                                                                                                                                                   $94.5M follow-on offering executed in
        Total Potential Liquidity reflects cash on hand plus maximum potential borrowing capacity of credit facility,                                              April 2021
        assuming exercise of $10M accordion feature, and based on eligible accounts receivable and inventory and
        assuming minimum fixed charge coverage ratio is not achieved

   ©2021 SeaSpine Orthopedics Corporation. All rights reserved.                                                                                                                                          27
Investment                                                    Innovative Procedural
                                                               Solutions and Enabling
                                                                                          Improved Clinical
                                                                                            Outcomes and
 Highlights                                                         Technologies           Economic Value

 Focused, pure-play
 spine market-share taker

                                                               Strengthened Distributor   Well Capitalized to
                                                                    Partnerships          Execute Strategy

©2021 SeaSpine Orthopedics Corporation. All rights reserved.                                                    28
Final image –stretching on the beach or

©2021 SeaSpine Orthopedics Corporation. All rights reserved.   29
APPENDIX A
    Reconciliation of Non-GAAP Financial Measures to GAAP Financial Measures
                            ($ in millions)                         Q1 20     Q2 20     Q3 20     Q4 20     Q1 21     Q2 21               In addition to GAAP results, SeaSpine provides two non-GAAP
                                                                                                                                          financial measures: earnings (loss) before interest, taxes, depreciation
Revenue                                                           $    36.1 $    28.6 $    43.2 $    46.4 $    42.0 $    47.5             and amortization and excluding the impact of stock-based
Cost of goods sold                                                     13.8      11.7      14.1      17.3      15.4      17.5             compensation, intangible asset impairment charges, spinal set
Gross profit                                                      $    22.3 $    16.9 $    29.1 $    29.1 $    26.6 $    30.0             instrument replacement and impairment expenses, idle manufacturing
                                                                                                                                          plant costs, other income / expense, and acquisition and integration-
Gross margin %                                                       61.8%     59.2%     67.4%     62.8%     63.4%     63.2%              related charges (“Adjusted EBITDA Loss”) and gross margin excluding
                                                                                                                                          technology-related intangible asset amortization expense and idle
  Non-GAAP adjustments                                                                                                                    manufacturing plant costs (“Adjusted Gross Margin”).

Technology-related intangible asset amortization $                      0.3 $      0.2 $       0.3 $      0.3 $      0.3 $         0.6    Management believes that the presentation of Adjusted EBITDA Loss
Idle manufacturing plant costs                                          -          1.0         -          -          -             -      and Adjusted Gross Margin provides important supplemental
Adjusted Gross Profit                            $                     22.6 $     18.1 $      29.4 $     29.4 $     26.9 $        30.6    information to management and investors regarding financial and
                                                                                                                                          business trends relating to SeaSpine’s results of operations.
Adjusted Gross Margin                                                 62.6%      63.5%       68.0%      63.3%      64.0%         64.5%    Management uses Adjusted EBITDA Loss and Adjusted Gross Margin
                                                                                                                                          when evaluating operating performance because it believes that the
                                                                                                                                          exclusion of the items described above, for which the amounts and/or
                                                                                                                                          timing may vary significantly depending upon SeaSpine’s acquisition
                            ($ in millions)                         Q1 20      Q2 20      Q3 20       Q4 20      Q1 21      Q2 21
                                                                                                                                          and integration activities, for which the amounts are non-cash in
GAAP net loss                                                     $   (12.6) $   (13.7) $     (6.6) $   (10.3) $   (12.7) $     (5.2)     nature, and/or for which the amounts are not expected to recur at the
  Non-GAAP adjustments                                                                                                                    same magnitude, provides a supplemental measure of our operating
                                                                                                                                          results that facilitates comparability of our financial condition and
Depreciation and intangible asset amortization                    $     2.6 $       2.6 $      2.7 $      2.8 $       2.7    $     3.1
                                                                                                                                          operating performance from period to period, against our business
Other expense (income)                                                 (0.2)       (0.0)      (0.1)      (0.1)        0.2    $    (6.1)   model objectives, and against other companies in our industry.
Provision for income taxes                                              0.0         0.0        0.1        0.1         0.0    $     0.2    Management has chosen to provide this information to investors so
                                                                                                                                          they can analyze our operating results in the same way that
Idle manufacturing plant costs                                          -           1.0        -          -           -      $     -
                                                                                                                                          management does and use this information in their assessment of our
Spinal set instrument replacement expense                               0.4         0.5        0.6        1.2         0.7    $     0.9    core business and the valuation of SeaSpine.
Spinal set instrument impairment expense                                0.2         -          -          -           -      $     -
                                                                                                                                          Reconciliations of these non-GAAP financial measures to their nearest
Stock-based compensation                                                2.0         2.8        3.2        2.4         2.5    $     3.1
                                                                                                                                          GAAP financial measures are provided in the tables to the left.
Acquisition and integration-related charges                             -           -          -          -           1.3    $     0.5
Impairment on intangible assets                                         1.3         -          -          -           -      $     -      For further information regarding our use of non-GAAP financial
                                                                                                                                          measures, please refer to the Current Report on Form 8-K that
  Total Non-GAAP adjustments                                      $     6.3 $       6.9 $      6.4 $      6.5 $       7.5    $     1.7
                                                                                                                                          SeaSpine filed with the Securities and Exchange Commission on
Adjusted EBITDA loss                                              $    (6.2) $     (6.8) $    (0.1) $    (3.9) $     (5.2)   $    (3.5)   August 2, 2021.

   ©2021 SeaSpine Orthopedics Corporation. All rights reserved.                                                                                                                                           30
You can also read