Q2 2020 EARNINGS PRESENTATION - August 6, 2020 - Turtle Beach Corporation

 
CONTINUE READING
Q2 2020 EARNINGS PRESENTATION - August 6, 2020 - Turtle Beach Corporation
Q2 2020
EARNINGS PRESENTATION

August 6, 2020
Q2 2020 EARNINGS PRESENTATION - August 6, 2020 - Turtle Beach Corporation
SAFE HARBOR
Forward-Looking Information
This presentation includes forward-looking information and statements within the meaning of the federal securities laws. Except for historical information contained in this release, statements in this release
may constitute forward-looking statements regarding assumptions, projections, expectations, targets, intentions or beliefs about future events. Statements containing the words “may”, “could”, “continue”,
“would”, “should”, “believe”, “expect”, “anticipate”, “plan”, “goal”, “estimate”, “accelerate”, “target”, “project”, “intend” and similar expressions constitute forward-looking statements. Forward-looking
statements involve known and unknown risks and uncertainties, which could cause actual results to differ materially from those contained in any forward-looking statement. These statements are based on
management’s current belief, as well as assumptions made by, and information currently available to, management. While the Company believes that its expectations are based upon reasonable assumptions,
there can be no assurances that its goals and strategy will be realized. Numerous factors, including risks and uncertainties, may affect actual results and may cause results to differ materially from those
expressed in forward-looking statements made by the Company or on its behalf. Some of these factors include, but are not limited to: risks related to the substantial uncertainties inherent in the acceptance of
existing and future products; the difficulty of commercializing and protecting new technology; the impact of competitive products and pricing; the impact of the coronavirus (COVID-19) pandemic on consumer
demands and manufacturing capabilities; risks relating to, and uncertainty caused by or resulting from, the COVID-19 pandemic; the Company's partnerships with influencers, athletes and esports teams; risks
associated with the expansion of our business, including the implementation of any businesses we acquire, the integration of such businesses within our internal control over financial reporting and operations;
and our liquidity. These risks may be in addition to the other factors and matters discussed in the Company’s most recent Annual Report on Form 10-K, Quarterly Report on Form 10-Q and other periodic reports
filed with the Securities and Exchange Commission. Except as required by the securities laws of the United States, the Company does not intend to publicly update or revise these forward-looking
statements after the date of this release whether as a result of new information, future developments or otherwise. This presentation also contains trademarks and trade names that are property of their
respective owners.

Non-GAAP Financial Measures
In addition to its reported results, the Company has included in this presentation certain financial results, including adjusted EBITDA, adjusted net income, and constant currency revenue, that the Securities and
Exchange Commission defines as “non-GAAP financial measures.” Management believes that such non-GAAP financial measures, when read in conjunction with the Company's reported results, can provide
useful supplemental information for investors analyzing period-to-period comparisons of the Company's results. “Adjusted Net Income” is defined as net income excluding (i) integration and transaction costs
related to the acquisition of the business and assets related to the ROCCAT brand, (ii) the effect of the mark-to-market requirement of the financial instrument obligation, (iii) any change in fair value of contingent
consideration and (iv) the release of valuation allowances on deferred tax assets. “Adjusted EBITDA” is defined by the Company as net income (loss) before interest, taxes, depreciation and amortization, stock-
based compensation (non-cash), and certain non-recurring items that we believe are not representative of core operations (e.g., the integration and transaction costs related to the acquisition of the business and
assets related to the ROCCAT brand, the mark-to-market adjustment for the financial instrument obligation and the change in fair value of contingent consideration). “Constant currency revenue” is defined by
the Company as revenue excluding the impacts of fluctuations in exchange rates from prior periods. These non-GAAP financial measures are presented because management uses non-GAAP financial
measures to evaluate the Company’s operating performance, to perform financial planning, and to determine incentive compensation. Therefore, the Company believes that the presentation of non-GAAP
financial measures provides useful supplementary information to, and facilitates additional analysis by, investors. The presented non-GAAP financial measures exclude items that management does not believe
reflect the Company’s core operating performance because such items are inherently unusual, non-operating, unpredictable, non-recurring, or non-cash. See a reconciliation of GAAP results to Adjusted Net
Income and Adjusted EBITDA included in the appendix for the three months ended June 30, 2020 and 2019.

  © 2020 Turtle Beach Corporation. All Rights Reserved.                                                                                                                                                                     2
Q2 2020 EARNINGS PRESENTATION - August 6, 2020 - Turtle Beach Corporation
TURTLE BEACH EARNINGS

Net revenue up 93% to record $79.7M ($80.1M constant currency)

Gross margin up 480 basis points to 36.7%

Net income increased >3x to $8.2M vs. $2.4M

EPS of $0.51 vs. $(0.16)

Adjusted EBITDA up >8x to $12.9M vs. $1.6M

Cash & cash equivalents of $21.2M

Healthy balance sheet with no short or long-term debt

                                                                 3
Q2 2020 EARNINGS PRESENTATION - August 6, 2020 - Turtle Beach Corporation
In 2019, Turtle Beach acquired ROCCAT, a leading PC gaming accessories brand, to bring their award-winning product portfolio to more gamers globally.

                              #1
                IN GAMING AUDIO
                  The Global Market Leader In
             Console Gaming Headsets for 10 years                                                       Broad Portfolio
                                                                                                   of PC Gaming Accessories
                   40 Million+
              Headsets Sold Since 2010
                                                                                                    Award Winning Design
                                                                                                      and Build Quality

                                                                                                Industry Leading Innovations
              INNOVATION AT
             EVERY PRICE POINT                                                        Titan Click – Titan Switch – AIMO Intelligent Lighting            4   4
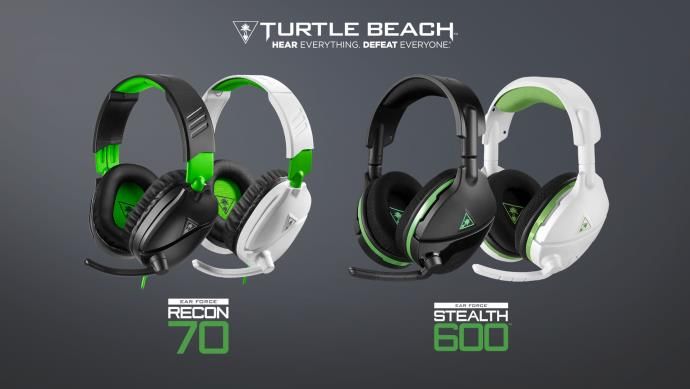
Q2 2020 EARNINGS PRESENTATION - August 6, 2020 - Turtle Beach Corporation
WHAT'S NEW

                                                                            TOP YOUTUBERS ALI-A AND CLARE SIOBHAN TEAM-UP WITH
                                                                            ROCCAT
                                                                            Already fans of Turtle Beach gaming headsets, the two UK-based influencers – with over
                                                                            24 million combined subscribers – are now fully equipped with the latest award-winning
                                                                            gear from ROCCAT for their PC gaming stations. Clare's YouTube channel has over 1.7
                                                                            million subscribers and is rapidly growing, while Ali-A has over 23 million subscribers
                                                                            and is globally famous for his Call of Duty and Fortnite videos.

                                                                            TURTLE BEACH HITS RECORD RETAIL SALES & INCREASED SHARE
                                                                            In May 2020, the NPD Group released data that showed record April 2020 results for the
                                                                            market and for Turtle Beach. The Company's April 2020 retail sales were more than
                                                                            double the brand's all-time high from April 2018. All 7 top-selling headsets, and 8 of the
                                                                            top-10 best-selling headsets were from Turtle Beach, while the Recon 70 for Xbox One
                                                                            and wireless Stealth 600 for Xbox One were top performers.

                                                                                                                                                                         5
1. Source: The NPD Group/Retail Tracking Service/Video Games/Dollars/US/Apr 2019 – Mar 2020; YTD April 2020 and April 2020
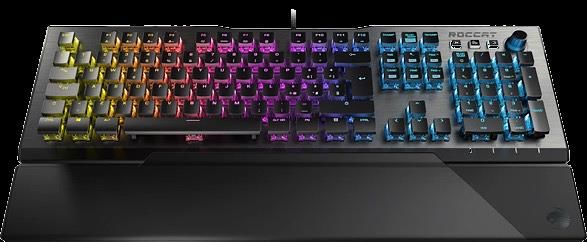
Q2 2020 EARNINGS PRESENTATION - August 6, 2020 - Turtle Beach Corporation
QUARTERLY

    $ in millions (except per-share data)            2019 Q2    2020 Q2                                           Commentary

                                                                   $79.7          Continued increase driven by stay-at-home orders plus the ability to significantly
     Revenue                                           $41.3    ($80.1 constant
                                                                   currency)      increase production, fill retailers order & gain market share.

                                                                                  Volume-driven fixed cost leverage, lower than normal promotional spending given
     Gross Margin                                      31.9%      36.7%           revenue surge, favorable business mix, partially offset by over $4M in higher air
                                                                                  freight spend to facilitate revenues.

                                                                                  Inclusion of costs associated with the ROCCAT acquisition (completed May 2019)
     Operating Expenses                                $15.5       $19.3
                                                                                  and portion of the roughly $12M incremental growth spend.

     Adjusted EBITDA¹                                   $1.6       $12.9          Reflects above factors.

     Net Income (Loss)                                 $(2.4)       $8.2          Reflects above factors.

                                                                                  Reflects above factors; 14.6M weighted average diluted shares in Q2-19 vs. 16.2M
     Diluted EPS                                      $(0.16)      $0.51
                                                                                  in Q2-20 (due to loss vs. gain).

     Adjusted Diluted EPS¹                            $(0.06)      $0.42          Reflects above factors.

1. See appendix for a reconciliation of non-GAAP measures.                                                                                                             6
Q2 2020 EARNINGS PRESENTATION - August 6, 2020 - Turtle Beach Corporation
BALANCE SHEET

                         Capitalization                               Balance Sheet Improvements

                           At June 30, 2019   At June 30, 2020   •   Cash and equivalents increased
                                                                     significantly due to record revenue,
                                                                     higher margins and fixed cost leverage.
Cash & Equivalents               $3.4M            $21.2M
                                                                 •   Inventory decline driven by record Q2
Inventories                     $50.4M            $45.0M             '20 revenue (with much in transit).

                                                                 •   ROCCAT purchase price of $12.7M
Revolver (asset-based)          $10.8M             $0.0              funded with cash and borrowings
                                                                     under revolver in 2019.

Total Debt                      $10.8M             $0.0

                                                                                                               7
Q2 2020 EARNINGS PRESENTATION - August 6, 2020 - Turtle Beach Corporation
GEN 8 CONSOLE

   Gen 7 Xbox (Nov 2013)                     Gen 8 Xbox (2020)    Gen 7 PlayStation (Nov 2013)                Gen 8 PlayStation (2020)

   Xbox Series X (announced E3/June 2019)                           PlayStation 5/PS5 (announced April 2019)
   Release: Holiday 2020 (expected November)                        Release: Holiday 2020 (expected November)
   Price: $499 (expected)                                           Price: $499 (expected)

   • Backward compatibility                                         • Backward compatibility
   • Major power increase/faster game access/reduced load times     • Major power increase/faster game access/reduced load times
   • Will support up to 8K resolution                               • Will support up to 8K resolution
   • 3D Spatial Sound (headset required)                            • 3D Spatial Sound (to be confirmed by Sony, headset required)
   • Project xCloud game streaming service                          • PlayStation Now streaming/focus on AAA titles
                                                                    • PS5 Two Versions :
                                                                             •   1)PS5 w/Ultra HD Blu-ray disc drive
                                                                             •   2)PS5 Digital Edition (presumably less expensive)       8
  Source: Microsoft and Sony announcements
Q2 2020 EARNINGS PRESENTATION - August 6, 2020 - Turtle Beach Corporation
XBOX AND PLAYSTATION
                                                                                                                                          “With the launch of new systems and continued sales for existing
                                                                                                                                          consoles, we forecast Microsoft and Sony combined hardware sales will
                                                    PlayStation and Xbox Console Unit Sales                                               set records in 2021 and 2022.”
                                                                                                                                                          David Cole, Head DFC Intelligence, Video games industry analyst
                                       40

                                                                                                                                     •     Console transition has typically created a market decline the year prior
                                                                                                                                           to transition, an increase late in the year of new console launch, and then
                                                                                                                                           several years of accelerated growth post-launch.
                                       30
   Hardware Unit Sales (in millions)

                                                                                                                                     •     Accessories typically follow same pattern with some lag as some users
                                                                                                                                           will wait on new accessory purchases, particularly at the high-end prior to
                                                                                                                                           launch and then upgrading accelerates post-launch.
                                       20
                                                                                                                                     •     DFC predicts the combined XB and PS hardware unit sales for Gen 7 and
                                                                                                                                           Gen 8 in the first three years of launch to be higher than the combined
                                                                                                                                           sales of Gen 6 and Gen 7 in the first three years, setting another record.
                                       10
                                                                                                                                     •     DFC predicts Active Installed Base (AIB) of Gen 8 in the first four years of
                                                                                                                                           launch to be slightly higher than AIB of Gen 7.

                                        0                                                                                            •     Nintendo is not included; a new system core from Nintendo could
                                                                                                                                           substantially increase overall market potential.
                                            2012 2013 2014 2015 2016 2017 2018 2019 2020 2021 2022 2023
                                                                                                                                     •     The charted DFC forecasts are pre-COVID and our above commentary
                                                             Gen 6    Gen 7     Gen 8
                                                                                                                                           reflecting typical console transition market patterns have been impacted
                                                                                                                                           by both the recent stay-at-home surge in gaming sales as well as the
                                                                                                                                           future economic outlook.
Source : DFC Intelligence September 2019 Worldwide Video Game Market Forecasts
                                                                                                                                                                                                                            9
*COVID-19 related stay-at-home guidance and orders have led to significantly increased sales of gaming accessories and disrupted global economies– DFC Intelligence used for this slide have not yet been updated by DFC.
Q2 2020 EARNINGS PRESENTATION - August 6, 2020 - Turtle Beach Corporation
ANTICIPATED CONSOLE HEADSET MARKET DYNAMICS
SIMPLIFIED MARKET MODEL¹
US & CANADA CONSOLE GAMING HEADSET SELL-THROUGH
MILLIONS OF UNITS
                Battle Royale                                         Stay-at-home Orders                       Recent unprecedented increase in gaming and gaming accessories
                          14.8                                                                                  due to stay-at-home orders.

                                                                                        20% or More
                                                                                                                TB analysis indicates drivers are roughly equally caused by:
                            Incremental
                               Battle         +24.8%                                       Expected             1. Existing gamers gaming more
                               Royale                                                    Incremental            2. Influx of new and lapsed gamers gaming with headsets
                               Driven              Results                              Stay-at-home            3. Gaming headset purchases for work/school/socializing via video apps
                              Headset             indicate
                                                                      11.2                  Driven
                                Sales         approximately                             Headset Sales
                                                   40% of                                                       Biggest drivers of potential increase from 2020+ estimates are:
          9.0                                  incremental                                                      •   Stronger influx of new gamers/headsets users continues due to stay-at-home
                                                2018 users
                                                replaced or                                                     •   Faster upgrade/replace cycle among new/lapsed headset users
                                               upgraded in                                                      •   New Xbox/PlayStation consoles increasing Q4 demand more than expected
                             “Normal”
                                                    2019             “Normal”                                   •   Stronger slate of new gen games or major games going “free” model
                                                                      headset              Headset
                              headset
                                                                        sales           purchase lag
                                sales
                              without
                                                                     based on           expected for            Biggest drivers of potential decrease from 2020+ estimates are:
                                                                       larger           new console             •   Headset upgrade/replace cycle slows due to pull forward purchases
                               battle
                                                                     installed           launches in
                               royale
                                                                      base of             late 2020
                                                                                                                •   Inventory constraints on consoles and/or headsets
                              impact
                                                                        users                                   •   Gaming activity slows as economy reopens and recovers from pandemic
                                                                                                                •   Late release of, or lower demand for, the new consoles

                                                                                                                Market sell-in revenues (sales) will vary from sell-through units based
                                                                                                                on channel inventory adjustments to hold weeks-of-supply and ASP
                                                                                                                of product sales

1. This is a highly simplified market model to illustrate overall dynamics - actual market dynamics are much more complex than shown
                                                                                                                                                                                          10
Source: The NPD Group/Retail Tracking Service/Video Games/Dollars/U.S. & Canada/CY 2017, 2018, 2019, 2020; TB analysis of consumer research conducted by NewZoo
INCREASED 2020 OUTLOOK¹
                                           2020 –
                                                         2020 – Updated                        2020 Updated Commentary
                                            Prior
                                                                          Continued strong consumer demand for gaming accessories driven by
                                                                          new & existing gamers, increased use of headsets for non-gaming
                Net Revenue              $224-$234M         ~$300M
                                                                          uses, further increase in demand spurred by new holiday season
                                                                          console launches. Second half net revenue expected to be ~$185M.
                                                                          Higher operating leverage offset by increased air freight, tariff costs &
                Gross Margin              Low 30%s         Low 30%s       impact of tooling & certification investments for new product
                                                                          development.
                                                                          Higher revenue & gross margin partially offset by $10+M in air freight
                                                                          to enable supply & increased revenue, $2-3M in tariffs, as well as
                Adj. EBITDA               $9M-$14M          ~$30M
                                                                          ~$12M in marketing & product-related investments to drive long term
                                                                          growth. Second half Adj. EBITDA expected to be ~$20M.

                                                                          Higher average share count due to a greater portion of the year
                Diluted Shares              ~15.0M          ~16.5M
                                                                          showing positive net income.

                                                                          Reflects above factors; anticipates full year effective tax rate of
                GAAP EPS                 $(0.22)-$0.03      ~$0.85
                                                                          ~ 28%. Second half GAAP EPS expected to be ~$0.50.

                                                                          Reflects above factors, excludes ROCCAT transaction & integration
                Adj. EPS                 $(0.16)-$0.09      ~$0.80        costs, also anticipates full year effective tax rate of approximately
                                                                          28%. Second half Adj. EPS expected to be ~$0.50.

1. Guidance updated on August 6, 2020.                                                                                                                11
REVENUE & ADJUSTED EBITDA PROFILE
Company Revenues                                                        Adjusted EBITDA2
Millions                                                                Millions

                                                              ~$300M                       $57.7M
                        $287M
                          Battle                                                           Battle
                          Royale            $235M                                          Royale
                                                                                           Surge
                          Surge                                                                               ~$12M of
                                                                                                               growth
                                                                                                            investments

    $149M                                                                                                   ~$30M
                                                                                                    $22.8

                                                                              $11.6M

       2017                2018                2019            2020E1              2017     2018    2019    2020E1
 1. Guidance updated on August 6, 2020.
 2. See appendix for a reconciliation of non-GAAP measures.                                                               12
TURTLE BEACH EARNINGS

•     Record performance driven by stay-at-home orders increasing
      demand and strong operational execution

•     Continued leadership in the $1.3B1 console gaming headset
      market with ten consecutive years of over 40% market share

•     Exceeding expectations in pursuit of $3.0B1 PC accessories
      market enabled by 2019 acquisition of leading German PC
      gaming accessory maker, ROCCAT

•     Further increasing investments to drive future revenue growth by
      expanding PC portfolio and developing ROCCAT brand

•     Healthy balance sheet with no long-term debt

•     Authorization of up to $15M share repurchase with $2.5M in
      shares purchased in 2019

1. Newzoo 2020 Peripheral Market estimates – updated in March 2020
                                                                                          13
2. The NPD Group/Retail Tracking Service/Video Games/Dollars/US/Jan2010-Dec 2019 update
CONTACT US
 INVESTOR RELATIONS:                        PR/MEDIA CONTACT:
 Cody Slach/Sean McGowan                    Maclean Marshall
 Gateway                                    Turtle Beach
 +1 (949) 574-3860                          +1 (858) 914-5093
 HEAR@gatewayir.com                         maclean.marshall@turtlebeach.com

COMPANY WEBSITES
www.turtlebeachcorp.com    |   www.turtlebeach.com   |   www.roccat.org
APPENDIX

           15
GAAP NET INCOME TO ADJUSTED NET INCOME RECONCILIATION

                                                                       Three Months Ended
                                                       June 30, 2020                        June 30, 2019
Net Income (Loss)
GAAP Net Income (Loss)                             $                    8,204     $                         (2,373)

Adjustments, net of tax:
Gain on financial instrument obligation                                    —                                   —
Gain on acquisition-related settlement                                  (1,702)                                —
Change in fair value of contingent consideration                          223                                  —
Acquisition integration costs                                              44                                1,477
   Non-GAAP Earnings                               $                    6,769     $                          (896)

Diluted Earnings Per Share
GAAP- Diluted                                      $                     0.51     $                          (0.16)

Gain on financial instrument obligation                                    —                                   —
Gain on acquisition-related settlement                                   (0.10)                                —
Change in fair value of contingent consideration                         0.01                                  —
Acquisition integration costs                                              —                                 0.10
   Non-GAAP- Diluted                               $                     0.42     $                          (0.06)

                                                                                                                      16
GAAP TO ADJUSTED EBITDA RECONCILIATION

                                                                                                             Three Months Ended
                                                                                                                 June 30, 2020
                                                                                                                                Adj
                                                                    As                Adj                  Adj                 Stock                                       Adj
                                                                 Reported        Depreciation        Amortization          Compensation             Other   (1)           EBITDA
    Net revenue                                              $        79,680 $                   - $                 - $                    - $                     - $      79,680
    Cost of revenue                                                   50,453                 (593)                   -                 (280)                        -        49,580
         Gross Profit                                                 29,227                 593                     -                  280                         -        30,100

    Operating expenses                                                19,270                 (435)               (220)                (1,126)                     (63)       17,427

    Operating income                                                     9,957              1,028                 220                  1,406                      63         12,674

    Interest expense                                                       83
    Other non-operating expense, net                                  (1,616)                                                                                1,388               (228

    Income before income tax                                          11,490
    Income tax expense                                                   3,286
         Net income                                          $           8,204                                                                 Adjusted EBITDA $             12,902

1. Other includes certain business acquisition costs, gain on an acquisition-related settlement and change in fair value of contingent consideration.                                   17
GAAP TO ADJUSTED EBITDA RECONCILIATION

                                                                                                              Six Months Ended
                                                                                                                 June 30, 2020
                                                                                                                                Adj
                                                                    As                Adj                  Adj                 Stock                                      Adj
                                                                 Reported        Depreciation        Amortization          Compensation            Other   (1)           EBITDA
     Net revenue                                             $      114,687 $                    - $                 - $                    - $                    - $     114,687
     Cost of revenue                                                  74,675              (1,184)                    -                 (338 )                      -        73,153
         Gross Profit                                                 40,012                1,184                    -                  338                        -        41,534

     Operating expenses                                               35,068                 (877)               (443)                (2,067 )               (343)          31,338

     Operating income                                                    4,944              2,061                 443                  2,405                     343        10,196

     Interest expense                                                     252
     Other non-operating expense, net                                 (1,419)                                                                               1,367               (52

     Income before income tax                                            6,111
     Income tax expense                                                  1,462
         Net income                                          $           4,649                                                              Adjusted EBITDA $               10,248

1. Other includes certain business acquisition costs, gain on an acquisition-related settlement and change in fair value of contingent consideration.                                 18
GAAP TO ADJUSTED EBITDA RECONCILIATION

                                                             December 31, 2019   December 31, 2018   December 31, 2017
 Consolidated

 Net Income (Loss)                                                     17,944             39,190              (3,248)

 Depreciation                                                          4,556               3,954               4,074

 Amortization of intangibles                                             642                303                 348

 Interest                                                                929               5,335               7,916

 Taxes                                                                (6,237)               1,737                593

 Stock Compensation                                                    3,558                1,877              1,430

 Restructuring Expense                                                     -                  -                  533

 Goodwill Impairment                                                       -                  -                    -

 Business Transaction Expense                                          3,516                  -                  (79)

 Change in Fair Value of Contingent Consideration                       (471)                 -                    -

 Unrealized loss (gain) on financial instrument obligation             (1,601)             5,291                   -

 Adj EBITDA                                                            22,836              57,687              11,567
                                                                                                                         19
You can also read