Goal Areas - City of Bellevue
←
→
Page content transcription
If your browser does not render page correctly, please read the page content below
Goal Areas
Food to Eat and
                 Roof Overhead
                                  75% rated
                                  affordable
                                  housing as a
                                  community
                                  problem

                    15%        of residents
                    reported not having enough
                    money to pay for housing

Bellevue Food
Banks provided

2,230,884
meals in 2018

                                     30%         of
                                     Bellevue households
                                     are cost burdened by rent

15% of Bellevue college
students reported going
without a meal
Goal #1:
Food to Eat and Roof Overhead
This chapter includes data about:
  ◼ Food security and hunger
  ◼ Emergency financial assistance
  ◼ Affordable housing
  ◼ Housing choice (Section 8) availability
This chapter discusses these topics as they pertain to the broader community. For more
information about how this goal area relates to specific populations (Older Adults, Refugees and
Immigrants, People with Disabilities, School-Aged Children and Youth, and Veterans) within our
community, please see their respective chapters

 Key Findings
    ◼ The high cost of living is repeatedly identified by Bellevue residents and community
      conversations as a top issue. This is true across many socioeconomic segments of
      the population.
    ◼ The lack of affordable housing continues to be reported by residents as the top community
      problem, and this is a substantial problem for moderate-income and low-income
      households, many of whom are cost burdened. Little relief is found in the rental market as
      rental rates are also continuing to increase.
    ◼ The community rated hunger as a major or moderate problem, which has remained
      statistically flat since 2011 showing a consistent need. Non-profit providers also report that
      providing food assistance allows households with limited income to use those funds for
      housing and other basic needs.

Food Security and Hunger
Food insecurity is the limited or uncertain availability of nutritionally adequate and safe foods, as
well as the limited or uncertain ability to acquire acceptable foods in a socially acceptable way.1
Food insecurity can have a devastating effect on a person’s health and wellbeing; it can result
in lower diet quality and less variety, both of which can contribute to being overweight, and
unpredictable availability of food can lead to overeating.2

Community Voice
In the 2019 community and phone survey, 23% of respondents rated hunger as a major or
moderate problem in Bellevue. This figure has remained statistically flat since at least 20113,
showing a consistent need for food security resources.

Prevalence
  ◼ According to the U.S. Department of Agriculture, about one in ten people (10.8%) in
    Washington State is considered food insecure.4
  ◼ In 2017, 7% of Bellevue residents reported running out of food and money for a period of
    time in the past year.5

Human Services | Bellevue, Washington		                                                            63
◼ In 2018, approximately 15% of Bellevue College students reported going without a meal
occasionally, fairly often, or frequently in the past 6 months.6
◼ For information about children and food security and hunger, please see the section School-
Aged Children & Youth.
Service Trends
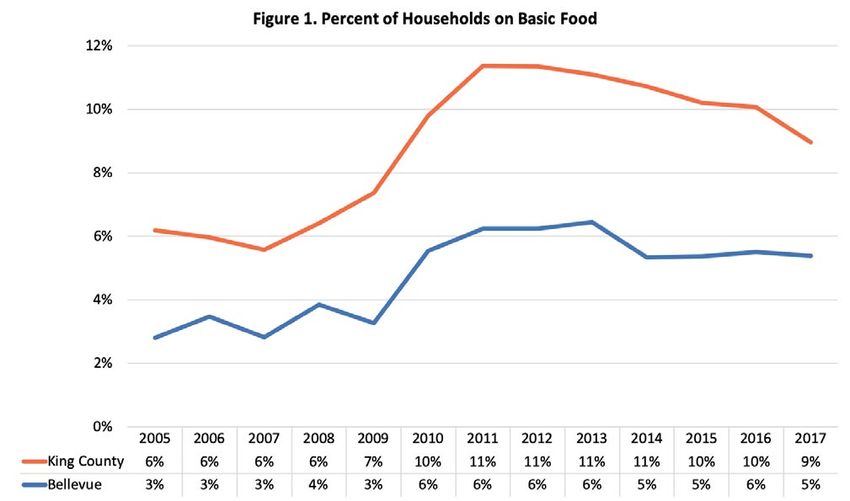
◼ Basic Food includes the federal Supplemental Nutrition Assistance Program (SNAP),
previously known as “food stamps,” and the state-funded Food Assistance Program (FAP) for
legal immigrants. FAP is for individuals who are legal immigrants and meet all the eligibility
requirements for SNAP except citizenship or alien status.7
Source: Washington State Department of Social and Health Services8
◼ The number of Washington residents receiving food stamps has decreased by 13% since
2014. That year, 1.5 million people received food assistance, compared to 1.3 million in
2017.9 Over that same time period, the number of Bellevue residents participating in Basic
Food decreased from 10,072 to 8,310, a reduction of approximately 17 percent. 10
◼ In 2018, King County food banks had a total of 250,203 clients and over 2.2 million visits,
serving more than 1 in 9 King County residents.11
◼ Hopelink’s food assistance programs provide emergency and supplemental food to help
end food insecurity for thousands in our community. In 2018, Hopelink provided a total of
2,230,884 meals, with 13,998 clients receiving food assistance. In total, the average number
of food bank visits for all clients is about 11 per year.12
◼ By mid-2019, Renewal Food Bank provided nearly 20,000 bags of groceries to approximately
3,500 Bellevue residents.13
64 Needs Update | 2019-2020Emergency Financial Assistance
Emergency Financial Assistance programs help keep families from falling through the cracks into
perpetual homelessness. Assistance can include things like utility supports, which keep the home
habitable, or eviction prevention assistance, which protects a family’s rental history, keeps them
from incurring the costs of eviction and, most importantly, ensures the stability of knowing they
have a place to live.
Community Voice
◼ Forty-six percent of providers report clients need emergency financial assistance but cannot
find finanacial assistance resources in the community.14
◼ Staff from the Bellevue School District’s Family Connection Center stated that families often
have a difficult time navigating the system to access emergency financial assistance. Many
programs require the household to have a 3-Day Notice to Vacate to access the funds,
but often families want to avoid a getting a 3-Day Notice because they have a good rental
history.15
Service Trends
◼ In 2018, the City’s Utility Discount Program provided utility discounts and rebates for 994
low-income seniors and disabled residents who receive water, sewer and drainage services
from the City of Bellevue. In 2018, the Utility Tax Rebate Program provided refunds of utility
taxes to 1,037 low-income residents.16 This represents about a 10% decrease in the numbers
served in these programs in 2016.
◼ In 2018, Hopelink helped 1,881 clients through emergency financial assistance and $499,265
was distributed to mitigate crisis and prevent eviction.17
◼ Using funds from the federal Low-Income Home Energy Assistance Program (LIHEAP) and
the Puget Sound Energy (PSE) HELP Program, funded by Puget Sound Energy, Hopelink
helped 10,637 clients and distributed $3,367,432 in heating assistance in 2018. The average
energy assistance provided per household was $710.18
◼ In 2017 and 2018, Solid Ground’s King County Housing Stability Project served 66 Bellevue
households in need of move-in or eviction prevention assistance.19
Affordable Housing
Housing is defined as affordable if its occupants “I live in a little rambler, but many of
pay no more than 30% of their income for rent the other homes in my neighborhood
and utilities or for mortgage, taxes, and insurance. have been torn down and large
According to the U.S. Department of Housing & houses have been built. The property
Urban Development (HUD), households paying taxes keep increasing and are
more than 30% of their income for housing are becoming unaffordable.”
considered cost-burdened. Households paying
more than 50% of their income for housing are ~ Participant, Eastside Neighbors
considered severely cost burdened and may have Network Community Conversation
trouble affording basic necessities such as food,
clothing, transportation, and medical care.
Human Services | Bellevue, Washington 65Community Voice
◼ This was the eleventh consecutive phone/online survey in which lack of affordable housing (as a
community problem) received the greatest percentage of major and combined major/moderate
ratings, at 75%. The percentage of respondents rating homelessness as a major or moderate
problem changed from 35% in 2017 to 42% in 2019, a statistically significant increase.20
◼ Concerns about the cost of living in Bellevue was the most prominent theme across all
Community Conversations, with many feeling that people cannot reasonably afford to live
here anymore.
◼ Regarding Bellevue residents’ ratings of major or moderate problems in their households,
15% of respondents reported not having enough money to pay for housing, 7% reported
living in housing with unaffordable major repairs, and 5% struggled to pay utility bills.21
Prevalence
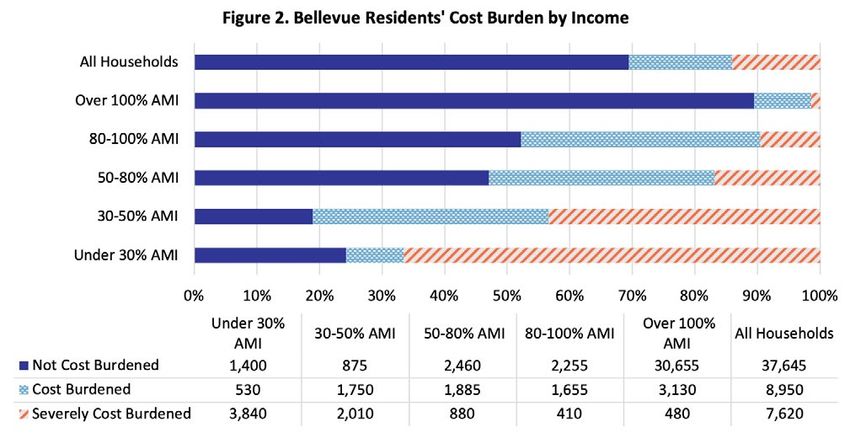
◼ As Figure 2 shows, between 2011 and 2015 (the most recent data available) almost one-third
(30%) of Bellevue households were cost burdened, meaning they spent more than 30% of
their income on housing. This included 14% of households that spend more than 50% of
their income on housing (severely cost burdened). For households whose income is below
half of the area median income, 42% are severely cost burdened. Renters are more likely to
suffer some sort of cost burden than owners.22
Source: U.S. Department of Housing and Urban Development/Comprehensive Housing Affordability Strategy23
◼ In June 2019, the median Bellevue rent was $2,835, an increase over 2018 of almost 4%.24
◼ In East King County, 2018 home prices fell 3.1 percent from a year before, the first time
prices declined on a year-over-year basis since 2012.25 However, the median sale price
for homes in Bellevue in February 2019 was $860,000, an increase of 38% compared to
the same month in 2015.26
66 Needs Update | 2019-2020◼ Job growth continues to outpace housing
growth in Bellevue. Between 2000 and 2018, “One thing I want to mention is that
the number of jobs increased by 22,700, while housing is too costly here. Everyone
housing units increased by only 9,800. With has to work extra to afford to live in
about 1.4 jobs being generated per household, this area.”
Bellevue would have needed 16,800 new units
~Consumer Survey
to house those new workers, resulting in a
deficit of nearly 7,000 housing units. When job
growth outpaces housing growth demand for housing exceeds supply resulting in higher
housing values and less affordability.27
Service Trends
◼ In 2017, Bellevue helped create or preserve about 285 low income units and 103 homeless
beds. All of these units received Bellevue direct assistance through the ARCH Housing Trust
Fund, including Imagine Housing Esterra Park Block 6B in Redmond, Congregations For the
Homeless Men’s Home, Catholic Community Services Women and Family Shelter in Kirkland,
and King County Housing Authority Trailhead in Issaquah. This compares to 2016 when 105
low income units and 61 moderate income units were created. As shown in Figure 3 Bellevue
has helped create or preserve a total of 3,025 units between 1996 and 2018.28
No projects were recommended for funding in 2018.
Figure 3. Affordable Housing Units Created in Bellevue, 1996-2018
Direct Regulatory
Target Population Market Total
Assistance Incentives
Low-income
866 units — 8 units 874 units
(50% of median)
Moderate-income
512 units 371 units 1,239 units 2,122 units
(80% median)
Total Units 1,378 units 371 units 1,247 units 1,996 units
Source: A Regional Coalition for Housing29
◼ In 2017, each Bellevue housing fund dollar leveraged approximately $60 in other funds.
Bellevue’s investment in 2017 affordable projects was $1,570,000 which leveraged
approximately $22.3 million in other local, state, and federal funding in addition to $37.6 in
Low Income Housing Tax Credit equity.30 No projects were recommended for funding in the
2018 Trust Fund Round.
Human Services | Bellevue, Washington 67Housing Choice (Section 8)
Section 8 vouchers help people with low incomes
rent homes on the private market. With a voucher, “Even with a full-time job making
people pay at least 28%, but not more than 40% (in $15 an hour, I cannot find anything
the first year), of their household income for rent and I can afford to rent. Affordable
utilities. King County Housing Authority (KCHA) pays housing wait lists are 3 to 5 years.”
the difference between their portion of the rent and
~Participant, Sophia Way
the amount their landlord requests. Tenant-based
vouchers are portable and a program participant can Community Conversation
take the voucher to any rental property to try and use
it, assuming the rent of the unit is affordable. Project-based Housing Choice Vouchers are used in
KCHA units and nonprofit-owned housing sites.
Prevalence
◼ KCHA’s Section 8 program is not accepting applications, and they last held a lottery for
vouchers in May 2017.31
◼ KCHA administers approximately 340 units of subsidized housing in Bellevue.32
Service Trends
◼ As of June 2019, KCHA had approximately 827 households utilizing tenant-based vouchers
to pay a portion of their rent. 43% of these households have at least one elderly member.
Of the remaining households, 26% have a member with a disability and the remainder are
families, the majority of them with children. In total, these households include 448 children.
The annual rental subsidy associated with these vouchers is over $11.2 million and supports
very low-income households – the average income of tenant-based households in Bellevue
was $16,397 in 2018.33
◼ KCHA has 101 project-based vouchers at eight different non-profit-owned housing sites.34
68 Needs Update | 2019-2020Endnotes
1 Washington State Department of Health. Food Insecurity and Hunger. (2016). DOH Pub. No.
160-015-March 2016. Retrieved August 29, 2019 from http://www.doh.wa.gov/Portals/1/
Documents/Pubs/160-015-MCHDataRptFoodInsecHunger.pdf
2 Child Trends Data Bank. (2016). Food Insecurity. Indicators on Children and Youth. Retrieved
August 29, 2019 from https://www.childtrends.org/indicators/food-insecurity/
3 Northwest Research Group. (2019). City of Bellevue 2019 Resident Needs Assessment Final Report
[PDF file].
4 Coleman-Jensen, A., Rabbit, M. P., Gregory, C. A., & Singh, A. (2018). Household food security in
the United States in 2017. [PDF file]. Retrieved July 18, 2019 from United States Department of
Agriculture: https://www.ers.usda.gov/webdocs/publications/90023/err-256.pdf?v=0
5 Seattle Post Intelligencer (February 27, 2017). Hungry Families: Seattle Communities Ranked by
Food Insecurity. Retrieved August 29, 2019 from http://www.seattlepi.com/local/slideshow/Gun-
deaths-Which-Seattle-area-communities-have-143369/photo-12131971.php
6 Bellevue College (2018). Bellevue College campus needs assessment [PDF file].
7 Washington State Department of Social and Health Services. (2016). Basic Food – 2016. ESA Briefing
Book. Retrieved August 2019 from
https://www.dshs.wa.gov/sites/default/files/ESA/briefing-manual/2016Basic_Food_Assistance.pdf
8 Washington State Department of Social and Health Services. (2018).
9 Washington State Department of Social and Health Services. (2018). DSHS Client Services 2013-
2014 and DSHS Client Services 2016-2017. Retrieved July 9, 2019 from
http://clientdata.rda.dshs.wa.gov/Home/ShowReport2?reportMode=0
10 Washington State Department of Social and Health Services. (2018).
11 Communities Count (2018). Food bank visits, King County (2002-2018). Retrieved July 18, 2019 from
https://www.communitiescount.org/food-bank-visits
12 Hopelink. (2018). Building a Stronger Community – Community Impact Report 2016. Retrieved July
18, 2019 from https://www.hopelink.org/sites/default/files/ImpactReport-2018.pdf
13 City of Bellevue. (2019). Human Services Division Database. [Data file]
14 Respondents, Providers Survey, 2019
15 Participant, Bellevue School District Family Connections Centers Community Conversation, May
28, 2019
16 H. DeWitt (City of Bellevue Utilities Department), Personal Communication, July 19, 2019.
17 Hopelink. (2018).
18 Hopelink. (2018).
19 City of Bellevue. (2019). Human Services Division Database. [Data file]
20 Northwest Research Group. (2019).
21 Northwest Research Group. (2019).
22 Housing and Urban Development: Office of Policy Development and Research. (2018). Consolidated
planning/CHAS data [Data file]. Retrieved July 19, 2019 from https://www.huduser.gov/portal/
datasets/cp.html#2006-2015_query
23 U.S. Department of Housing and Urban Development. (2019). Consolidated Planning/CHAS Data.
Retrieved August 29, 2019 from https://www.huduser.gov/portal/datasets/cp.html#2006-2014_data
Human Services | Bellevue, Washington 6924 Zillow (2019). Market rentals overview: Seattle Metro. Retrieved July 22, 2019 from
https://files.zillowstatic.com/research/public/rental/ZRI.Seattle.395078.pdf
25 Rosenberg, M. The Seattle Times. (2019, January 7). Seattle area’s topsy-turvy home market ends
2018 with Eastside prices falling over the year. The Seattle Times. Retrieved from
https://www.seattletimes.com/business/real-estate/relief-for-seattle-area-condo-buyers-as-prices-
drop-amid-flood-of-new-units/
26 Trulia. Real Estate Market Trends for Bellevue, WA. Retrieved July 19, 2019 from
http://www.trulia.com/real_estate/Bellevue-Washington/market-trends/
27 G. Rousseau (City of Bellevue), personal communication, August 28, 2019
28 K. Nijhuis (ARCH), Personal Communication, August 28, 2019.
29 K. Nijhuis (ARCH), Personal Communication, August 28, 2019.
30 K. Nijhuis (ARCH), Personal Communication, August 28, 2019.
31 King County Housing Authority. (2019). Section 8 waiting list and lottery. Retrieved August 28, 2019
from https://www.kcha.org/housing/vouchers/list
32 D. Landes (King County Housing Authority), Personal Communication, August 2, 2019
33 A. Calkins (King County Housing Authority), Personal Communication, August 2, 2019.
34 D. Landes (King County Housing Authority), Personal Communication, August 2, 2019
70 Needs Update | 2019-2020You can also read