Balanced Business Model, Stable Cash Flow, Growth - bcp ...
←
→
Page content transcription
If your browser does not render page correctly, please read the page content below
Balanced Business
Model, Stable Cash
  Flow, Growth

Quality player in the German
Multifamily sector

Leading Condo developer in
Düsseldorf

May 2020
The purpose of this presentation is to provide information on Brack Capital Properties N.V. (hereinafter: the “Company”), its operations and financial performance. It

                                                                                                                                                                               Legal Disclaimer
does not constitute an offer to purchase or sell securities of the Company or an invitation to receive offers as stated, and is designated only for the provision of
information.
The information provided in the presentation is not an alternative to the gathering and analysis of personal information, does not constitute a recommendation or
opinion and does not constitute an alternative to the personal discretion of any investor.
This presentation and the information included herein were not intended to replace the need to review the reports published by the Company to the public, including
the Company’s periodic reports for 2019 (published on March 18, 2019) and for Q1 FY2020 (published on May 14, 2020).
 The presentation includes plans for operations and/or moves and/or evaluations of the Company in relation to its assets and/or expected yields based on the
Company’s operations as of today constitutes forward- looking information, as the term is defined in the Securities Law, 5728-1968 (hereinafter: the “Securities Law”),
including forecasts, business goals, evaluations and standards, and including information presented through drawings, graphs, surveys and any other information, in
any manner provided, relating to the future events or matters, the realization of which is uncertain and not under the Company’s control. The realization and/or non-
realization of the forward-looking information as stated will be impacted by factors that cannot be evaluated from the outset and are not under the Company’s
control, including risk factors characterizing the Company’s operations, as detailed in the Company 2019 annual report and in Q1 FY2020 , and from developments in
the general and financial environment in the Company’s areas of business, and external factors impacting its operations, including the impact of the spread of
Coronavirus (COVID-19) and the measures taken by world governments to eliminate the pandemic and handle with its effects. It shall be clarified that this presentation
shall not, in any manner limit the Company from taking any business decisions, including with respect to the purchase or sale of any assets, including in a manner that
may differ from this presentation or the forecasts presented in it.
This presentation includes data of expected profits, sales, income and expected rate of development profit, as detailed in these slides is forward-looking information,
inter alia, regarding expected profits, sales, income and expected rate of development profit, that is not under the Company’s full control and the fulfillment of which
is not certain. The information based on the current information existing that currently exits in the Company, regarding: the demand for residential areas in the city,
market prices of the residential areas in the city in general and in the area of the projects specifically (including comparable competing projects), accumulated
knowledge and experience of the Company’s management and forecasts and estimates of the Company regarding the construction, development, marketing costs,
etc, and additional assessments that were made by the Company. There is no certainty that the procedures for land designation change will take place and / or be
completed, if any, as their completion is subject to planning and construction procedures that are governed by German law, which is not under the Company’s control.
Furthermore, even if the required approvals shall be obtained, the Company will decide to establish the projects on its own and the construction of projects will take
place, a change in circumstances or an increase in construction costs and / or extraordinary conditions may materially change the Company’s detailed evaluations, and
may materially impact the expectations of income from the projects and their overall profitability. Similarly, there is not any certainty that the processes of the zoning
change of the real estate sites will take place and/or will be completed, if at all, since their completion is subject to the planning and construction proceedings required
according to the German law, the completion of which is not under the Company’s control. In addition, it should be noted that the Company's reference to after-tax
profitability is based on the Company's assessment, in accordance with the opinion received from the tax advisers, of the tax rate applicable to the various
transactions, and the tax authorities may disagree with these estimates. It should be emphasized that the profit from supervised-rent apartments is the expected profit
under the assumption that subsidized rental housing and affordable rental housing will be sold as income producing properties upon completion of their construction,
and is not comparable to the profit with respect to the stages in which Condo apartments are being built for sale in the free market.
It should be noted that the images attached to this presentation, as well as certain data included in this presentation were not included in past reports of the Company
and are provided for the first time in this presentation or presented in a different manner than it was presented in the Company’s reports, or were updated in
accordance with the statements of the Company’s annual report for 2019 and in Q1 FY2020 . In addition, information included in the presentation may be considered
to be presented differently than the manner it is presented in the Company’s reports. The Company is of the opinion that the information included in the presentation,
is available for calculation from the data included in the said reports, or alternatively, has no material influence with respect to a reasonable investor which may
consider the purchase or sale of the Company’s securities.
The information and assessments presented in this presentation with respect to the future results of the Company’s development field are presented under the
assumption that this field of activity will continue in its current structure as detailed in the Company 2019 annual report and in Q1 FY2020 .

2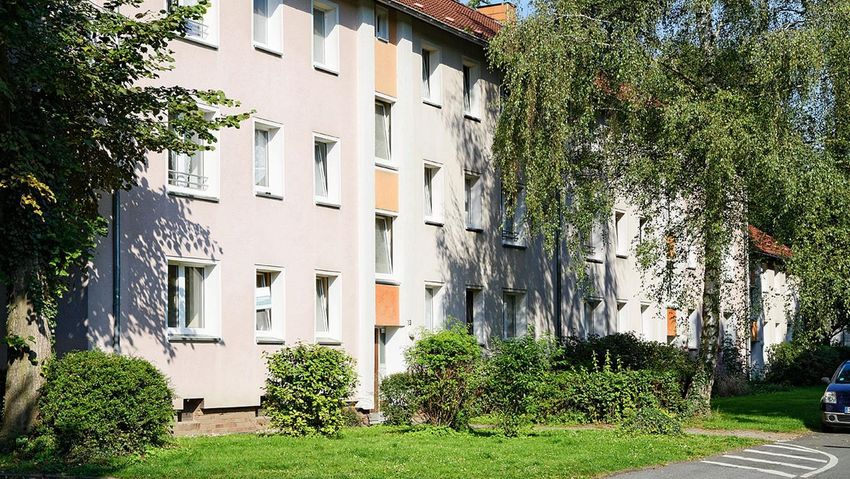
BCP at Glance                                                                                                                                            Dutch N.V

                                             Active in Germany since 2004
                                                                                                                                                              Ca. 0.9M sqm of income
                                      Multifamily portfolio                                                                                                   producing2 plus
                                   (76%of GAV1; 12,069 units)                                                                                                 development properties
                                                                                           Three                                                              )~ EUR 1.2B(
                                      Retail Parks portfolio
                                                                                       Operating
                                 ( 12%of GAV1; 133K sqm2)
                             3                                                         Segments
                               Residential Development
                                    ( 12%of GAV1; 2,700 units)
                                                                                                                                                             150 employees
                                                                                                                                2
                                                                          Capital Markets
                           Constituent of the TA 125 and TA-Real Estate index
                                              30% free float
                                   Credit rating: ilAA- by S&P Maalot

                                                                                                                                                             EPRA NAV: EUR 792.4M

                                                                                                                                                             Cash balance €39.6M

                    1.    Company share. 2. Excluding ca. 6.9K sqm. of a vacant property undergoing repositioning and excluding property of an affiliated company with rental area of ca. 7,254 sqm in Chemnitz.
3                   Excluding assets that the company signed an agreement for the sale and the delivery has not yet been carried out.
                    3. Including residential units of stage E and G in Grafental Project due to the implementation of IFRS 15, the Company recognizes revenue according to the construction progresses..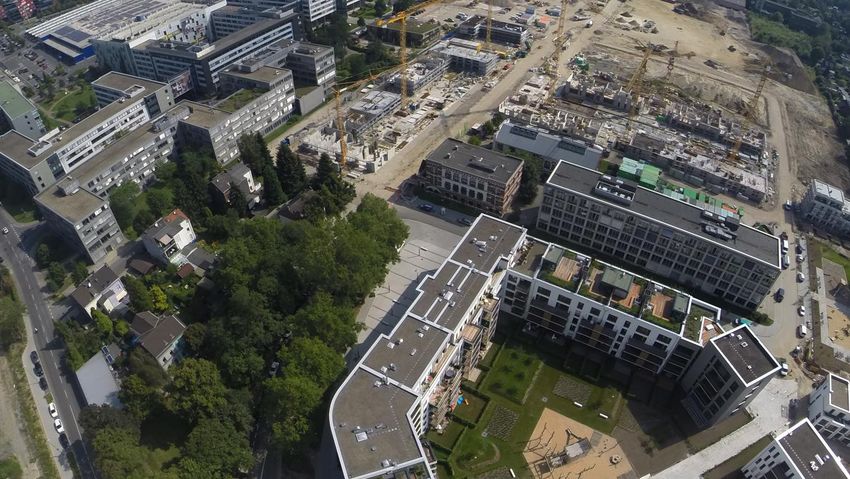
Track Record
                                                                                10% CAGR

                NAV per share (EUR)                                                             LTV* (%)
                                                                                                                                   Management and operations
    120.0
            14% CAGR                                                    90.0%                                                      are highly scalable
    100.0                                 88.3      90.7                80.0%
                                78.3
     80.0                                                               70.0%
                       67.7
     60.0    54.3                                                       60.0%    55.7%
                                                                                                     49.6%     48.9%
     40.0                                                               50.0%              47.1%
                                                                                                                         39.5%
     20.0                                                               40.0%

      -                                                                 30.0%

            Q1/2016   Q1/2017   Q1/2018   Q1/2019   Q1/2020                      Q1/2016   Q1/2017   Q1/2018   Q1/2019   Q1/2020

4                                                   * Net Debt to GAV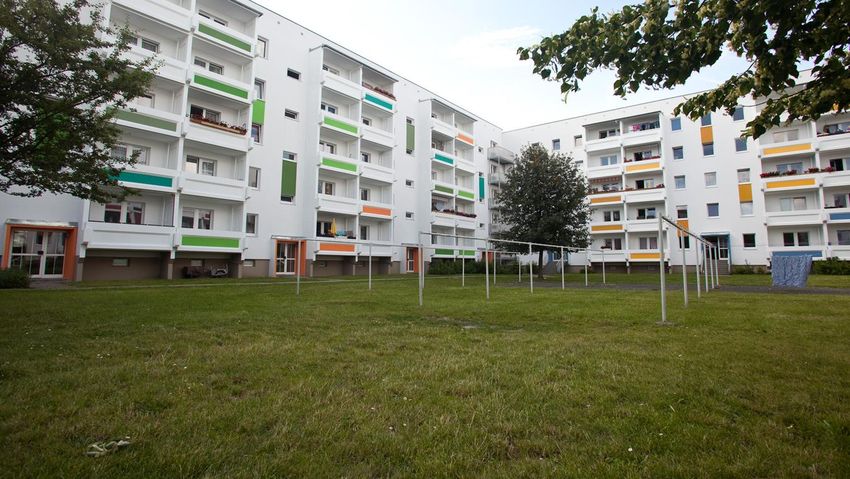
Operating Segments / Profitability & Growth
            1
                                                                                   12,069 residential units (76% of GAV)
         Multifamily                                                               located in large and growing
         Portfolio                                                                 cities

         (consolidate)                                                                High CF: ~5.1% rental yield

                    Significant Upside Potential                                                                                          High Cash Flow

        MEUR; company share                                                                                                                                 Spread of
                                                                                                                 6.0%
                                                                                                                                      5.1%                     3.5%
                              + €6.8M
          € 60.0                                                                                                 5.0%
                                                        € 58.4
          € 58.0
                                                                                                                 4.0%
          € 56.0
                                                                                                                 3.0%
          € 54.0
                          € 51.6
          € 52.0                                                                                                 2.0%                                                    1.6%
          € 50.0
                                                                                                                 1.0%
          € 48.0
                        Current rent            ERV* (based on new                                               0.0%
                                                     lettings)                                                                    Rental yield                       Interest rate

                          * Adjustment to rent level according to current occupancy in new residential rental units. Excl. income producing property of 113 units in Grafental, Dusseldorf.
5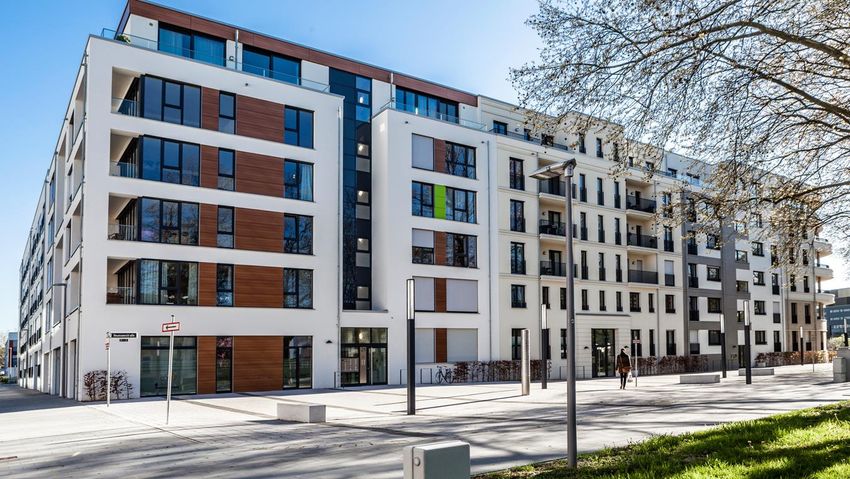
Operating Segments / Profitability & Growth
                     2
                                                                                            2,700 units under construction
                                                                                            or planning (12% of GAV)
                 Residential
                                                                                        Large and well positioned
                 Development                                                            projects
                 (consolidate)                                                              Significant contribution to NAV

                                          Growth
          Grafental - Development of Sale*** Prices per sqm
                                                                                                                                               High Embedded Value**

                      +51%                                                                                                                                                         Yet to be recognized
       € 6,500
                      From                                                                                                     € 140                € 128                          profit; EUR in millions,
                                                                              € 5,926
       € 6,000       Phase B1                                                                                                                                                             Company share
                                                                    € 5,630                                                    € 120
       € 5,500
                                                        € 5,033                                                                € 100
                                                 € 4,940
       € 5,000
                                       € 4,571                                                                                   € 80
       € 4,500               € 4,152                                                                                             € 60                                                 € 49
                 € 3,937
       € 4,000                                                                                                                   € 40
       € 3,500                                                                                                                   € 20

       € 3,000                                                                                                                    €0
                                                                                                                                                 Land bank                Expected profit (net of
       € 2,500
                  Phase B1     Phase B3   Phase C   Phase D   Phase E   Phase G   Phase H                                                                                         tax*)

                                * Assuming maximal tax rate of 31%. The expected profit excludes the expected future profits from Gereesheim (Dusseldorf) and Aachen. ** Gereesheim transaction is presenting according to equity method, for additional info
6                               please refer to the immediate report from 31 March, 2020 (reference number: 2020-01-033495)*** Total sale price for flats (only condo) and parking out of area flats for each phase. Sales price for each phase under construction
                                under Company estimates.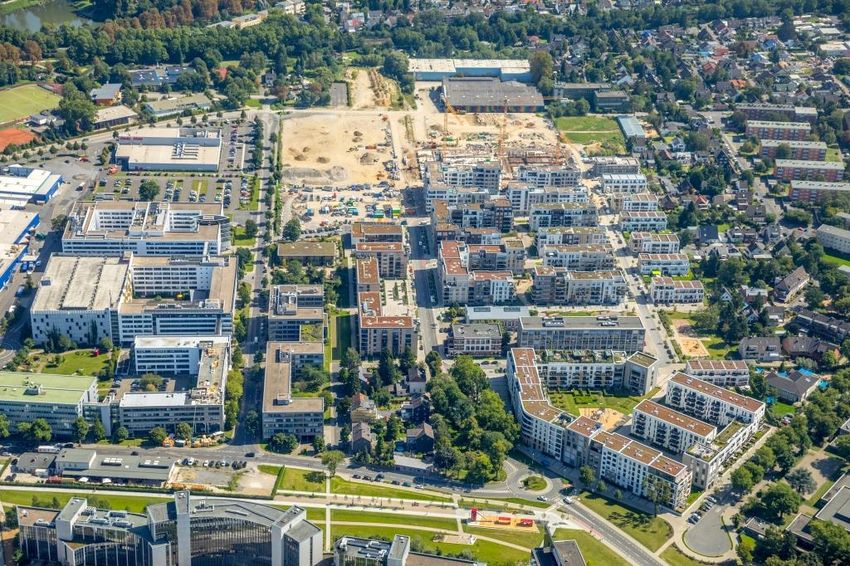
Main Developments in 2020

                   Sale Agreement                                                                Financing                                                             Residential development

     On January 1, 2020, the Company reported about
       the completion of the sale transaction of the                                      Average interest rate                                               On 31 March, 2020 the first part of Gereesheim
    commercial properties as of 31 December, 2020 in                                        on bank loans:                                                      sale transaction has completed with a total
    Emden Kassel, Laatzen, Leverkusen, Düsseldorf,                                                                                                             payment of ca. EUR 126 million while EUR 90
    Köln, Bad Segeberg and the subsidiaries received                                                                                                               million used for repaid the bank loan.
    the consideration of ca.€ 78.5 million, which ca. €                                  March 2020*: 1.66%
    52 million are designated to repaid the bank loan.                                    (4.6y* maturity)
                                                                                                                                                                 Grafental – phases under construction-
                                                                                                                                                                    Performance according to plan.
                                                                                                                                                           Approval of the master plan for part of the land of
                                                                                                                                                           residential uses in Grafental, and continued work
                                                                                                                                                             on rezoning on the rest of the land plot of the
                                                                                                                                                                                Company.

                                               * for additional info please refer to the immediate report from 31 March, 2020 (reference number: 2020-01-033495)
7                                              ** Excluding Gerresheim.
                                                *** for additional info please refer to the immediate report from 1 January, 2020 (reference number: :2020-01-000471
Multifamily Portfolio
100% in large cities*

      250 to 500 thousand
                                                                                         Multifamily Portfolio
      residents, 25%                                     More than 500 thousand

                                                         residents, 58%

     100 to 250 thousand                                                              Attractive Geographic Diversification*                                  Key parameters (consolidate)
     residents, 17%
                                                                                                        Kiel
                                                                                                  8% - 1,013 units                                                          General data
     *Based on book value
                                                                                                                                                        Total lettable area                  712k sqm
                            Well maintained portfolio,                                      Bremen
                                                                                         9% - 1,083 units
                             Diverse building types                                                                                                     Occupancy                                95%
                                                                                                                 Hannover
                                                                                                               10% - 1,167 units                        Rental income p.a.                  EUR 52.6m
                                                                                        Rest of NRW
                                                                                       (Duisburg, Essen…)
                                                                                                                                     Leipzig **         Average rent psm                     EUR 6.50
                                                                                       30% - 3,523 units
                                                                                                                                   35% - 4,176 units

                                                                                                                                                                           Current yield
                                                                                                Dortmund
                                                                                               8% - 994 units
                                                                                                                                                        Rental yield                            5.1%
    Buildings for conservation           Low – rise
    1,536 units                          7,477 units
                                                                                                                                                        NOI yield                               4.5%

                                                                                                                                                                          Potential yield

                                                                                                                                                        ERV yield*                              5.8%
                                                                                                                                                        Adjusted NOI
                                                                                                                                                                                                5.1%
                                                                                                                                                        yield**
                                                                                                                                                        * ERV - rental income based on avg. new lettings
                                                                                  * By no. of units.                                                   ** Adjusted NOI – under the assumption that all
                                                                                  ** Including 576 units in Magdeburg & Halle                             properties are let at ERV. Excl. income producing
    Town Houses                          High – rise                                                                                                      property of 113 units in Grafental, Dusseldorf.
    1,185 units                          1,758 units

9
Consistently Outperforming the Market

                                                                                                                     05.2020                    BCP

                                                                                                            Rental growth                        2.6%

     Multifamily Portfolio -                                                              High proportion of 1 and 2
     Quality Play                                                                            rooms apartments1
                                                                                         the fastest growing market segment in
                                                                                                                                            100% of the portfolio
                                                                                                                                               in large cities
                                                                                                     the major cities

                                                                                         Focusing on cities with high
                                                                                                                                                 Rent control
                                                                                           population growth rates
                                                                                                                                                BCP: 3% of units
                                                                                          benefiting from robust rental growth.
                                                                                                                                        German peers: 11%-29% of units

10                  1.   Average flat size in BCP portfolio is 58 sqm compared to 61-64 sqm among the competitors.
Multifamily
Portfolio -
Magdeburg & Hannover &
Leipzig Bremen Kiel Dortmund NRW Total
Halle Gottingen
No. of units 576 3,600 1,167 1,083 1,013 994 3,636 12,069
Occupancy 89% 95% 97% 95% 99% 95% 93% 95%
Value per sqm € 1,394 € 1,635 € 2,004 € 1,292 € 1,626 € 1,346 € 1,175 € 1,438
Rent per sqm € 5.85 € 6.38 € 8.29 € 6.30 € 7.17 € 6.73 € 6.04 € 6.50
ERV per sqm in
€ 6.53 € 7.51 € 10.33 € 6.99 € 9.28 € 8.06 € 6.51 € 7.45
new- lettings **
Upside in rent
12% 18% 24% 11% 29% 20% 8% 15%
based on ERV*
€ Value per sqm - EUR 1,420 Upside in rent based on ERV* - 15%
11 * Upside without occupancy changes, based on new-lettings
** Excl. income producing property of 113 units in Grafental, Dusseldorf.Multifamily Portfolio
Leipzig, Magdeburg & Halle Hannover Bremen
4,176 1,167 1,083
units units units
Kiel Dortmund NRW
1,013 994 3,523
units units units
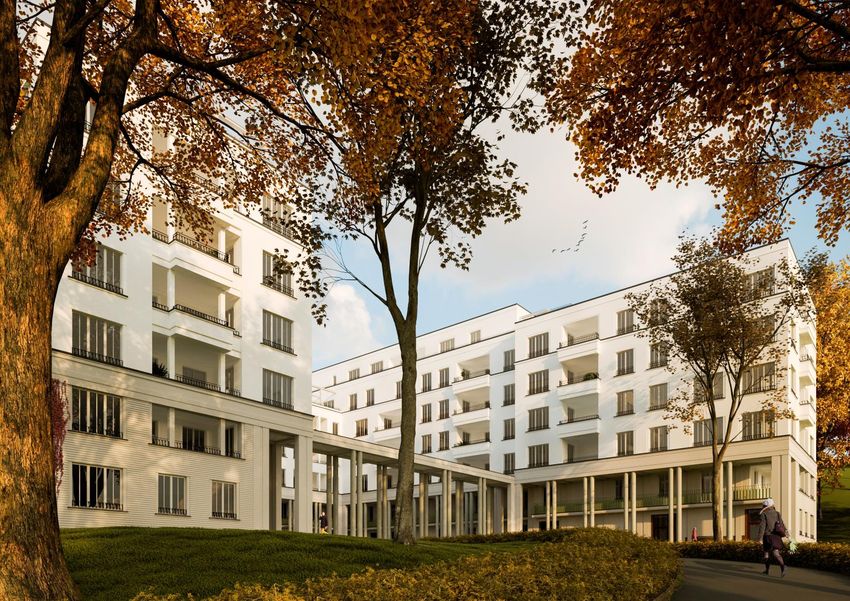
12Residential Development
Residential Development in Düsseldorf
     An International economic center,
              6th in Quality of Life Worldwide1

                       Attractive Locations
              Central locations within the city, in upper class
                            neighborhoods                                                City of Dusseldorf’s target for
                                                                                     residential completion during 2017-
                                                                                         2020 is 3,000 units per units 2

                                                      3

                                                1    2

                                                               4
                                                                                     The demand for residential units
                                                                                     during 2020-2025 is expected to
                                                                                                decline 2

     1 Grafental I   2 Grafental II   3 Grafenberg       4   Gerresheim

14                                                              1. The Mercer Quality of Living Survey 2019.
                                                                22. Destatis, JLL., January 2020.
Grafental II2 Grafental I- successful development
Residential track-record
Development and
improvement
activities-
Profitability & Proven
Track Record
Land for office under advanced rezoning to residential
Adjacent to Grafental I project 823 units were sold in full to date
900units - expected project size3 Sales of 400 m EUR to date
500 units - ready for construction from July 2018 57% increase in sale prices since project inception
332 units forecast to be ready for construction during 2020
Aachen2 Land in Grafenberg 1,2
Old Factory
to be
demolished
Land under rezoning to residential (BCP share 50%) Future Luxury project - 84 units
Land parcel in advanced stages of rezoning to residential use- Adjacent to Grafenberg forest
ca. 1,500 residential units and ca. 30,000 sqm commercial area
280 planned units :
Mix of town houses and garden/roof apartments Approval of development scheme expected during 2020
bordering from the south the up market neighborhood “Grafenberg”. Building permit expected during3 2020
Approval of development scheme expected- during 20203 Zoning Plan was published at End 2018
Building permit expected during 2020
1. Currently a yielding property, under rezoning to residential process. 2 In rezoning stages. It should be noted that the company has not yet decided to develop these projects.
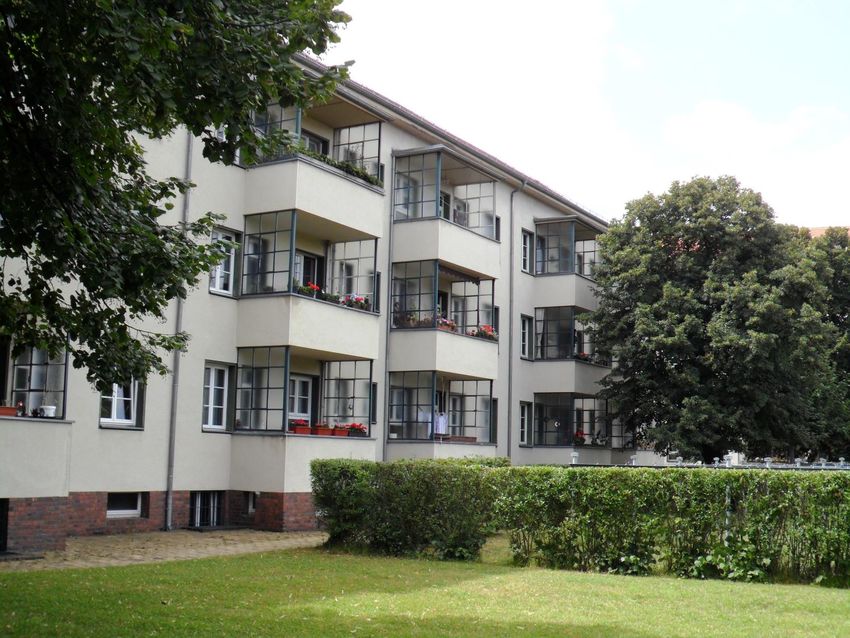
15 3. As per the Company’s estimate, subject to the approval of urban scheme by Dusseldorf/Aachen municipalityGrafental II Aachen
Residential
Development–
Grafental,
Gerresheim
& Aachen
Gerresheim Grafental I
16
16Residential Development in Düsseldorf -
Highly Experienced Platform
For Continued Growth
Sale Prices* per sqm (EUR)
+38% 5,926
6,000 5,630
From start
of the project 5,033
4,940
5,000 4,571
4,152
3,937
4,000
3,000
2,000
1,000
Phase B1 Phase B3 Phase C Phase D Phase E Phase G Phase H
* Average sale price for each phase for condo flats.
17Growth Drivers
NAV – Growth Drivers                                                                  EPRA NAV (31.3.2020)           € 800M                                               * Impact of the Gereesheim transaction considering 100% of the land value according to
                                                                                                                                                                           the price that is reflected in the company's Sale agreement less a corporate tax of
                                                                                       EPRA NAV Adjusted* (31.3.2020) € 997M                                               15.825% (without local trade tax which in accordance to the tax advice the company
                                                                                                                                                                           received, will not apply on the transaction).
                                                                                       Market Cap (7.05.2020)         € 588M

     Multifamily
                                                                Current status            ERV                                                                                      Sensitivity Analysis
                                    Rental income (MEUR)1             € 51.6             € 58.4                                  Rental income
                                                                                                                                                                € 51.6 (current rental income)                   € 58.4 2(Market Rent Q1/2020)
                                                                                                                                 (MEUR)1
                                    Rental yield                      5.10%              3 4.83%
                                                                                                                                 Rental yield                   5.50%         5.00%          4.75%                5.50%            5.00%           4.75%
            Portfolio book value – EUR 992.5m1                                                                                   Implied Value    (MEUR)1       € 938        € 1,032        € 1,086              € 1,063           € 1,169         € 1,231

          1. Company share.
          2. Based on new lettings performed in Q1/2020 without assuming ERV growth.
          3. Rental yield in the market - average of the multifamily sector in Germany according to Morgan Stanley,
          Credit Suisse and companies’ publications.

 Residential Development                                                                                              Sensitivity Analyses – discounted profit1,2,3 after tax
                                                                                                                                    (company share, MEUR)

 Significant                                                                                                                               Annual growth rate in sales price                                          Project in early planning stage
                              Successful track record in Düsseldorf ) sales of € 507m to date)          Discount rate              4%               7%                   10%
 contribution                                                                                                                                                                                                  Project name           Gereesheim        Aachen
                                                                                                        8%                        € 56.0           € 69.8               € 84.7
  to the economic             100% sold units in completed phases                                       9%                        € 54.2           € 67.3               € 81.5
                                                                                                                                                                                              Excl. profit     Company share                 25%             50%
 NAV                                                                                                                                                                                            from:
                                                                                                        10%                       € 52.4           € 64.9               € 78.5                                 Land plot size         193,000 sqm 53,000 sqm
                              Very high marketing rate in phases under construction)
                                                                                                        11%                       € 50.8           € 62.7               € 75.6
                                                                                                                                                                                                               # of planed units           1,500             280
                              Continuous price increase (ca. 8% on avg. in every new phase)                1. Excl. units already sold, the profit of which is not yet recognized in the FS.
                                                                                                           2. Incl. projects that the company has not yet decided to develop. Excl. income and profit
                                                                                                              expected from Aachen and Gereesheim, Dusseldorf projects.
                                                                                                           3. The projects’ time span assumed in the calculation: Grafental – 7 years, Grafenberg – 6 years.

19
Appendixes
Key Financial Data – Balance Sheet
                                                                                                                                Financial Position

                                                                                                             Financial Debt Structure – 31.3.2020
                                                                                                                        Bank Loans     Bonds      Total
                                                                                                 Outstanding
                                                                                                                               € 487.3           € 99.4        € 586.7
                                                                                                 balance in MEUR4
                             Balance Sheet Summary (MEUR) – as of 31.3.2020
                                                                                                 Average maturity4            4.6 years        3.1 years      4.3 years
                                                                                                 Average interest4              1.66%            3.52%          2.00%
     Income producing properties                                             € 1,143
                                                                                                 Market interest1               1.72%            2.56%          1.90%
     Investment Property- real estate rights                                 € 62.3
                                                                                                           Rating and Leverage Ratios – 31.3.2020
     Land Inventory for development (long-term
     and short-term)                                                          €75.3              Credit rating                                      S&P Maalot ilAA-

     Cash and liquid balances                                                €39.6               LTV2                                                      39.3%

     Total assets                                                            € 1,466             Debt to Capt, net                                         39.1%
                                                                                                 EBITDA to interest
     Total debt                                                              € 586.7                                                                       3.58X
                                                                                                 (excl. contribution from Grafental)3
     Equity attributable to company’s shareholders                           € 701.4              1. Market interest – recent refinancing interest of senior loans with
                                                                                                     10 years duration fix / weighted average bonds YTM at which the
     Total Equity incl. non controlling interests                            € 737.8                 bonds are traded.
                                                                                                  2. Net debt to real estate portfolio.
                                                                                                  3. Based on the reported quarter.
     EPRA NAV                                                                € 792.4              4. Excluding Griesheim.

             Development of Equity Attributable to Company’s shareholders (MEUR)                                       EPRA NAV (MEUR) - 31.3.2020

                                                    20%                                           Equity attributable to company’s
                                                    CAGR                                701.4                                                                701.4
     800.0                                                          694.6      712.0              shareholders
                                                           591.2                                  Adding deferred taxes (less minority                       83.1
     600.0                                                                                        interest)
                                            419.2
                               345.5                                                              Excluding the fair value of financial
     400.0          279.6                                                                                                                                     0.1
                                                                                                  derivatives, net (less minority interest)
     200.0                                                                                        Adding yet to be recognized profit from
                                                                                                                                                                          Due to units
                                                                                                  sold units (the company share, net of                       7.8
                                                                                                                                                                          already sold but
       0.0                                                                                        taxes)                                                                  not yet recognized
                    Dec-14     Dec-15       Dec-16         Dec-17   Dec-18     Dec-19   May-20   EPRA NAV                                                   792.4         in the P&L
                                                                                                                                                                          Phases E-G

21
Grafental
Key Financial Data – Profit and Loss Ca. 13.4M EUR profit1 from already sold apartments is not
yet recognized in the P&L
Grafental I - sales and profitability data 1
Profit and Loss (MEUR)
Phase Phase Phase Phase
E F3 G H
Q1/ 2020 Q 1/2019 No. of residential units 89 112 89 96
Rental Income € 15,897 € 20,017 No. of underground
86 57 106 101
parking spaces
Profits realization
Profit (loss) from condo sale € 2,882 € 1,612 due to delivery of Built area 18k m2 12k m2 9.5k m2 9.8k m
apartments.
NOI € 12,921 € 17,036 Sold units (#) 89 ר.ל 89 95
Sold units (%) 100% ר.ל 100% 98.9%
NOI yield 4.5% 4.7%
Total sales to the signing date
€ 49.6m ר.ל € 53.7m € 57.4m
of the report
Adjusted NOI yield* 5.2% 5.7%
Average sales2 price per sqm € 5,033 ר.ל € 5,630 € 5,926
Excl. contribution
EBITDA € 9,677 € 15,008 from Grafental Commencement of
5/2018 ר.ל 11/2018 7/2019
project. pre- marketing
Real estate revaluation ( € 10,935 ) ( € 394 ) Commencement
4/2018 4/2018 Q4/2018 Q2/2019
% of real estate revaluation in of construction
relation to the total investment ( 0.96% ) ( 0.03% ) Apartments hand -over date H1/2020 H1/2020 H1/2020 H2/2021
property
Cash flow interest € 2,966 € 3,641 Expected development profit € 12m € 3.5m € 11.2m 10m
FFO Excl. contribution Development profitability 32% 13.7% 26.5% 21%
€ 6,631 € 9,197
from Grafental
project. Development profit already
EBITDA to interest (excluding
3.58x 4.12x Recognized in the FS € 11m - € 9m -
contribution from Grafental)
(cumulative)
*Adjusted NOI - NOI under the assumption that the properties are leased at market prices. Excl.
income producing property of 113 units in Grafental, Dusseldorf. Free Cash Flow € 20m € 4m € 20m €21.5m
1. Data according to 100%, the Company share in the project is 84.98%. 2. Average sale price (including parking) for each phase for condo flats.
22 3. It should be noted that the expected profit of Phase F is under assumption that the asset (subsidized rental apartments and affordable housing under supervised rent) will be sold as a rental property upon completion of construction. Therefore, it is not
comparable to development profitability in stages in which Condo apartments are being built for sale in the free market.Q1/2020
Results Q1/2020 Q1/2019 Change
Rental income (TEUR) 15,897 20,017 -21%*
(10,6062
Net income attributable to BCP’s
( (8,352( 27%
shareholders (TEUR)
Total Equity attributable to BCP’s 701,428 686,292 2%
shareholders (TEUR)
EPRA NAV (TEUR) 792,400 799,100 -1%
23 * Changes of FFO and rental income are mainly due to sale of properties.Q1/2020 Results - Per Sector
Multifamily Residential Development
Q1/2020 Q1/2019 Q1/2020 Q1/2019
Occupancy rate 95% 94% Sale of apartments (#) 40 16
€ 6.50 € 6.31 Avg. sale price (incl. parking) psm € 5,969 € 5,492
Avg. rent psm
Avg. rent psm in new leases 2 € 7.45 € 7.52
Rent growth 1 2.6% 2.4%
Upside to market rent 15% 19%
Acceleration in Grafental project sale price growth rate
1
24 Compared to the corresponding period last year, excl. new acquisitions. Re the retail parks about the majority of the growth derives from the development of building rights in properties..
2 Excl. income producing property of 113 units in Grafental, Dusseldorf.Thank You
You can also read