Summit on the Water and Sanitation Master Plan and Water User Licence Regime - 10 February 2021 Microsoft Teams Platform - Agbiz
←
→
Page content transcription
If your browser does not render page correctly, please read the page content below
Summit on the Water and
     PRESENTATION TITLE
Sanitation Master Plan and Water User Licence
     Presented by:
     Name Surname
     Directorate        Regime
     Date

                     10 February 2021

               Microsoft Teams Platform

                              1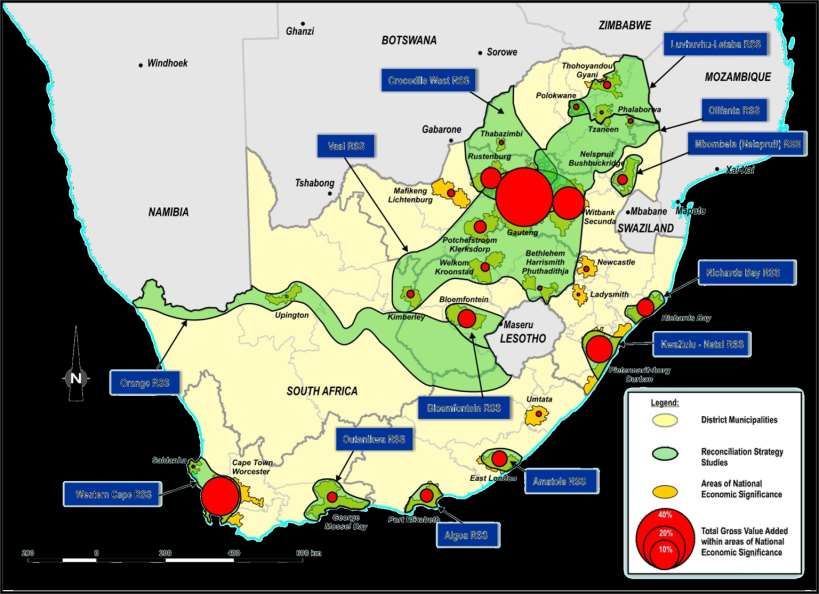
PURPOSE

• To present aspects of the National Water and
  Sanitation Master Plan (NW&SMP) related to the
  agricultural sector
• To share DWS’ developments in the water use
  authorisation regime required to support the
  agricultural sector

                         2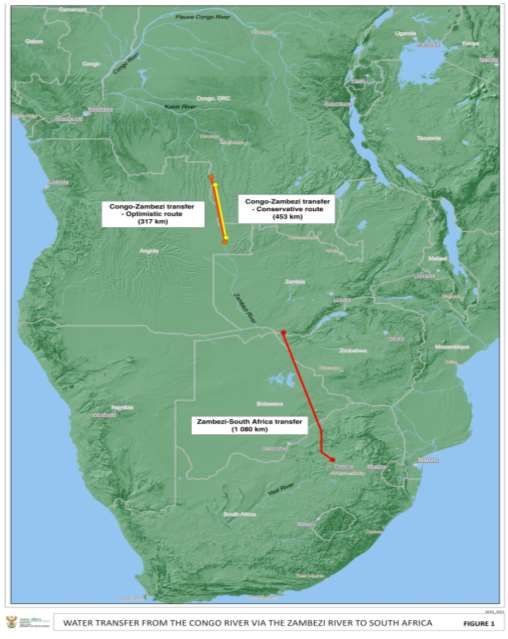
SETTING THE SCENE

•   Current population: 58.8 million people (STASSA 2019 mid-year population estimates)
•   19 million people no access to reliable drinking water.
•   14.1 million people no access to safe sanitation
•   Only 64% of households have a reliable water supply service
•   56% of waste water treatment works
•   44% of water treatment works are in a poor or critical condition
•   41% of municipal water does not generate revenue. 35% is lost through leakage (R9.9 billion
    lost annually)
•   33% of the remaining wetlands are critically endangered (more than 50% already lost)
•   61% of the water is for agriculture and only 5% of agricultural water is used by black farmers
•   More than 70% of commercial farms in SA are owned by white farmers; they use 95% of
    water allocated to the agricultural sector
•   South Africa is facing a projected 17% water deficit by 2030 if it doesn’t successfully
    implement the planned measures

                                                    3
Securing Water for South Africa – introducing a
          National Water & Sanitation Master Plan
•   In order to secure water availability into the future, the Department of
    Water and Sanitation (DWS) has developed a National Water and
    Sanitation Master Plan (NW&SMP)
•   The NW&SMP:
     – Is a “Call to Action” which seeks to rally all stakeholders in South
        Africa to work together to address the challenges confronting the
        Water and Sanitation Sector
     – Will enable the achievement of the targets set out in the National
        Development Plan (NDP) Vision for 2030 and the Sustainable
        Development Goals (SDG Goal 6 2030), of affordable and reliable
        access to sufficient and safe water and hygienic sanitation for
        socio-economic growth and well-being, with due regard to the
        environment
     – Calls for the development of an implementation plan to address
        key priority areas and create economic and transformative
        opportunities towards water security and dignified sanitation
        for South Africa.

                                       4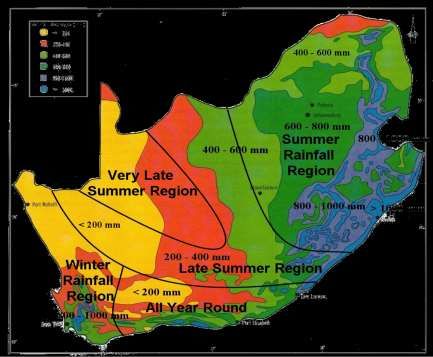
Key elements of the NW&SMP
                  1.1 Reducing
                  Demand and
                   Increasing                                             2.1 Creating
                     Supply                                                 Effective
1.6 Protecting                                                            Institutions
                                         1.2
and Restoring                                            2.6 Enhancing
                                    Redistribution                                        2.2 Managing
  Ecological                                               Research,
                                         for                                                 Data and
Infrastructure                                           Development
                                   Transformation                                          Information
                 1. Water and                                 and
                                                          Innovation
                  Sanitation
                                                                          2. Enabling
                 Management
                                   1.3 Managing                          Environment
1.5 Improving                         Effective
 Raw Water                             Water                                               2.3 Building
                                                         2.5 Amending                      Capacity for
   Quality                         Services and            Legislation
                                     Sanitation                                               Action
                  1.4 Regulating
                    Water and                                             2.4 Ensuring
                    Sanitation                                              Financial
                                                                         Sustainability

                                                     5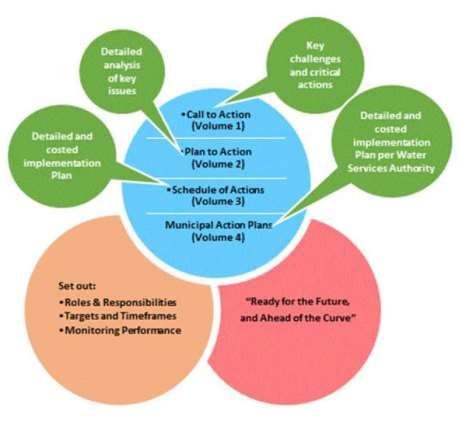
STRUCTURE OF NW&SMP
            Volume 1: Call to Action briefly outlines the
            milestone challenges and the
            recommended actions
            Volume 2: Plan to Action provides detailed
            account and analysis of the rationale for
            challenges and actions, and addresses
            future inter-governmental collaboration,
            M&E protocols and continuous stakeholder
            engagement during implementation.
            Volume 3: Schedule of Actions provides a
            detailed consolidated and prioritised
            implementation plan with costs covering all
            the actions required across the sector to
            achieve the objectives of the plan.
            Volume 4 : An implementation guideline to
            assist Water Services Authorities (WSAs) in
            their development of their Municipal
            Action Plans.

        6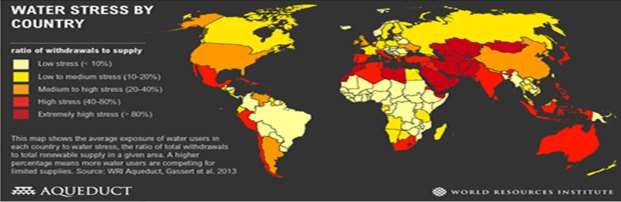
STATUS AND MILESTONES

            Continuous Implementation of programs
    2017
1. NWSMP pre
Development
 stakeholder
consultations                                 2019
2. Master Plan                            5. Adoption of
development                                  NWSMP

                         2018                              6 Implementation of
                      3. NWSMP                               Priority Activities
                     Development
                 4. Consultation of the
                       Draft with
                      stakeholders

                                          7
Brief Focus on the Water Resources
Component of the National Water and
        Sanitation Master Plan

                 8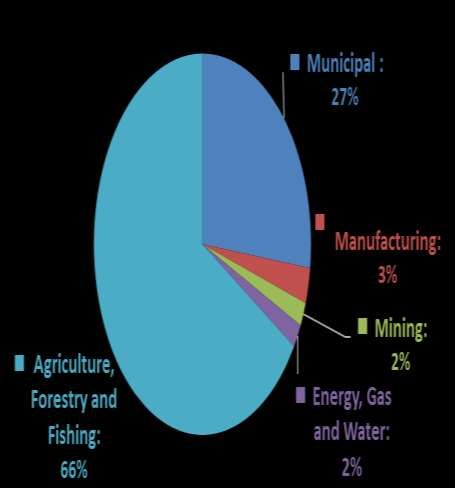
Overview of South Africa’s Water Resources
•   Water is a scarce and strategic
    resource
•   Water resources presents spatial and
    temporal challenges requiring large
    inter-basin transfer schemes
•   Limited opportunity for large scale local
    fresh water resource development
•   Increasing competition across water
    use sectors / users
•   Mean annual rainfall
     – South Africa = 500mm (World
       average = 860mm)
     – 65% of SA <    500mm
     – 21% of SA <    200mm
•   Severe and prolonged droughts – 10
    years in some systems
     – 25% - drained by perennial rivers
       (seasonal)
     – 75% - drained by seasonal to episodic
       rivers (event related).

                                                9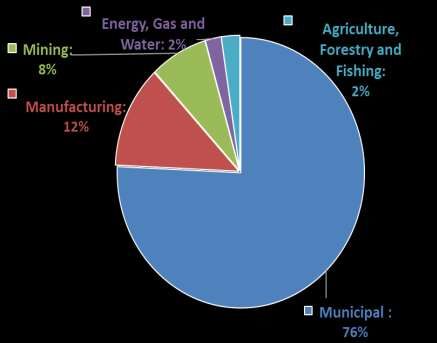
Water use per sector projections
User sector*                  Water requirements (million m³/annum)
                               2015    2020    2025     2030    2040
Municipal (industries,        4 447    4 900  5 400     5 800   6 600
commerce, urban and
rural domestic)
Agriculture (irrigation and    9 000    9 500      9 600    9 700    9 800
livestock watering)
Strategic/Power                 362         390     410      430      450
generation
Mining and bulk industrial       876      921        968    1 017    1 124
International obligations        178      178        178      178      178
Afforestation                    431      432        433      434      434
Total                         15 294   16 321     16 989   17 559   18 586

                                       10
Water use per sector 2020 & 2040
projections
2020 Water Use per Sector 2040 Water Use per Sector Projections
International
International obligations
obligations 1%
1% Afforestation
Afforestation Mining and 2%
Mining and 3%
Strategic/ bulk industrial Strategic/ bulk industrial
Power Power 6%
6%
generation generation
2% 2%
Municipal Municipal
(industries, (industries,
commerce, commerce,
urban and urban and
rural rural
domestic) domestic)
30% 36%
Agriculture
Agriculture
(irrigation and
(irrigation and
livestock
livestock
watering)
watering)
53%
58%
11Current and potential areas under irrigation
The National Development Plan indicates that irrigation can be expanded by 500 000 hectares but
the Second Edition of the National Water Resource Strategy (NWRS 2) states that water is available
only for expansion of about 80 000 hectares due to limitations in water resource availability.
DAFF calculations are as follows:
Provinces Areas under irrigation schemes Potential development and
(revitalization) expansion of irrigation areas
Eastern Cape 8 362 7 604
Free State 150 3 000
Gauteng - -
Kwazulu Natal 4 235 10 000
Limpopo 22 909 -
Mpumalanga 11 139 3 000
Northern Cape 44 658 (includes Vaalharts) 5 000
North West 20 042 (includes Hartebeespoort) 1 259
Western Cape 257 10 000
Total 111 752 39 863
Key message
• Need to focus on revitalisation of existing schemes which already have water before focusing
on expansion
12GDP contribution per sector versus water use
per sector
GDP Contribution (Stats SA PO441)
Water Use (DWS National Water & Sanitation Master Plan)
Note that the level of assurance at which agricultural water is supplied is lower than that of other sectors.
13Water Use Authorisation Applications
(WUAs) Annual Performance 2015/16 to
2018/19
2015-16 2016-17 2017-18 2018-19 2019/20
91% water use 68% water use 95% water use 82% water use 88 % water use
authorisation authorisation authorisation authorisation authorisation
applications applications applications applications applications
finalised as per the finalised as per the finalised as per the finalised as per finalised as per
water use water use water use the the
authorisation authorisation authorisation Water use water use
guidelines guidelines regulations authorisation authorisation
regulations
(275 out of 404) (447 out of 469)
(262 out of 288) (496 out of 601) ( 645 out of 678)Water use licences granted by the Department
from 2010/11 up to December 2020
Number of Number of
Number of authorizations authorizations HAI and authorizations
HDI and Black Owned White owned Government
Regions Companies Companies Entities Total
Eastern Cape 217 362 192 771
Free State 42 354 42 438
Gauteng 14 219 199 432
1270 509 133 1912
Kwa-Zulu Natal
Limpopo 651 226 56 933
Mpumalanga 95 808 153 1056
North West 31 399 173 603
Northern Cape 57 814 50 921
Western Cape 24 631 191 846
Grand Total 2 401 4 322 1 189 7 912
Percentage 30% 55% 15% 100%
HDI’s (individuals and Government Entities) authorized 45%
HAI’s 55% authorizedWater use licences per sector granted by the
Department from 2010/11 up to December 2020
Property Local Grand
Row Labels Agriculture Development Forestry Industry Government Mining Total
Eastern Cape 252 19 281 43 175 1 771
Free State 337 7 0 11 40 43 438
Gauteng 42 65 1 94 164 66 432
Kwa-Zulu Natal 168 47 1493 57 110 37 1912
Limpopo 750 29 25 40 47 42 933
Mpumalanga 241 48 31 140 98 498 1056
North West 86 150 0 75 184 108 603
Northern Cape 678 12 0 43 42 146 921
Western Cape 443 110 9 80 194 10 846
Grand Total 2997 487 1840 583 1054 951 7912
HDI’s (individuals and Government
Entities) authorized 45%
HAI’s 55% authorizedKey large water resource systems in SA
17Water availability vs requirements in key large
water resource systems
System Province Total Current In Mm3 /Year, base year 2019 Future in Mm3 /Year, projected for 2040
Storage Availability Demands Deficit (-) / Availability Demands Deficit (-) /
capacity in (integrated (estimated Surplus (+) (integrated (estimated Surplus (+)
Mm3 system yield)/ requirements) system yield)/ requirements)
scheme yield scheme yield
Western Cape WC 590 590 0 1 160 1 125 35
895
Mosselbay WC 49 62 68 -6 62 90 -28
(Outeniqua)
Algoa EC 195 182 13 225 258 -33
281
Amathole EC 104 115 -11 124 125 -1
241
Crocodile West LP, NW 495 1 200 1 170 30 1 460 1 365 95
Polokwane WSS LP 254 268 261 7 433 408 25
Letaba & Levubu LP 243 215 28 276 277 -1
472
Olifants LP 1 859 425 458 -33 442 566 -124
Crocodile East MP 340 67 62 5 76 76 0
Integrated Vaal MP, NW, GP, 10 566 3 154 3 120 34 3 640 3 600 40
River System FS
Orange NC, FS, EC 7 2 950 3 097 -147 2 766 3 150 -384
996
Mgeni and KZN 978 499 561 -62 736 705 31
Coasts
Richards Bay KZN 413 239 225 14 290 292 -2
Bloemfontein FS 84 105 104 1 162 191 -29
TOTAL 25 912 10 137 10 233 -96 11 888 12 235 -347
18Overall projected growth in yield and demand
2019 Demand (10 233 Mm3) Exceeding Supply
Deficit:
-96 Mm3/a
-1% 2040 Projected Demand (12 235 Mm3)
Exceeding Projected Supply
Deficit:
-347 Mm3/a
-3%
Yield:
10 137
Mm3/a 99%
Yield:
11 888
Mm3/a
97%
Although the charts shows a national deficit,
there are localized areas with surpluses that
can spur on much needed economic revival
whilst new investments are being made to
develop additional water resources.
19Diversification of the water resource mix to ensure
water resilience
Current water resource mix Progression towards the desired
future water resource mix
Water use per source type at 98%
100%
assurance level 14%
90% 16%
18%
80% 9%
10%
70% 12%
Return
flows; 14% 60%
Desalinat
ion,Water Resource Development Projects Funnel
LEGEND
Surface water Design/ Construction/
Reconnaissance Pre-feasibility Feasibility Decision
Documentatio Implementati
Phase Phase Phase Support Phase
n Phase on Phase
Groundwater 200+
Integrated 650 511
Vaal River Desalination 465 356 151
Zambezi 100
System Mzimvubu-Vaal Orange-Vaal Thugela Thugela-Vaal 393
transfer
transfer Transfer -Vaal (Mielietuin) Use of acid LHWP
Re-use of water (Jana) mine drainage Phase II
Orange 216
556
River VBKD Boskraai Dam
System Raising of Mzimvubu- VD Kloof Dam
Gariep Dam Kraai transfer Vioolsdrift
Acid mine drainage Low level Storage
Dam
100 90
Crocodile 126
Zambezi 75
West River Vaal-Crocodile 14
transfer Re-use of effluent
Transfer Mokolo Crocodile Augment.
Importation of water System from Vaal Mokolo Crocodile Augment.
Project Ph2 (Crocodile) Project Ph1 (Mokolo)
200 33
Olifants 190 55
Use of acid 5 80
Zambezi
River transfer Vaal–Olifants mine drainage Olifants Dam
Desalination of Malmani ORWRDP: De Hoop
System Transfer Dolomite ORWRDP Bulk Dam
Aquifer Conveyance
seawater 46 60
220 37 10
218 40
Mgeni Water uMkhomazi-Mgeni Raising of
Mooi-Mgeni
uMkhomazi-Mgeni Isithundu 100+ Lower
Supply Re-use transfer Transfer
transfer Ph2 (Impendle Dam Desalination Thugela Hazelmere
Phase II (Spring
123 System Dam) Ph1 (Smithfield) Scheme Dam
Grove)
Capacity (Mm3/a)
16 8
50+ 50+ 20
32
Re-use to Groundwater
Algoa Water Mzimvubu- Guernakop Dam/ Desalination Nooitgedacht
industrial schemes
Supply Vaal transfer Low Level
Phase completed Raising of Kouga standards
Storage
System Dam
Lower Coerney
Dam
23
9 14 46 83 Voëlvlei
110 27 20 160
Phase in progress Augment.
Western Cape Cape West Mitchell’s Re-use
TMG Desalination
Voëlvlei Upper Phase 1
Water Supply Flats Coast Pass Aquifer
Augment. Molenaars
Aquifer Aquifer diversion
System Phase 2&3 diversion
Decision to 241 14
progress to next 40 15 60 Ludke Dam
Ntabalenga Nwamitwa
phase
Thukela-Mhlatuze Re-use Crocodil 16 Dam Dam 70
23 7
Transfer (Mhlatuze) e East
Dam Koonap Clanwilliam
Nwamitwa Lusikisiki: Ncwabeni Raising of
Other areas River : Dam
Aquifer Zalu DamOff-channel Tzaneen
Foxwood Raising
(incl. Amatole, Dam Storage Dam
Clanwilliam
Mhlatuze & Mbokazi Dam Conveyance Lalini Dam
Dam
Outeniqua) Infrastructure
21Water Resource Development Programme
Water Resource Current Prioritized Water Resource Development Option and Estimated Date of Water Delivery
(WR) System
2020 - 2030 2031 - 2040 2041 – 2050
Integrated Vaal River Phase 2 of Lesotho Highlands Water Project by 2025 (R32.6 Use of Acid Mine Drainage Thukela Water Project (Jana
System Billion) & Millietuin Dam s)
Orange River Gariep Pipeline by 2024 (R8 Billion), Dam at Verbeeldingskraal in
System Vioolsdrift Dam in the Lower Orange (R6 Billion) the Upper Orange River
Crocodile West River Mokolo Crocoldile (West) Water Augmentation Project (MCWAP) Re-Use of Effluent Re-Use of Effluent
System by 2024 (R15 Billion)
Olifants River Olifants Water Resource Development Project (ORWRDP) Re-Use of Effluent Olifants Dam
System Phases 2B (R6.6 Billion) , 2D (R1.8 Billion) , 2E (R0.5 Billion) & 2F (Possibly Rooipoort Dam)
(R2.3 Billion)
Exploitation of the Malmani Dolomitic Groundwater Aquifer
Mgeni Water Supply Phase 1 of uMkhomazi Water Project by 2026 Re-Use of Effluent Phase 2 of uMkhomazi Dam
System (Dam at Smithfield , transfer tunnel and Associated Works) (R18.5 (Dam at Impendle and
Billion) Associated Works)
Algoa Water Supply Lower Coerny Balancing Dam Re-Use of Effluent Kouga Dam Augmentation
System Ground Water Development Scheme Scheme
Western Cape Water Berg River – Voelvlei Augmentation Scheme (BRVAS) by 2021 Breede-Berg River Raising of Lower Steenbras
Supply System (R0.9 Billion) Augmentation Scheme Dam
Table Mountain Group Aquifer Scheme (Mitchell’s Pass Diversion Desalination of Sea Water
& Raising of Voelvlei Dam)
Eastern Cape Water Mzimvubu Water Project (R17.9 Billion), Koonap River Groundwater Development Phase 2 of Mzimvubu Water
Schemes Development Project (Foxwood Dam) (R3 Billion), Lusikisiki Project
Water Project ( Zalu Dam) (R2 Billion)
Letaba Water Supply Groot Letaba Water Augmentation Project (GLeWAP) (Nwamitwa Groundwater Development Water Re-Use
System Dam (R1.7 Billion) & Raising of Tzaneen )
Olifants-Doorn Water Clanwilliam Dam Raising (R 3.3 Billion) Phase of Conveyance Groundwater Development
Scheme Phase of Conveyance System from the Raised Clanwilliam Dam System from the Raised
(R6 Billion) Clanwilliam Dam
Key Message: An estimated funding of at least R126 Billion is required to finance key water resource development projects in the next 10 years.
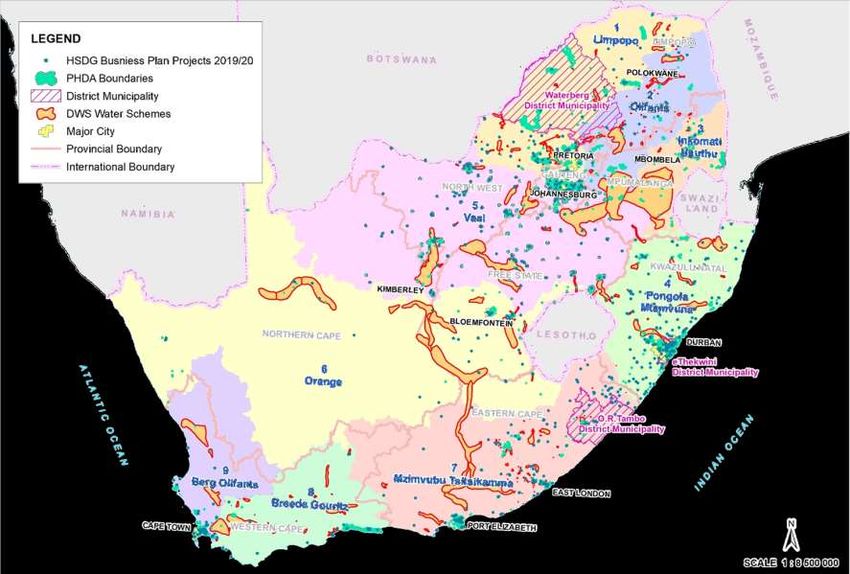
22Existing water schemes overlaid by Human Settlement Development
Grant (HSDG) projects & Priority Housing Development Areas (PHDAs)
Mokolo Crocodile
West Water
Augmentation
Project & Regional
Bulk Infrastructure
Projects
Phase 1 of
uMkhomazi Water
Project
Mzimvubu Water
Project & Regional
Bulk Infrastructure
Projects
23ALIGNMENT OF THE NW&SMP AND APP/BUSINESS
PLANS THROUGHOUT THE WATER SECTOR
National Development Plan
National Water & Sanitation Master Plan
First Order Urgent Priorities (FOUPs)
Private Sector Local and District
APPs (2020/21
National –
and Provincial PrivateIndustry,
(Agriculture, Sector Academia Research and
Local and District
Departments Academia Institutes
Tecnology Research and Municipalities
2024/25) (Agriculture,
Forestry, Industry,
Mining)
APPs (2020/21 – 2024/25) Tecnology Institutes Municipalities
Forestry, Mining)
Entities and SOES
Business Plans Civic Society Professional Bodies
(2020/21 – 2024/25) Organisations ECSA, SACNASP etc
24In Summary, Key NW&SMP Actions are to:
• Reduce water demand and increase supply
• Redistribute water for transformation
• Manage effective water and sanitation services
• Regulate the Water and Sanitation Sector
• Improve raw water quality
• Protect and restore ecological infrastructure
• Create an effective institutional enabling environment
• Manage data and information
• Build capacity
• Ensure financial sustainability
• Amend legislation
• Enhance research, development and innovation
25Business Process Re-engineering : 90 Day Turnaround
300 Days 90 Days
0 Pre-application enquiry 0 No Step Number of days
0 Pre-application 0
1 Application submitted 1
and compilation
2 Responsible authority 10 of application by
acknowledges receipt of the
application
applicant in
consultation
3 Applicant confirms arrangements 5
for site inspection with an
with DWS
allocated case officer (inclusive of
4 Site inspection to confirm water 20
technical reports
uses, determine information + Public
requirements and the need for Participation (60
public participation days)(streamlini
5 Confirm requirements for water 5 ng to DEFF)
use license application technical 1 Submit application 1
report based on site visit and and supporting
meeting
documents
6 Compilation, consultation and 105 2 Accept or reject 3
submission of water use licence application
application technical report by
3 Final Assessment – 70
applicant
scrutiny of technical
7 Reject / Accept water use licence 10 report for specialist
application technical report comments
8 Assessment and decision 144 4 Decision 16
Total 90
26Recommendations
• It is recommended stakeholders take note and
participate in the implementation of the National
Water and Sanitation Master Plan (NW&SMP) which
is key in securing water resource availability and
ensuring adequate provision of water and sanitation
services in south Africa
• Stakeholders take note of DWS’ developments in the
water use authorization regime, which improve
turnaround time from 300 to 90 days
27THANK
YOU
28You can also read