OLED Investor Presentation - 2Q 2021 UNIVERSAL DISPLAY CORPORATION 2021 ALL RIGHTS RESERVED
←
→
Page content transcription
If your browser does not render page correctly, please read the page content below
OLED
                            Investor
                        Presentation
                                        2Q 2021
                                    (updated: May 2021)

© UNIVERSAL DISPLAY CORPORATION 2021 ALL RIGHTS RESERVED

 © UNIVERSAL DISPLAY CORPORATION 2020 ALL RIGHTS RESERVED
All statements in this document that are not historical, such as those
             relating to the Company’s technologies and potential applications of
             those technologies, the Company’s expected results and future
             declaration of dividends, as well as the growth of the OLED market and
             the Company’s opportunities in that market, are forward-looking
             financial statements within the meaning of the Private Securities
             Litigation Reform Act of 1995. You are cautioned not to place undue
Forward-     reliance on any forward-looking statements in this document, as they
             reflect Universal Display Corporation’s current views with respect to
Looking      future events and are subject to risks and uncertainties that could cause
Statements   actual results to differ materially from those contemplated. These risks
             and uncertainties are discussed in greater detail in Universal Display
             Corporation’s periodic reports on Form 10-K and Form 10-Q filed with
             the Securities and Exchange Commission, including, in particular, the
             section entitled “Risk Factors” in Universal Display Corporation’s Annual
             Report on Form 10-K for the year ended December 31, 2020. Universal
             Display Corporation disclaims any obligation to update any forward-
             looking statement contained in this document.
                                                                                         2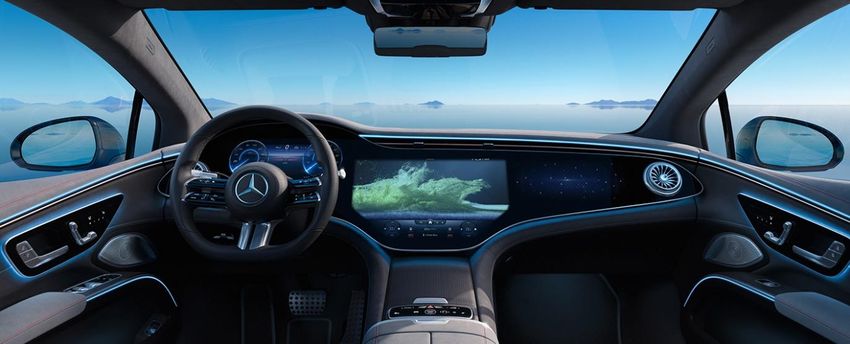
Universal Display Corporation

                                 Highly
Critical OLED                   Energy-
 Innovator &                    Efficient
   Enabler                      PHOLED                                     Fabless

                    OLED
                                                       5,000+
                  Materials
                                                        Global
                Supplier & IP
                                                       Patents*
                  Licensor

                                            * Pending and Issued Patents Worldwide as of February 10, 2021   3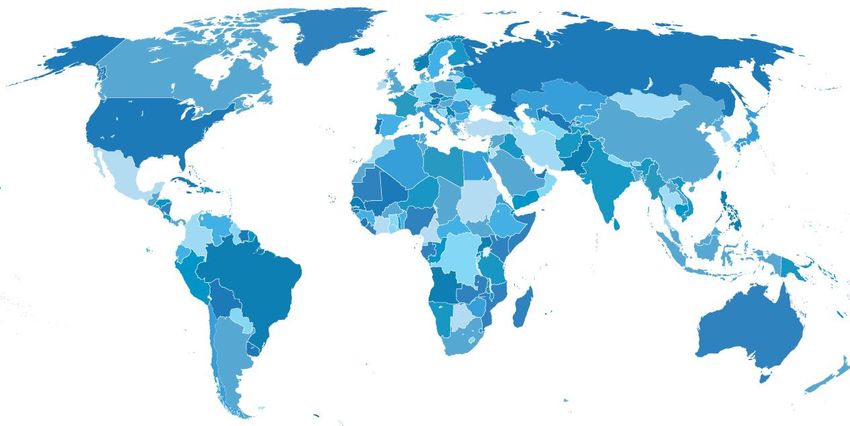
UDC’s Energy-Efficient Phosphorescent Materials: 100% UniversalPHOLED®
             emitters save energy and do not use conflict minerals

             Diverse & Inclusive Workplace: Geographically (from over 25 countries),
             culturally and gender-wise (22% female and 78% male*) diverse

             Board of Directors: 1/3 Female, 2/3 Male
             Named a 2020 Champion of Board Diversity by The Forum of Executive Women
UDC
Highlights
             Community Outreach: UDC supports a range of global educational initiatives,
             community service organizations and an employee charity matching program

             Strong Balance Sheet: $727M in cash**, no debt

             Fortune’s 100 Fastest-Growing Companies 2020
             Newsweek’s America’s Most Responsible Companies 2021
             Financial Times’ America’s Fastest-Growing Companies 42021
                           *As of December 31, 2020
                           **Cash, cash equivalents and short-term investments as of March 31, 2021   4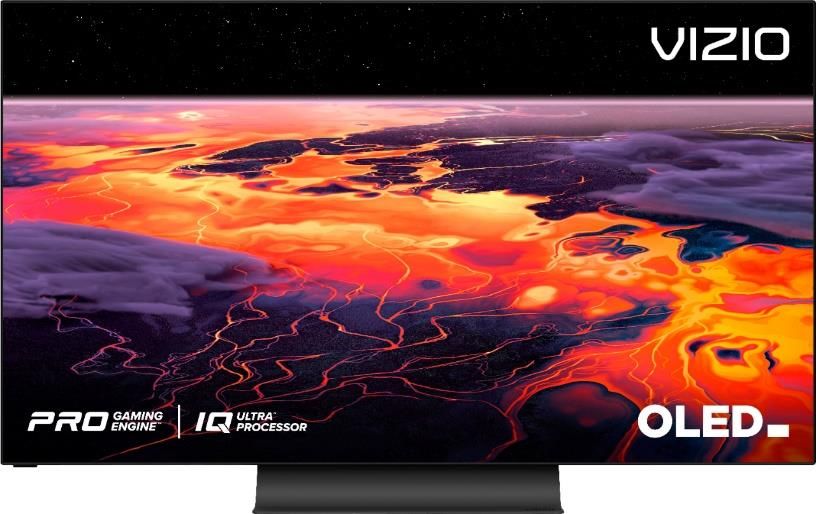
What is an OLED?
➢   An Organic Light Emitting Diode is a series of organic thin films between two
    conductors
➢   When electrical current is applied, bright light is emitted
➢   OLEDs can be used for displays and lighting
➢   OLEDs are not just thin and efficient - they can also be made flexible and transparent

                                            Note: For illustrative purposes only.            5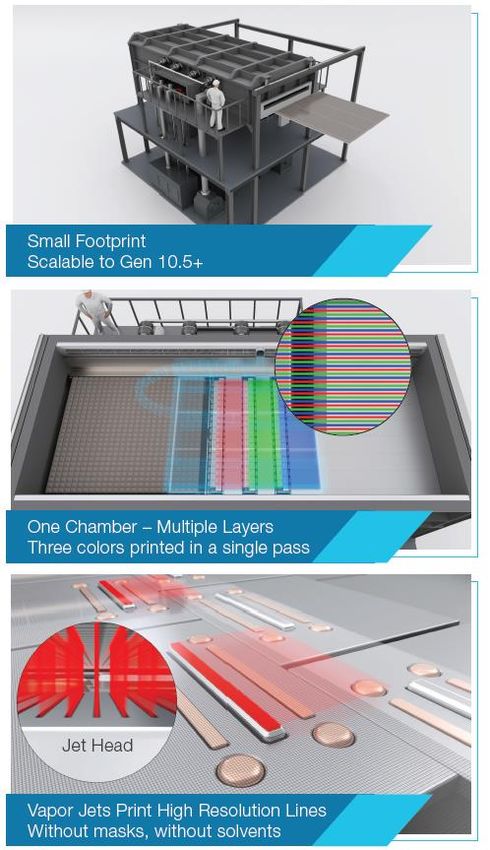
UniversalPHOLED = Energy Efficiency
With energy efficiencies that are up to four times higher than with conventional fluorescent OLED
materials, UDC’s patented and award-winning phosphorescent OLED technology and materials are
integral to enabling low power consumption in OLED displays and lighting.

                                                                        *
                                                                                           Phosphorescent Emitters
                                                                                           ✓ Enables energy efficiency
                                                                                           ✓ Reduces requirements for
                                                                                             heat dissipation
                                                                                             components
                                                                                           ✓ Increases lifetime
                                                                                           ✓ Lowers product cost

                                            *100% Internal Quantum Efficiency
                                            M. A. Baldo et. al., Nature, 395, 151 (1998)                                 6
Business Model
                   OLED       Innovation &
  Revenues
                  Enabler       Invention

  License         Patent        Device &
     &           Licensing    Architecture
  Royalty                          IP
    Fees

                  PHOLED      Composition
  Material
                 Emitters &   of Matter IP
   Sales
                   Hosts

                                             7
OLED Display Market Potential
                                                   Mobile          TV   IT/Wearables    Other
                 $50.0
                                                                                                        $46.7
                                                                                                $45.0
                                                                                       $41.6
                 $40.0                                                    $38.6

                                                           $30.6
    $ BILLIONS

                 $30.0                                                                                  736M*
                                         $25.2                                                  699M*
                         $23.6
                                                                                       646M*
                 $20.0
                                                                          584M*

                                         471M*             457M*
                 $10.0
                         408M*

                  $0.0
                         2018            2019               2020          2021         2022     2023    2024
*Unit Numbers are for mobile phones only
Source: Omdia OLED Display Market Tracker – Q4 2020 (April 2021)
                                                                                                                8
OLED Panel Area Demand
                                                    Mobile     TV         IT/Wearables   Other
                                 20.0                                                                        19.3

                                                                                                     17.1
                                                                                             15.4
     MILLIONS OF SQUARE METERS

                                 15.0                                                                        10.0M*
                                                                                13.8

                                                                                                     8.6M*
                                                                                             8.0M*
                                 10.0                              9.5          7.5M*
                                                8.2
                                         6.7
                                                               4.5M*
                                                3.3M*
                                  5.0   3.0M*

                                  0.0
                                        2018    2019               2020          2021        2022    2023    2024
*Unit Numbers are for OLED TVs only
Source: Omdia OLED Display Market Tracker – Q4 2020 (April 2021)
                                                                                                                      9
Strong OLED Display Market Drivers

                    • RED Phosphorescence                          • Improved image                                 • Fewer manufacturing

                                                                                              More Cost Effective
                                             Superior Aesthetics
                      reduces power                                                                                   process steps
Lower Power Usage

                                                                     quality
                      consumption by 25%                                                                            • Lower bill-of-
                                                                   • Thin and Light
                    • Add GREEN: 45%                                                                                  materials
                                                                   • 180 degree viewing
                      cumulative reduction                                                                           • No backlight
                                                                     angle
                    • Add BLUE: 75%                                                                                    required
                                                                   • 2,000,000+: 1
                      cumulative reduction                                                                           • No color filter
                                                                     contrast ratio – TRUE
                    • Enabled by PHOLEDs                             BLACK                                             required
                                                                   • Real-time video                                 • No liquid crystal
                                                                     speeds – excellent for                            required
                                                                     3D                                              • Reduced driver IC
                                                                   • Self-emissive display                             costs
                                                                   • Low UV output                                  • Enables non-glass
                                                                                                                      substrates
                                                                   • Minimal Bezel
                                                                   • Flexible

                                                                                                                                            10
OLED Smartwatches
& Smartphones
Apple Watch Series 6
Samsung Galaxy Watch 3 Huawei Watch
Fit Elegant
OnePlus
Watch ZTE Watch GT
Oppo Reno6 5G vivo V21 5G iPhone 12 Samsung Galaxy M42
ZTE nubia
Honor Play5 5G Realme Q3 Pro 5G TCL 20 Pro 5G Meizu 18 Pro Huawei Mate 40E OnePlus 9 Pro Xiaomi Mi 11i
11
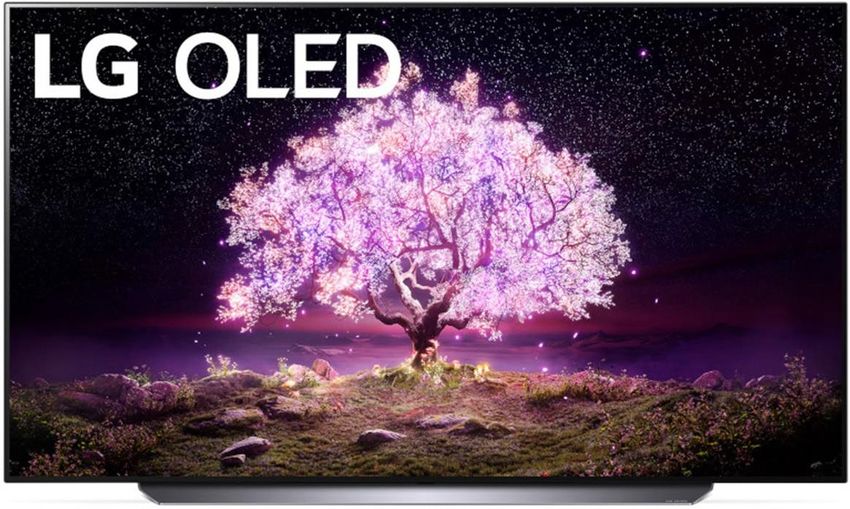
Z30 ProMore OLED Products
LG C1 65” Class 4K Smart OLED TV
VIZIO 55" Class 4K UHD SmartCast OLED TV Sony BRAVIA XR A90J 65” 4K HDR OLED TV
Lenovo
Pad Pro
Samsung Galaxy Book Pro
Razer
Blade 15
2022 Mercedes EQS: 56” OLED Hyperscreen - 12.3” gauge cluster,
17.7” central touchscreen, and 12.3” passenger touchscreen
Xiaomi Mi Laptop Pro 15” 12Form Factor: Flexible, Foldable, Rollable
Samsung
Galaxy Z
Flip
Xiaomi Mi Mix
Fold
Lenovo ThinkPad X1 Fold 13
Galaxy Z Fold2 5GLCD vs. OLED
TFT+OLED+Refiner
Diffuser Polarized Polarized
Sheet Film Film
Cell
TFT
Backlight
Unit
Polarized
Film
Color
Prism
Filter
✓ Lower BOM (bill of materials)
✓ Better Performance, More Efficient
✓ Thinner and Flexible Form Factor
✓ Vivid Colors and Superior Contrast Ratio
Image source: LG
14Groundbreaking Organic Vapor Jet Printing (OVJP)
• Mask-less, Solvent-less
(dry) Printing OLED
technology
• High material utilization
and fast TAKT time
• Scalable to Gen 10.5+
• Enables advanced OLED
performance with
process control
• Multi-color deposition in
one chamber
• Small molecule OLED
materials
• Supports 4K and 8K
resolution
• OVJP Alpha System
expected during 2022
15Strong OLED Lighting Market Drivers
Image source: LG Display
• Low drive voltage • Wide range of CCT, • Thin and lightweight
Highly desirable color quality
• Low operating high CRI possible • Transparent
environmentally friendly
Novel form factor &
Low-Cost Potential
temperatures, • Color tunable • Non-breakable,
Energy-efficient &
cool to touch • Instant “ON” , Conformable, Flexible,
• Long lifetime Dimmable without Foldable, Rollable
• Easy to control flicker
• No glare, no noise • Scaling advantage
• Low UV content • Roll to roll process
16OLED Lighting Around the World Today
17Strong, Broad and Deep Patent Portfolio
We develop and license enabling
technologies that are at the heart of
consumer OLED products worldwide, from
AR/VR, smartwatches, smartphones, IT,
automotive and TVs to lighting products.
We believe that our extensive portfolio of
patents, trade secrets and non-patented
know-how enable our leadership position
in the OLED ecosystem.
Our R&D innovations allow us to
continuously bolster the depth and
breadth of our global OLED intellectual
property framework, which currently
stands at over 5,000 issued and pending
patents worldwide (as of February 10,
2021).
18Patents are Universal
China
Europe (I-328 / P-274)
(I- 853 / P-131)
United States South Korea Japan
(I-1,297 / P-517) (I-452 / P-328) (I-826 / P-104)
Taiwan
(I-347 / P-21)
Over 5,000 patents and pending applications*
*as of February 10, 2021
19Strategic Display & Lighting Partnerships
SEEYA
TECHNOLOGY
20Historical Financial Performance
Revenue Income
($ in millions)
$428(2) $429 $160
$400.0 $405
$156.1(2)
$130.5(2)
$336 $138.3
$326(2) $120 $115.4(1) $133.4
$300.0
$247
$199 $80
$200.0
$58.8
$100.0 $40 $48.1
$- $0
2016 2017 2018 2019 2020
2016 2017 2018 2019 2020
ASC 605 Adjustment $- $- $78.9 $22.9 $-
Hosts $1.4 $1.6 $- $- $-
(1) Adjusted net income excludes the one-time charge due to the
Royalty & License $96.1 $126.5 $80.6 $150.0 $185.1 enactment of the Tax Cuts and Jobs Act.
See "Reconciliation of Non-GAAP Measures" for further discussion of
Emitters $97.9 $198.7 $153.2 $243.4 $229.7
these non-GAAP measures on slide 20.
As discussed in the 2020 10-K, the Company changed its method for accounting for
revenue from contracts with customers due to the adoption of ASC Topic 606 (2) Reflecting ASC 605 Adjustments.
(adopted January 1, 2018). 21Reconciliation of non-GAAP measures
The following table details our reconciliation of non-GAAP measures to the most directly comparable GAAP measures:
Year Ended December 31,
(in thousands, except per share data) 2017
(Unaudited)
Net income reconciliation
Net income $103,885.00
Net income per share:
Basic $2.19
Diluted $2.18
Net income adjustments:
Tax Cuts and Jobs Act $11,514.00
Adjusted net income $115,399.00 (2)
Adjusted net income per share:
Basic (1) $2.43
Diluted (1) $2.43
(1) The adjusted net income per common share, basic and diluted is derived from dividing adjusted net income by the number of weighted average shares used in computing basic and
diluted net income per common share.
(2) Adjusted net income is based on excluding the impact of the one-time charge due to the enactment of the Tax Cuts and Jobs Act for the year ended December 31, 2017.
Non-GAAP Measures - To supplement our selected financial data presented in accordance with U.S. generally accepted accounting principles (GAAP), we use certain non-GAAP measures.
These non-GAAP measures include adjusted net income (loss), adjusted net income (loss) per common share, basic and adjusted income (loss) per common share, diluted. Reconciliation
to the nearest GAAP measures of all non-GAAP measures included in the presentation can be found within the tables detailing the reconciliation of non-GAAP measures to GAAP measures
above. We have provided these non-GAAP measures to enhance investors' overall understanding of our current financial performance, and as a means to evaluate period-to-period
comparisons. We believe that these non-GAAP measures provide meaningful supplemental information regarding our financial performance by excluding the effect of the release of
income tax valuation allowances that may not be indicative of recurring core business operating results. We believe that the non-GAAP measures that exclude the impact of the release
of income tax valuation allowances and deferred income tax expense recognized after the release of the allowances, when viewed with GAAP results, enhance the comparability or
results against prior periods and allow for greater transparency of financial results. The presentation of non-GAAP measures is not intended to be considered in isolation or as a substitute
for, or superior to, the financial information prepared and presented in accordance with GAAP.
22Robust Capital Structure
($ in thousands, except share data)
March 31, 2021
Cash, Cash Equivalents and
$726,999
Short-Term Investments
Total Assets $1,310,500
Long-term Debt ------
A/P and Accrued Liab. $33,912
Deferred Revenue $178,124
Shareholders’ Equity $952,468
Total Shares Outstanding* 47,329,704
*Weighted average diluted shares used in computing net income per common share
23Company Summary
Global OLED Materials & Strong Financial
Technology Leader Performance
• Lighting up the OLED Revolution • $727M Cash, no debt*
• License & Sell Proprietary • $15.36 in cash/share*
Phosphorescent OLED Technology • High Margin Business
and Materials to Display & Solid- • Lean Operating Model
State Lighting Manufacturers OLED Strong
• Fabless Model; Partnering w/ PPG Leader Financials *as of March 31, 2021
• ~378 Employees (283 R&D, 123
PhDs); Largest Global PHOLED Team Leading Robust Comprehensive
Customers IP & Robust IP
Blue-Chip Customer Base
• Largest Phosphorescent
• Displays: Samsung, LG Display, OLED (PHOLED) Technology
BOE, Tianma, CSOT, Visionox, Sharp & Materials Portfolio
• Lighting: Kaneka, Konica Minolta, • Over 5,000** Issued &
Lumiotec, OLEDWorks, Sumitomo Pending Patents Worldwide
Chemical and Growing
• Working with over 25 Companies
**as of Feb 10, 2021
.
24You can also read