O.R TAMBO DISTRICT MUNICIPALITY - THE DISTRICT DEVELOPMENT MODEL 10 December 2020 - SALGA
←
→
Page content transcription
If your browser does not render page correctly, please read the page content below

O.R TAMBO DISTRICT MUNICIPALITY

     THE DISTRICT DEVELOPMENT MODEL
KNOWLEDGE EXCHANGE AND PEER LEARNING SESSION FOR
         METRO/DISTRICT MUNICIPALITIES

             REFLECTIONS AND INPUTS

               10 December 2020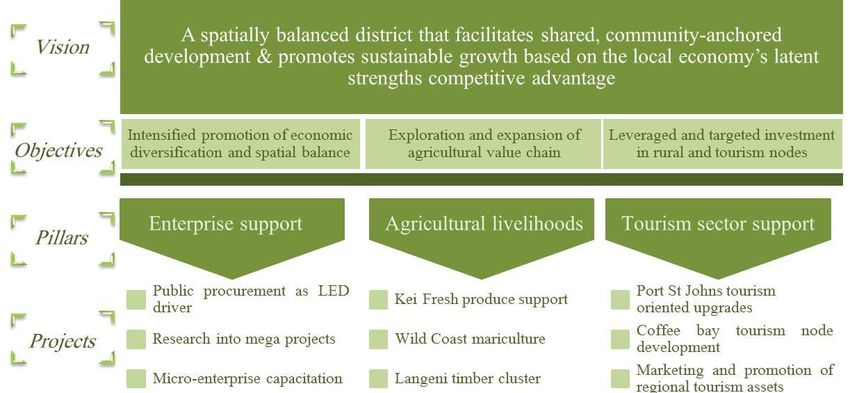
2
                      Outline
• Background and context
• Strategic Objectives of the District Development
  Model
• Situational Analysis
• Alignment of DDM to IDP/Budget Process Plan
• Progress
• DDM Roadmap
• Challenges & Risks

                                                     2
3
                  PURPOSE

• To share the concept of the District
  Development Model
• To reflect on the progress made to date in the
  implementation
• Share the institutional arrangement of the
  model
4
                   Background & Context
• OR Tambo District Municipality (ORTDM) was identified as one of the pilot
  sites for the implementation of the District Development Model (DDM).
• The DDM was launched by the President in Lusikisiki, Ingquza Hill Local
  Municipality on the 17th of September2019.
• The DDM is based on establishing District Hubs that embody One Plan of
  government to express the short term, medium term and long-term
  development objectives of national, provincial and local government in
  the geographic boundaries of the District.
• The One Plan will be strategic in nature expressing the commonly agreed
  diagnostics, strategies and actions which will be broken down to annual
  operation plans and five to ten-year implementation plans so as to
  enhance service delivery and development in the district’s area of
  jurisdiction.
5
            Strategic Objectives of the DDM
• The DDM is premised on institutionalizing a programmatic approach to
  Intergovernmental Relations, which enables:
   – Improving integrated planning across government through the formulation
     and implementation of One Plan or Joined-Up Plans for each of the 44 District
     and 8 Metropolitan geographic spaces or (52 IGR Impact Zones).
   – Streamlined and effective Local Government and/or authority’s capacity
     building by consolidating and strategically coordinating capacity building
     initiatives and programmes at district level.
   – Municipalities and authorities to perform their mandated functions and
     duties effectively and efficiently by mobilizing and making available expertise,
     key skilled personnel and systems that can be shared between district as well
     as local municipalities and authorities as needed.
   – Monitoring of the effectiveness of government and the spatial and
     developmental impact on communities in the 52 IGR Impact Zones.
Situational Analysis: Overview
• Provides a succinct synthesis of the status quo as regards
  development in the region
• Key statistics in terms of demographic profiling, human
  development and economic performance are presented
• Allows comparison of the district to the relevant provincial as
  well as national averages
• Also provides an economic potential assessment, discussed as
  per all the SIC sectors in the district.
• The purpose of this situation analysis is to provide an
  informational basis that informs planning

                                                               6
O. R Tambo District Profile
• At just over 1 457 384 people, the district has the largest
  population of all the districts in the Eastern Cape province, and is
  also the most densely populated region at 120 people/km2
• Between 2001 and 2011, the district’s population grew at an
  average annual rate of 0.5%, which is above the provincial
  average of 0.4%
• The economically active age groups of 15-64 years account for
  55% of the total population, with the remaining 45% made up of
  those below 15 and above 64 (Dependency rate)

                                                                   7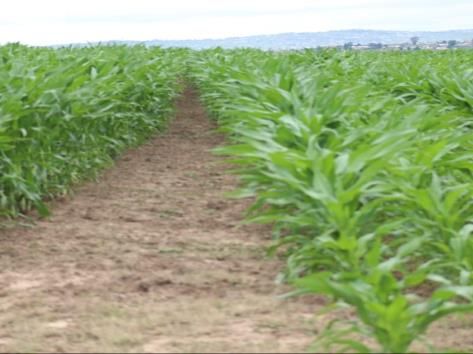
ECONOMY
The economic state of O. R. Tambo District Municipality is put in perspective by
comparing it on a spatial level with its neighbouring district municipalities,
Eastern Cape Province and South Africa. The section will also allude to the
economic composition and contribution of the local municipalities within
O.R.Tambo District Municipality.
The O. R Tambo District is predominantly rural based economy with 93% of the
population dwelling in rural areas and as such the effects of any shocks in the
economy are likely to be felt in the rural areas even more.
The COVID-19 induced countrywide lockdown has exposed some faults and gaps
within the economy. The retail sector has been affected most in the O. R Tambo
District and exposed the unsustainable nature and structure of the sector.

1/9/2021                                                                       8
ECONOMY
The problems faced by the retail and trade Sector and especially the ones in the
O. R Tambo region also offer opportunity for business. The advent of COVID-19
has exposed the need to strengthen the retail sector, change approaches, re-
establish other supply chain and logistical avenues.
COVID-19 has exposed the unsustainable supply and distribution of food related
goods to most spazas, informal traders, and even food parcels procurement and
distribution. The few available distribution is owned by large corporations and
non South Africans locking out the local businesses. There is a need to change
that structural dynamics and introduce local businesses to claim a stake into the
retail, food and distribution sector.
The informal trade sector (Hawkers, Spazzas & waste harvestors) was also the
hardest hit by the pandemic as such realising a critical need for strategic economic
recovery and turnaround of the entire economy

1/9/2021                                                                           9
O. R Tambo District Profile
   • 41% of the district population is unemployed.
   • 15% employed in highly skilled positions, 36% in skilled
     positions and the remainder in unskilled positions
Indicator
                                      ORTDM     EC      SA

Population with Matric or higher
                                       12%      18%     28%

Not economically active
                                       36%      32%     26%

Labour force participation
                                       33%      47%     60%

Unemployment rate
                                       41%      33%     27%

                                                              10
O. R Tambo District Profile
• Distribution of household earnings
R 204801 or more 0.1%
R 102401 - R 204800 0.1%
R 51201 - R 102400 0%
R 25601 - R 51200 2%
R 12801 - R 25600 3%
R 6401 - R 12800 5%
R 3201 - R 6400 8%
R 1601 - R 3200 21%
R 801 - R 1600 24%
R 401 - R 800 14%
R 1 - R 400 7%
No income 16%
11
0% 5% 10% 15% 20% 25% 30%INDEX OF BUYING POWER - O.R.TAMBO, EASTERN CAPE AND NATIONAL
O.R.Tambo Eastern Cape National Total
Population 1,495,999 7,222,764 58,125,712
Population - share of national total 2.6% 12.4% 100.0%
Income 34,311 291,870 3,420,872
Income - share of national total 1.0% 8.5% 100.0%
Retail 12,413,520 89,503,454 1,056,444,000
Retail - share of national total 1.2% 8.5% 100.0%
Index 0.01 0.09 1.00
O.R.Tambo District Municipality has a 2.6% share of the national population, 1.0%
share of the total national income and a 1.2% share in the total national retail, this all
equates to an IBP index value of 0.012 relative to South Africa as a whole. Eastern
Cape has an IBP of 0.089. , were South Africa has and IBP index value of 1 relative to
South Africa as a whole.
The considerable low index of buying power of the O.R.Tambo District Municipality
suggests that the district municipality has access to only a small percentage of the
goods and services available in all of the Eastern Cape Province. Its residents are most
likely spending some of their income in neighbouring areas.
1/9/2021 12Number and percentage of people in poverty
O.R.Tambo, 2008-2018
1,250,000 86%
84%
1,200,000
82%
1,150,000
80%
1,100,000 78%
76%
1,050,000
74%
1,000,000
72%
950,000 70%
2008 2009 2010 2011 2012 2013 2014 2015 2016 2017 2018
Number of people in poverty Percentage of people in poverty
Source: IHS Markit Regional eXplorer version 1803
In 2018, there were 1.21 million people living in poverty, using the upper poverty line
definition, across O.R.Tambo District Municipality - this is 5.97% higher than the
1.14 million in 2008. The percentage of people living in poverty has decreased from
84.37% in 2008 to 80.95% in 2018, which indicates a decrease of 3.42 percentage points.
1/9/2021 13Percentage of people living in poverty
O.R.Tambo District Municipality, 2018
100.0%
90.0%
80.0%
70.0%
60.0%
50.0%
40.0%
30.0%
20.0%
10.0%
0.0%
Ingquza Hill Port St Johns Nyandeni Mhlontlo King Sabata
Dalindyebo
Source: IHS Markit Regional eXplorer version 1803
In terms of the percentage of people living in poverty for each of the regions within
the O.R.Tambo District Municipality, Port St Johns Local Municipality has the highest
percentage of people living in poverty, using the upper poverty line definition, with a
total of 87.0%. The lowest percentage of people living in poverty can be observed in
the King Sabata Dalindyebo Local Municipality with a total of 72.3% living in poverty,
using the upper poverty line definition.
1/9/2021 14Gini coefficient
O.R.Tambo, Eastern Cape and National Total, 2008-2018
0.66
0.64
0.62
0.60
0.58
0.56
0.54
0.52
0.50
2008 2009 2010 2011 2012 2013 2014 2015 2016 2017 2018
O.R.Tambo Eastern Cape National Total
Source: IHS Markit Regional eXplorer version 1803
In 2018, the Gini coefficient in O.R.Tambo District Municipality was at 0.557, which
reflects a marginal decrease in the number over the ten-year period from 2008 to
2018. The Eastern Cape Province and South Africa, both had a more unequal spread
of income amongst their residents (at 0.623 and 0.629 respectively) when compared
to O.R.Tambo District Municipality.
1/9/2021 15Gini coefficient
O.R.Tambo District Municipality, 2018
0.6
0.6
0.6
0.5
0.5
0.5
0.5
0.5
Ingquza Hill Port St Johns Nyandeni Mhlontlo King Sabata
Dalindyebo
Source: IHS Markit Regional eXplorer version 1803
In terms of the Gini coefficient for each of the regions within the O.R.Tambo District
Municipality, King Sabata Dalindyebo Local Municipality has the highest Gini
coefficient, with an index value of 0.589. The lowest Gini coefficient can be observed
in the Nyandeni Local Municipality with an index value of 0.508.
1/9/2021 16Poverty gap rate
O.R.Tambo District Municipality, 2018
34.0%
33.0%
32.0%
31.0%
30.0%
29.0%
28.0%
2008 2009 2010 2011 2012 2013 2014 2015 2016 2017 2018
Source: IHS Markit Regional eXplorer version 1803
The poverty gap is used as an indicator to measure the depth of poverty. The gap
measures the average distance of the population from the poverty line and is
expressed as a percentage of the upper bound poverty line, as defined by StatsSA.
In 2018, the poverty gap rate was 31.4% and in 2008 the poverty gap rate was
33.7%,it can be seen that the poverty gap rate decreased from 2008 to 2018,
which means that there were improvements in terms of the depth of the poverty
within O.R.Tambo District Municipality.
1/9/2021 17Gross Domestic Product (GDP)
Eastern Cape Province, 2018
Nelson Mandela Bay
O.R.Tambo
Buffalo City
Alfred Nzo
Joe Gqabi Chris Sarah
Hani Baartman
Amatole
Source: IHS Markit Regional eXplorer version 1803
The O.R.Tambo District Municipality had a total GDP of R 40.7 billion and in
terms of total contribution towards Eastern Cape Province the O.R.Tambo
District Municipality ranked third relative to all the regional economies to total
Eastern Cape Province GDP. This ranking in terms of size compared to other
regions of O.R.Tambo remained the same since 2008. In terms of its share, it was
in 2018 (10.8%) slightly smaller compared to what it was in 2008 (11.4%). For
the period 2008 to 2018, the average annual growth rate of 0.3% of O.R.Tambo
was the sixth relative to its peers in terms of growth in constant 2010 prices.
1/9/2021 18Gross Domestic Product (GDP)
O.R.Tambo District Municipality, 2018
Ingquza
Hill
Port St
Johns
King Sabata
Dalindyebo Nyandeni
Mhlontlo
Source: IHS Markit Regional eXplorer version 1803
The greatest contributor to the O.R.Tambo District Municipality economy is the King
Sabata Dalindyebo Local Municipality with a share of 65.95% or R 26.8 billion,
increasing from R 12.8 billion in 2008. The economy with the lowest contribution is
the Nyandeni Local Municipality with R 2.45 billion growing from R 1.25 billion in
2008.
1/9/2021 19O. R Tambo District Profile
• District Economic Structure
O.R. Tambo 18% 1% 5% 11% 10% 14% 39%
2%
South Africa 5% 30% 2% 5% 12% 10% 18% 15%
3%
0% 10% 20% 30% 40% 50% 60% 70% 80% 90% 100%
Agriculture Mining Manufacturing
Electricity & water Construction Trade 20
Transport & communication Finance & business services Government & Community ServicesGross Value Added (GVA) by broad economic sector
O.R.Tambo District Municipality, 2018
Community
services
Agriculture
Mining
Manufacturing
Finance Electricity
Construction
Trade
Transport
Source: IHS Markit Regional eXplorer version 1803
The community sector, which includes the government services, is generally a large
contributor towards GVA in smaller and more rural local municipalities. When looking at
the regions within the district municipality, the King Sabata Dalindyebo Local Municipality
made the largest contribution to the community services sector at 64.16% of the district
municipality. As a whole, the King Sabata Dalindyebo Local Municipality contributed R
24.8 billion or 66.85% to the GVA of the O.R.Tambo District Municipality, making it the
largest contributor to the overall GVA of the O.R.Tambo District Municipality.
1/9/2021 21LED Strategic Pillars
22LED Priority Pillars
• KSD has comparatively high levels of education and low levels of
unemployment
• Economy has a comparatively higher level of value addition through
the presence of medium-scale manufacturing industries – but still lags
far behind EL & PE
• Mthatha serves an important retail function for the surrounding region
• KSD LM has prioritized Informal Traders Development for the
2016/17 financial year
• The municipality is also engaging Informal Traders through forums
• The LM has also benefited from partnerships to develop informal
traders
2324
Alignment of DDM to IDP/Budget Process Plan
DDM activities towards ONE PLAN
October 2019 to 10 December 2020ENVISAGED DISTRICT ONE PLAN & ITS
CONTENTS
01 Demographic and District
Profile
02 Economic Positioning
03 Spatial Restructuring
04 Infrastructure Engineering
05 Integrated Services
Provisioning
06 Governance &
Management
25INSTITUTIONAL FRAMEWORK
MECHANISM
• The workstreams are to be anchored by the Project Management Unit which will
be able to consolidate the reports for the structures below:
DIMAFO
2627
Progress
The following key meetings have been convened in the District
with a specific focus on the DDM:
• District Mayors Forum (DIMAFO) 19 January 2020
• Provincial COGTA DDM Engagements 28 & 29 January 2020
• ORTDM IDP Representative Forum 31 January 2020
• ORTDM DDM Meeting 6 February 2020
• ORTDM Strategic Planning Session 19 – 21 February 2020
• ORTDM DDM Meeting 25 February 2020
• ORTDM CLLRS WORKSHOP 15 March 2020
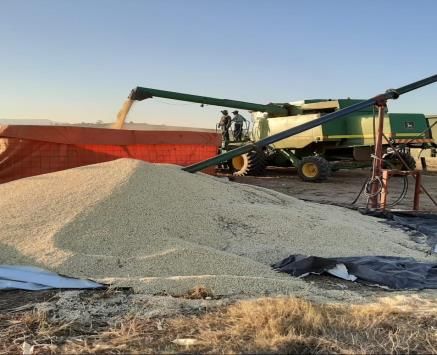
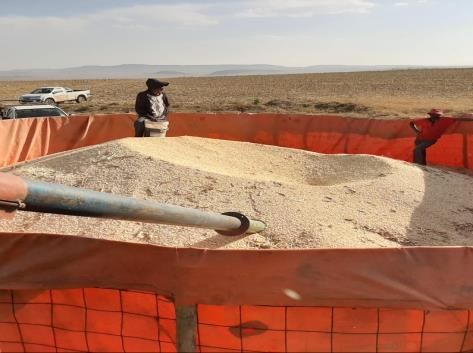
• District Mayors Forum (DIMAFO) 02 December 2020PROJECT GALLERY
2020/21 REDP PROGRAMS
                                                                                               Annual                       Description
Indicator Code Key Performance Indicator (KPI)            Project              Budget 20/21    Target
                                                                                                20/21
                                                                                                              1000 tons of waste recycled as per Waste
 1_9_1_P017       1. Tons of waste recycled      P017 Landfill Management               R 0 1000 tons
                                                                                                                         Management Act
                 1. Number of MIG projects
                 monitored and evaluated on                                                              20 MIG projects to be monitored and evaluated on
                                                 P093 Environmental Impact
1_17_1_P093         Environmental Impact                                                R0     20             Environmental Impact Assessment (EIA)
                                                  Assessment Compliance
                      Assessment (EIA)                                                                             implementation every quarter
                      implementation
1_12_10_P03                                                                                                                   Refurbishment:
     5           10. Number of public toilet                 P035                                                           Hole in the Wall (Q2)
                          facilities             Refurbishment/Constructio      R 1 500 000    3                              Coffee Bay (Q1)
                  refurbished/constructed           n of ablution facilities                                                    Construction:
                                                                                                                         Ingquza Hill - Imbotyi (Q4)
               1. Number of Local Spatial                                                                            1. Mthatha Future Metro Region
                                            P041 Spatial Development
 2_2_1_P041    Development Frameworks                                             R 660 858    3                               2. Magwa LSDF
                                                  Frameworks
                  developed/reviewed                                                                                         3. OR Tambo SDF
            2. Number of SPLUMA initiatives                                                                  4 x District Municipal Planning Tribunal Sitting
 2_2_2_P042                                  P042 SPLUMA Initiatives              R 927 323    4
                      conducted                                                                                                   (quarterly)
                                                                                                           1. Capacity building of new recycling cooperatives
                                                                                                                                  (quarterly)
                 1. Number of programmes
                                                                                                                 2. Recapitalisation programmes (Q2 & 3)
 2_3_1_P096      implemented on Regional          P096 Regional Recycling       R 3 500 000    8
                                                                                                             3. Maintenance of the main processing centre
                        Recycling
                                                                                                         (assessment of available infrastructure and maintain
                                                                                                         as per the recommendations of the report) (Q1 & 3)
                                                                                                        1. Development and review of 4 Environmental Sector
                                                                                                                  Plans - IWMP, EMP, AQMP & BSP (Q4)
                                                                                                         2. Greenest Municipal Competition Pre-Assessments
                 1. Number of Environmental                                                                              (Q1) and assessment (Q1)
                                                    P043 Environmental
 2_4_1_P043          management projects                                        R 3 006 883    17           3. Greenest Municipal Competition Awards (Q2)
                                                       Management
                        implemented                                                                         4. Environmental calendar days celebration (Q2)
                                                                                                              5. World Environmental Day celebration (Q4)
 1/9/2021                                                                                               6. 8 x Environmental Club and Education programmes 30
                                                                                                                        (Q1 (2), Q2, Q3 (2) & Q4 (3))
DDM Roadmap 31
Now to Mid-Sept 2021
October 2019 to Next Local Government 2021 – 2050
May 2020 Term (Electoral Cycle)
One Plan One Plan
Reprioritisation
Formulation Implementation
• Profiles and Gap • Deep dive research • Informs IDP and
Analysis • Diagnostic study implemented via 5-
• National and • Visioning (Desired year IDP cycles
Provincial Budgets Future) • Informs and
• Quick Interventions • Strategies implemented via
• Rethinking • Action Plan / MTSF and
approaches Projects departmental
• Fix problems • Informed by IDP plans, APPs
• 2020/21 IDP • Informed by NDP, • Reflect and Review
NSDF, sector plans
and MTSF32
Challenges & Risks
The following challenges have been identified so far:
• DDM Roadmap understood by few role players;
• The participation of sector departments (both national and
provincial) is very inconsistent, leading to information gap;
• Excessive planning at baseline is not easy to coordinate.
• Role ambiguity at local level.END
33You can also read