OSRAM improves operating profitability - early COVID-19 response implemented - Q2 FY20 Earnings Release (preliminary, unaudited figures)
←
→
Page content transcription
If your browser does not render page correctly, please read the page content below
www.osram.com

OSRAM improves operating profitability –
early COVID-19 response implemented

Q2 FY20 Earnings Release (preliminary, unaudited figures)

OSRAM Licht AG | May 7, 2020
Light is OSRAM

Disclaimer

This presentation as well as other reports, presentations, materials delivered to shareholders and press releases may contain forward-looking
statements that are subject to risks and uncertainties, including those pertaining to the anticipated benefits to be realized from the proposals
described herein. In addition, our representatives may from time to time make oral forward-looking statements. Forward-looking statements
may include, in particular, statements about future events, future financial performance, plans, strategies, expectations, prospects,
competitive environment, regulation and supply and demand. OSRAM Licht AG has based these forward-looking statements on its current
views and expectations and on certain assumptions of which many are beyond OSRAM Licht AG's control. These are subject to a number of
risks, uncertainties and factors, including, but not limited to those described in disclosures, in particular in the sub-chapter Risks in the Annual
Report. Actual financial performance could differ materially from that projected in the forward-looking statements due to the inherent
uncertainty of estimates, forecasts and projections, and financial performance may be better or worse than anticipated. Given these
uncertainties, readers should not put undue reliance on any forward-looking statements. The information contained in this presentation is
subject to change without notice and OSRAM Licht AG does not undertake any duty to update the forward-looking statements, and the
estimates and assumptions associated with them, except to the extent required by applicable laws and regulations.

This presentation includes references to non-IFRS financial measures, including, but not limited to: FCF, EBITDA, EBITDA margin, capital
expenditure, capital expenditure as percentage of revenue, net financial debt and net working capital. We have provided these measures and
other information in this presentation because we believe they provide investors with additional useful information to assess our performance.
Our use of these supplemental financial measures may vary from others in our industry and should not be considered in isolation or as an
alternative to our results as reported under IFRS.

Due to rounding, numbers presented throughout this and other documents may not add up precisely to the totals provided and percentages
may not precisely reflect the absolute figures.

2   OSRAM Licht AG
    Q2 FY20 Earnings Release (preliminary, unaudited figures) | May 7, 2020
Good second quarter earnings – OSRAM braces for challenges ahead

Statement from the CEO

                                                                                 “After a robust start into the fiscal year, our second quarter results continued to
                                                                                 show year-on-year improvements in operating profitability and free cash flow.
                                                                                 Sales performance was impacted by COVID-19-related supply chain and
                                                                                 demand disruptions especially towards the end of March.

                                                                                 OSRAM has reacted to the unfolding crisis with speed and determination. While
                                                                                 we are confronted with low macroeconomic visibility and demanding day-to-day
                                                                                 operations, the organization is pulling together to mitigate the financial impact.
    Q2 FY20 summary:
    • Revenue of €821m                                                           At the same time, it is all the more important to continue on our strategic path
    • Adjusted EBITDA margin of 11.7%                                            towards long-term profitable growth. I am convinced that OSRAM will emerge
    • Positive free cash flow                                                    strongly from this year’s challenges.”
    • Decisive action taken to mitigate
      coronavirus impact

3      OSRAM Licht AG
       Q2 FY20 Earnings Release (preliminary, unaudited figures) | May 7, 2020
Good year-on-year improvement in profitability and cash flow despite
COVID-19 impact on sales performance

    Revenue (€m) / comp. growth                                                               EBITDA adj. (€m) / margin
                                                                        YoY decline due to
                              -7.9%                                     supply chain                           +26                    Profitability
                                                                        disruptions in                                                continued to
               862                               821                                                                      96
                                                                        China and lower               70                              benefit from
                                                                        demand in the                                                 performance
                                                                        early stages of the                             11.7%         measures
                                                                                                     8.1%
                                                                        pandemic
             Q2/19                             Q2/20                                                 Q2/19              Q2/20

    Free cash flow (€m)                                                                       Comments:

                               +140
                                                                        Sharp swing in        ▪ Slight comparable revenue decline at OS due to
                                                                        free cash flow          temporary closure of production in Wuxi, China
                                                  64                    driven by higher
                                                                                              ▪ DI sales hit hardest and earliest especially given
                                                                        EBITDA and
                                                                        reduction of
                                                                                                exposure to entertainment and cinema markets
                                                                        working capital       ▪ Sharp profit improvement at OS overcompensates
               -76
                                                                                                volume-driven decline at AM
             Q2/19                             Q2/20

4    OSRAM Licht AG
     Q2 FY20 Earnings Release (preliminary, unaudited figures) | May 7, 2020
COVID-19 pandemic and resulting measures are leading to severe drop in
economic climate – shape of recovery will be key
OECD Leading Indicator1) Global Manufacturing PMI2)
Global 101 OECD Composite Leading Indicator 55 J.P. Morgan Purchasing Manager Index
Economics Calendar months Calendar months
54
53
100
52
51
50
99
49
48
98 47
01/18 04/18 07/18 10/18 01/19 04/19 07/19 10/19 01/20 04/20 01/18 04/18 07/18 10/18 01/19 04/19 07/19 10/19 01/20 04/20
Sources: 1) OECD Composite Leading Indicator (CLI) as published on data.oecd.org
2) JP Morgan Purchasing Manager Index, J.P. Morgan and IHS Markit in cooperation with ISM und IFPSM
5 OSRAM Licht AG
Q2 FY20 Earnings Release (preliminary, unaudited figures) | May 7, 2020Car production disruptions and recession-induced demand drop will have a
noticeable near-term impact
Global light vehicle production by quarter Light vehicle production by region (YoY, %)
Automotive Units (million) Y/Y
World Europe
Market FY20
30 10%
-5.9 -4.0 1,4
90m 71m 5%
-4% 0% 1,0 -20.7 -3,3
0,8 -4,0 -23.4
-9% -5%
25
-10%
22.8 0,2
-15%
-23% FY19 2019
2018 FY20
2020 FY19
FY19 FY20 FY20
FY21
-20%
20 19.2 -25%
17.6 -30% NAFTA China
-35%
-40%
15 -47% -1.3
-45% -13.3 -12.4
-24.8
-50%
11.6
-55%
10 -60%
Oct- Jan- Apr- Jul- Oct- Jan- Apr- Jul- FY19 FY20 FY19 FY20
Dec’18 Mar’19 Jun’19 Sep’19 Dec’19 Mar’20 Jun’20 Sep’20
Source: Light vehicle production forecast based on monthly IHS Data, fiscal year based. As of: April 27, 2020
6 OSRAM Licht AG
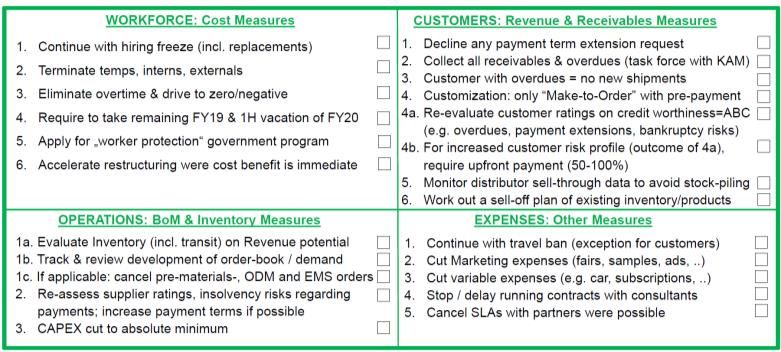
Q2 FY20 Earnings Release (preliminary, unaudited figures) | May 7, 2020COVID-19 countermeasures: Early and decisive with top-down leadership
Clear action fields Detailed work packages
Short-term Cash & cost Customers Performance
Long-term Strategy Structure Innovation
Web-based performance measurement tool Communication & motivation
Measures
Maturity / phasing
Reports
The OSRAM team is responding to this crisis with professionality and resilience
7 OSRAM Licht AG
Q2 FY20 Earnings Release (preliminary, unaudited figures) | May 7, 2020Within weeks, SHIELD has led to gross savings and financing
activities worth more than €200m until end of FY20
(€m)
EBITDA Free Cash Flow Total liquidity
measures measures measures
200-225
85-95
Financing
40-50 Capex
etc.
EBITDA FCF
effect
FY20 FY20 FY20
▪ Personnel-related measures (vacation Includes majority of EBITDA measures Includes FCF measures and further
and flex time reduction, short-time and further working capital & capex financing activities:
work, furlough, shifted/cancelled related activities: ▪ Close communication with banks
hiring) ▪ Investment reduction or postponement ▪ Optimized use and extension of credit
▪ Operations-related measures ▪ Accounts receivable management / facilities
▪ Discretionary spending factoring ▪ Weekly liquidity steering
▪ Inventory optimization ▪ Further measures ready if needed
Impact measured against pre-crisis baseline/planning. EBITDA effect includes ~30m vs. prior year.
Total liquidity impact includes both permanent and one-off savings, as well as postponed cash-out (subject to re-assessment at the end of deferral period), and financing activities.
8 OSRAM Licht AG
Q2 FY20 Earnings Release (preliminary, unaudited figures) | May 7, 2020Existing performance programs are moving ahead with €300m total gross
savings until FY22
Gross savings Q2 FY201) Comments
Overhead • Q2 FY20 performance program savings met
productivity €17m
global expectations and contributed to profitability
• Major contributors were Opto Semiconductors and
Corporate Overheads
• Further plant transformation and structural measures
Transformation
of plants
€9m kicked off in April
• Total gross savings target until FY22 raised to €300m2)
Total €26m
1) Gross savings compared to FY19 baseline 2) For period between Q1 FY18 and Q4 FY22
9 OSRAM Licht AG
Q2 FY20 Earnings Release (preliminary, unaudited figures) | May 7, 2020Q2 FY20 revenue initially on track but COVID-19 starts to show effects
Revenue (€m) / Comp. growth (%)1)
OSRAM Group: Revenue bridge Q2 FY20 YoY OS Revenue Development (comp. growth)
-1.8%
862 1.1% 2.1% -7.9% 821
1.2%
363 363 385 359 362
Q2/19 Q3/19 Q4/19 Q1/20 Q2/20
Revenue FX Portfolio Comparable Revenue AM Revenue Development (comp. growth)
Q2/19 growth Q2/20
-8.7%
-9.7%
OSRAM Group: Revenue by Region Q2 FY20 447 432 457 480 431
Q2/19 Q3/19 Q4/19 Q1/20 Q2/20
Comp. growth
30% -7.2%
DI Revenue Development (comp. growth)
37% EMEA
-12.3%
APAC -9.4%
AMERICAS -7.2%
-7.0%
227 232 268 217
33% 200
1) On
Q2/19 Q3/19 Q4/19 Q1/20 Q2/20
October 1, 2019, OSRAM made minor organizational changes involving reclassification between the reportable segments (OS, AM, DI, CIE)
10 OSRAM Licht AG
Q2 FY20 Earnings Release (preliminary, unaudited figures) | May 7, 2020OS and DI with improved profitability; AM below prior year level
Adjusted EBITDA (€m) / Adjusted EBITDA Margin (%)1)
Adjusted EBITDA2) Q2 FY20 YoY OS adjusted EBITDA
96
24.5%
6 18.9% 21.0%
13 14.3% 16.6%
70 7 88 76
11.7% 60 73
8.1% 52
Q2/19 Q3/19 Q4/19 Q1/20 Q2/20
Adj. EBITDA Price & Inflation OPEX, Mix, Adj. EBITDA AM adjusted EBITDA
Q2 19 vs. Productivity3) IFRS16 Volume / Digr., Other Q2 20
9.6% 9.7%
Comments 5.8% 6.9%
5.1%
▪ Adj. EBITDA above prior year driven by OS as well as by savings from performance 43 47
27 30
programs; application of IFRS16 with positive EBITDA effect of €+13m 22
▪ Adj. EBITDA in Corporate Items: €-12m
Q2/19 Q3/19 Q4/19 Q1/20 Q2/20
▪ EBITDA Special Items: €-46m (incl. €-45m personnel restructuring)
▪ Net Income: €-39m from continuing operations DI adjusted EBITDA
▪ OS: Increased EBITDA vs. PY driven by functional cost savings and product portfolio 4.3%
measures to improve profitability
▪ AM: Profitability impacted by lower volume and higher OPEX vs. PY; productivity savings 11 0.8%
overcompensate negative price and inflation effects -1 2
-3 -7
▪ DI: adj. EBITDA improvement despite lower volume driven by higher gross margin (mainly -1.5% -0.3%
productivity savings) and reduced functional costs at DS -2.9%
1) On October 1, 2019, OSRAM made minor organizational changes involving reclassification between the reportable segments (OS, AM, DI, CIE)
Q2/19 Q3/19 Q4/19 Q1/20 Q2/20
2) Adjustment for special items (S.I.) includes a.o. transformation costs, substantial legal and regulatory matters, and costs related to mergers and acquisitions activities including the sale of subsidiaries, investments and other businesses. 3) Related to COGS.
11 OSRAM Licht AG
Q2 FY20 Earnings Release (preliminary, unaudited figures) | May 7, 2020Positive Free Cash Flow
Free Cash Flow / Net Debt / Liquidity (€m)
Free Cash Flow1) bridge Q2 FY20 Net debt bridge Q2 FY20
2.30 Leverage Ratio (Net Debt / EBITDA as reported)2) 1.93
EBITDA 50
-2 -532
Trade Receivables 67 -585 -10
64
Inventories -25
Net Debt, FCF Purchases of Other investing Net Debt,
Trade Payables -7 Dec 31, 2019 Investments and financing Mar 31, 2020
activities
Income taxes paid -14 Cash and cash equivalents plus unused lines of credit
800 788 783
Capex -22
200
Undrawn Part of
490
590 Syndicated Credit Facility
Other 16
(committed)
583 Cash & Cash Equivalents
FCF 1)
64 310
198
Q4/19 Q1/20 Q2/20
1) Defined as net cash provided by (used in) operating activities less capital expenditures 2) PY EBITDA adjusted by IFRS16 lease effect
12 OSRAM Licht AG
Q2 FY20 Earnings Release (preliminary, unaudited figures) | May 7, 2020Appendix
13 OSRAM Licht AG
Q2 FY20 Earnings Release (preliminary, unaudited figures) | May 7, 2020Financial calendar and IR contact information
Upcoming events
▪ May 11, 2020
Interim Report for the first half of fiscal year 2020, Munich, Germany
▪ May 13, 2020
Virtual Roadshow
▪ July 29, 2020
Earnings release for the 3rd quarter of fiscal year 2020, Munich, Germany
Investor Relations contact
Telephone + 49 89 6213 4259
Internet http://www.osram-group.de/en/investors
Email ir@osram.com
14 OSRAM Licht AG
Q2 FY20 Earnings Release (preliminary, unaudited figures) | May 7, 2020Key financial metrics (continuing operations)1)
(preliminary, unaudited)
Group (€m) Q2 FY20 Q2 FY19 Change (y-o-y)
nom. -4.7 %
Revenue 821 862 comp. -7.9 %
Gross margin 25.3% 23.8% 150 bps
R&D -104 -119 -12.0 %
SG&A -159 -156 1.8 %
EBITDA 50 11 350.1 %
EBITDA margin 6.1% 1.3% 480 bps
Adj. EBITDA 96 70 36.8 %
Adj. EBITDA margin 11.7% 8.1% 350 bps
Financial result, including at-equity result (continuing operations) -6 -7 -12.6 %
Income (loss) before income taxes (continuing operations) -42 -110 -62.0 %
Taxes 3 19 87.0 %
Net income (loss) (continuing operations) -39 -91 -56.7 %
Diluted EPS in € (continuing operations) -0.32 -0.86 -62.8 %
Free cash flow (continuing operations) 64 -76 n.a.
CAPEX -22 -61 -63.3 %
Net debt -532 -350 52.1 %
Equity ratio 44.9% 53.2% -830 bps
Employees (in thousands) 22.3 25.0 -11.1 %
1) There was a change in presentation affecting the consolidated statement of income at the start of fiscal year 2020, because the application engineering function in the OS Segment has been assigned to sales since that date, having
previously been classified as research and development. FY19 was restated accordingly
15 OSRAM Licht AG
Q2 FY20 Earnings Release (preliminary, unaudited figures) | May 7, 2020Segment overview (continuing operations)1)
(preliminary, unaudited)
OSRAM
Q2 FY20 (€m) OS AM DI CIE Licht Group
Revenue 362 431 200 -173 821
Change % vs. PY reported -0.3% -3.6% -11.5% -4.7%
Change % vs. PY comparable -1.8% -8.7% -12.3% -7.9%
EBITDA 76 10 -1 -35 50
EBITDA margin 21.0% 2.4% -0.6% 6.1%
Special items EBITDA 0 -20 -3 -23 -46
therein transformations costs -3 -18 -8 -20 -48
EBITDA before special items 76 30 2 -12 96
EBITDA margin before special items 21.0% 6.9% 0.8% 11.7%
Assets2) 1,294 684 407 2,154 4,540
Free cash flow 60 37 -18 -15 64
Additions to intangible assets and property, plant and equipment 9 12 1 0 22
Amortization 2 6 3 1 12
Depreciation PP&E 47 9 5 1 62
Depreciation right of use assets 4 3 2 2 11
1) On October 1, 2019, OSRAM made minor organizational changes involving reclassification between the reportable segments (OS, AM, DI, CIE)
2) Net assets on segment level; total assets on group level; CIE includes reconciling items.
16 OSRAM Licht AG
Q2 FY20 Earnings Release (preliminary, unaudited figures) | May 7, 2020Consolidated statement of income (continuing operations)1)
(preliminary, unaudited)
Three months ended Three months ended
Mar 31 Mar 31
in (€m) 2020 2019
Revenue 821 862
Cost of goods sold and services rendered -614 -657
Gross profit 207 205
Research and development expenses -104 -119
Marketing, selling and general administrative expenses -159 -156
Other operating income 21 8
Other operating expense -1 -41
Income (loss) from investments accounted for using the equity method, net -3 -2
Interest income 1 0
Interest expense -6 -4
Other financial income (expense), net 1 -1
Income (loss) before income taxes OSRAM (continuing operations) -42 -110
Income taxes 3 19
Income (loss) OSRAM (continuing operations) -39 -91
Income (loss) from discontinued operation, net of tax -2 -6
Net income (loss) -42 -97
Attributable to:
Non-controlling interests -9 -7
Shareholders of OSRAM Licht AG -32 -90
Basic earnings per share (in €) -0.34 -0.93
Diluted earning per share (in €) -0.34 -0.92
Basic earnings per share (in €) OSRAM (continuing operations) -0.32 -0.86
Diluted earning per share (in €) OSRAM (continuing operations) -0.32 -0.86
1) There was a change in presentation affecting the consolidated statement of income at the start of fiscal year 2020, because the application engineering function in the OS Segment has been assigned to sales since that date, having
previously been classified as research and development. FY19 was restated accordingly.
17 OSRAM Licht AG
Q2 FY20 Earnings Release (preliminary, unaudited figures) | May 7, 2020Consolidated Statement of Comprehensive Income (continuing operations)
(preliminary, unaudited)
Three months ended Three months ended
Mar 31 Mar 31
in (€m) 2020 2019
Net income (loss) -42 -97
Items that will not be reclassified to profit or loss
Remeasurements of defined benefit plans 7 3
thereof: income tax -3 0
Measurements of equity instruments at fair value 0 0
thereof: income tax 0 0
Items that may be reclassified subsequently to profit or loss
Currency translation differences -12 47
Derivative financial instruments -2 -1
thereof: income tax 1 0
-15 46
Other comprehensive income (loss), net of tax -8 49
Total comprehensive income (loss) -49 -48
Attributable to:
Non-controlling interests -11 -7
Shareholders of OSRAM Licht AG -39 -41
18 OSRAM Licht AG
Q2 FY20 Earnings Release (preliminary, unaudited figures) | May 7, 2020Consolidated statement of financial position (continuing operations)
(preliminary, unaudited)
As of As of
As of As of
Mar 31 Sep 30
Mar 31 Sep 30
in (€m) 2020 2019
in (€m) 2020 2019
Liabilities and equity
Current liabilities
Assets Short-term debt and current maturities of long-term debt 841 539
Current Assets Trade payables 495 548
Other current financial liabilities 109 113
Cash and cash equivalents 583 310
Current contract liabilities 15 14
Trade receivables 470 558 Current provisions 67 69
Other current financial assets 39 29 Income tax payables 59 65
Other current liabilities 350 347
Contract assets 9 9 Liabilities associated with assets held for sale - 90
Inventories 737 692 Total current liabilities 1,937 1,786
Income tax receivables 20 21 Long-term debt 274 120
Pension plans and similar commitments 140 167
Other current assets 95 113 Deferred tax liabilities 15 17
Assets held for sale - 93 Provisions 32 33
Other financial liabilities 16 27
Total current assets 1,951 1,824
Contract liabilities 1 1
Goodwill 185 186 Other liabilities 84 102
Other intangible assets 252 273 Total liabilities 2,500 2,252
Equity
Property, plant and equipment 1,387 1,493
Common stock, no par value 97 97
Right of use assets 213 - Additional paid-in capital 1,669 1,672
Investments accounted for using the equity method 55 56 Retained earnings 263 255
Other components of equity 49 79
Other financial assets 35 25 Treasury shares, at cost1) -94 -99
Deferred tax assets 412 410 Total equity attributable to shareholders of OSRAM Licht AG 1,984 2,004
Non-controlling interests 56 79
Other assets 49 70
Total equity 2,039 2,083
Total assets 4,540 4,335 Total liabilities and equity 4,540 4,335
1) As of March 31, 2020 OSRAM held 2,664,388 treasury shares (September 30, 2019: 2,796,275 shares).
19 OSRAM Licht AG
Q2 FY20 Earnings Release (preliminary, unaudited figures) | May 7, 2020Consolidated statement of cash flows (continuing operations)
(preliminary, unaudited)
Three months Three months Three months Three months
ended ended ended ended
Mar 31 Mar 31 Mar 31 Mar 31
in (€m) in (€m) 2020 2019
2020 2019
Cash flows from operating activities Cash flows from investing activities
Net income (loss) -42 -97 Additions to intangible assets and property, plant and equipment -22 -61
Adjustments to reconcile net income (loss) to cash provided Acquisitions, net of cash and cash equivalents acquired - -2
Purchases of investments -2 -5
Income (loss) from discontinued operation, net of tax 2 6
Proceeds and payments from sales of investments, intangible assets, and property, plant
Amortization, depreciation, and impairments 85 114 2 0
and equipment
Income taxes -3 -19 Proceeds and payments from the sale of business activities, net cash disposed of - 22
Interest (income) expense, net 5 4 Net cash provided by (used in) investing activities - OSRAM (continuing operations) -23 -45
(Gains) losses on sales and disposals of businesses, intangible Net cash provided by (used in) investing activities discontinued operation - -1
0 1
assets, and property, plant and equipment, net
Net cash provided by (used in) investing activities - OSRAM Licht Group (total) -23 -46
(Income) loss from investments 3 2
Cash flows from financing activities
Other non-cash (income) expenses 1 2
Purchase of treasury stocks - -7
Change in current assets and liabilities
Proceeds from capital increases at subsidiaries with minority interests - 3
(Increase) decrease in inventories -25 28 Repayment of long-term debt -8 -8
(Increase) decrease in trade receivables 67 13 Change in short-term debt and other financing activities 337 198
(Increase) decrease in other current assets -3 13 Interest paid -7 -2
Increase (decrease) in trade payables -7 -57 Dividends paid to shareholders of OSRAM Licht AG - -107
Increase (decrease) in current provisions -4 -3 Net cash provided by (used in) financing activities - OSRAM (continuing operations) 322 76
Increase (decrease) in other current liabilities 28 -8 Net cash provided by (used in) financing activities discontinued operation - -
Change in other assets and liabilities -7 2 Net cash provided by (used in) financing activities - OSRAM Licht Group (total) 322 76
Income taxes paid -14 -16 Effect of exchange rates on cash and cash equivalents -1 4
Interest received 1 0 Net increase (decrease) in cash and cash equivalents 384 12
Net cash provided by (used in) operating activities - OSRAM Cash and cash equivalents at beginning of period 198 243
86 -16
(continuing operations) Cash and cash equivalents at the end of period 583 255
Net cash provided by (used in) operating activities discontinued Less: Cash and cash equivalents of discontinued operation at end of the reporting period - 0
- -7
operation Cash and cash equivalents at end of period (consolidated statement of financial
Net cash provided by (used in) - OSRAM Licht Group (total) 86 -22 583 255
position)
20 OSRAM Licht AG
Q2 FY20 Earnings Release (preliminary, unaudited figures) | May 7, 2020You can also read