Earnings Call Q3 2019 November 6, 2019 - Quanterix
←
→
Page content transcription
If your browser does not render page correctly, please read the page content below

Earnings Call Q3 2019 November 6, 2019

Forward-Looking Statements & Non-GAAP Financial Measures

This presentation contains “forward-looking” statements that are based on our beliefs and assumptions and on information
available to us as of the date of this presentation. Forward-looking statements include all statements that are not historical facts.
We may not actually achieve the plans, intentions or expectations disclosed in our forward-looking statements. Forward-looking
statements involve known and unknown risks, uncertainties, assumptions and other factors that may cause our actual results,
performance or achievements to be materially different from any future results, performance or achievements expressed or
implied by the forward-looking statements. The risks and uncertainties that we face are described in our most recent filings with
the Securities and Exchange Commission. Except as required by law, we assume no obligation to update these forward-looking
statements, even if new information becomes available in the future.
To supplement the Company’s financial statements presented on a GAAP basis, the Company has provided certain non-GAAP
financial measures, including Non-GAAP revenue, Non-GAAP gross profit and Non-GAAP gross margin. Our non-GAAP
adjustments exclude (i) the impact of $1.3M in revenue recognized in Q3 2018 in connection with the termination of our license
agreement with bioMerieux SA; and (ii) acquisition-related purchase accounting adjustments in connection with our acquisitions
of Aushon Biosystems in Q1 2018 and Uman Diagnostics in Q3 2019. Management uses these non-GAAP measures to
evaluate the Company’s operating performance in a manner that allows for meaningful period-to-period comparison and analysis
of trends in its business. Management believes that such measures are important in comparing current results with prior period
results, and are useful to investors and financial analysts in assessing the Company’s operating performance. The non-GAAP
financial information presented here should be considered in conjunction with, and not as a substitute for the financial information
presented in accordance with GAAP. Investors are encouraged to review the reconciliation of these non-GAAP measures to their
most directly comparable GAAP financial measures set forth on Slide #27.

                                                                                         Quanterix Earnings Call | Q3 2019 | November 6, 2019 | 2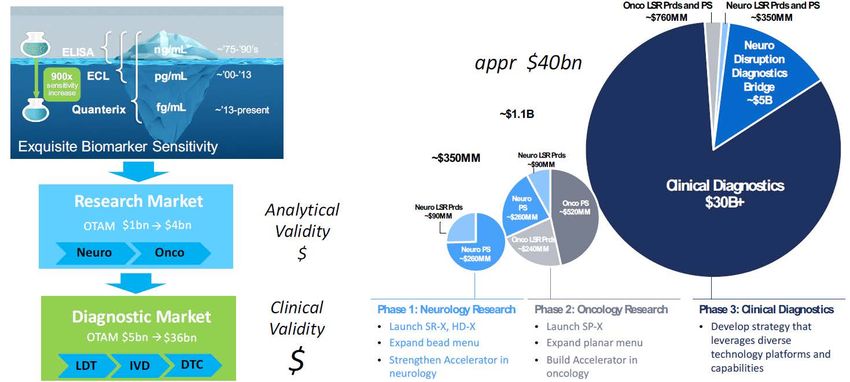
Today’s Agenda

I.     Strategic and Financial Progress – Kevin Hrusovsky – Chairman, CEO

        i.    Q3 Highlights, Direction & 2019 Goals

        ii.   Neurology Momentum & PPH

II.    Financial Report – Amol Chaubal – CFO

III.   Q&A

                                                                 Quanterix Earnings Call | Q3 2019 | November 6, 2019 | 3
Disruptive Market, Technology and Growth

Q3 Highlights                                                                                                                          Total Quanterix Revenue Growth
                                           Q3 2019                   Q3 2018
    Revenue ($million)                                                                                                       Q1           Q2        Q3          Q4
          Adjusted*                           $14.9                     $9.2                                           % Reported GAAP Growth
                                                                                                                                                               +64%
                                                                                                                       % Non-GAAP Growth
              GAAP                            $14.9                     $10.6                                          (if different from GAAP)                +59%
                                                                                                                                                                                    40.8
                                                                                                                                                                     37.6
    Gross Margin (%)
           Adjusted*                         51.8%                     46.2%                                                                                                        14.9
                                                                                                                                                                                           41%
                                                                                                                                                                     10.9 65%
              GAAP                           47.1%                     52.8%                                                                                                               62%
                                                                                                                                                  +30%

•    HD-X shipped early                                                                                                                              22.9
                                                                                                                                +44%                                 10.6 86%
     Closed Uman acquisition                                                                                                                                                63%
•                                                                                                                                        17.6            6.6                        13.5   57%
•    Raised $69m growth capital
                                                                                                                         12.2             6.7            5.7
•    Nf-L assay highlighted in a record 50 publications at                                                                                                           8.6 66%
     ECTRIMS (Multiple Sclerosis) conference in Stockholm                                                                 4.2             3.4
                                                                                                                                                         5.2
•    Dr. Tatiana Plavina 18 year Biogen veteran joined QTRX                                                               2.6
                                                                                                                                          3.4                                       12.3   64%
                                                                                                                          2.6                                         7.5 41%
•    Completed Siemens Nf-L license & Techne supply                                                                       2.7             4.1            5.3
     agreement
                                                                                                                        2015            2016         2017         2018            YTD 2019

* Non-GAAP item. Reconciliations are included in the Appendix to this presentation and in our Q3 2019 press release.                     Quanterix Earnings Call | Q3 2019 | November 6, 2019 | 4
Q3 2019 Growth Led by Consumables and Services

                                                                                                                                                                                              Growth
                                                                                                                                                                                                               Mix%
                                                                                                                                                                                                %
                               Q3 2019             Q3 2018                YoY                            $m Revenue            Q3 2018       Q3 2019
                                                                                                         (GAAP)
Revenue
                                                                      Growth                                                                     2.3                                             82%            28%
($million)                                                                                                 Instruments                                                   4.1
         Adjusted*               $14.9                $9.2              +62%
                                                                                                           Consumables                                             3.7                           79%            44%
                                                                                                                                                                                       6.6
                                                                                                           Lab. &                                       3.0
Gross Margin                                                                                               Other Services                                                4.2                     39%            28%
(%)
                                                                                                           Collaboration(1)                1.6
                                                                         +560                                                 0.0
         Adjusted*              51.8%                46.2%
                                                                         bps                         (1) Q3 2018 Collaboration Revenue includes $1.3M recognized in connection with termination of a license agreement

                                                                                                                                                                                              Growth
                                                                       YoY                                                                                                                                     Mix%
                              YTD Sept.           YTD Sept.
                                                                                                         $m Revenue            Q3 YTD 2018          Q3 YTD 2019                                 %
                                2019                2018              Growth                             (GAAP)
Revenue                                                                                                                                       6.0                                                70%            25%
($million)                                                                                               Instruments                                          10.3
         Adjusted*                                                      +61%                                                                                                                     91%            46%
                                 $40.8               $25.4                                                                                                   9.9
                                                                                                         Consumables                                                                18.8
                                                                                                         Lab. &
                                                                                                                                                                                                 35%            29%
Gross Margin                                                                                                                                           8.7
(%)                                                                                                      Other Services                                             11.8

                                                                         +570                            Collaboration(2)          2.1
         Adjusted*               50.7%               45.0%                                                                  0.0
                                                                         bps                        (2) Q3 YTD 2018 Collaboration Revenue includes $1.3M recognized in connection with termination of a license agreement
   * Non-GAAP item. Reconciliations are included in the Appendix to this presentation and in our Q3 2019 press release.
                                                                                                                                                       Quanterix Earnings Call | Q3 2019 | November 6, 2019 | 5
Convergence of Technology and Healthcare

    Digital Biomarkers
                                             Late; Invasive
            analog

             digital

                                           Early; Non-Invasive
                                                                 6
1. Neuro Beachhead 2. Penetrate Onco – Inflammation

                                                                                            Onco LSR Prds and PS   Neuro LSR Prds and PS
                                                                                                 ~$760MM                ~$350MM

                                                                                                                      Neuro
                                                                               ~$36B                                Disruption
                                                                                                                    Diagnostics
                                                                                                                      Bridge
                                                                                                                       ~$5B
                                                             ~$1.1B

                                          ~$350MM               Neuro LSR Prds
                                                                  ~$90MM

                                                                                                     Clinical Diagnostics
                                     Neuro LSR Prds
                                                               Neuro
                                                                 PS
                                                                                Onco PS
                                                                               ~$520MM
                                                                                                            $30B+
                                       ~$90MM                 ~$260MM

                                                               Onco LSR Prds
                                                  Neuro PS      ~$240MM
                                                  ~$260MM

                              Phase 1: Neurology Research             Phase 2: Oncology Research             Phase 3: Clinical Diagnostics

                                                                                    Quanterix Earnings Call | Q3 2019 | November 6, 2019 | 7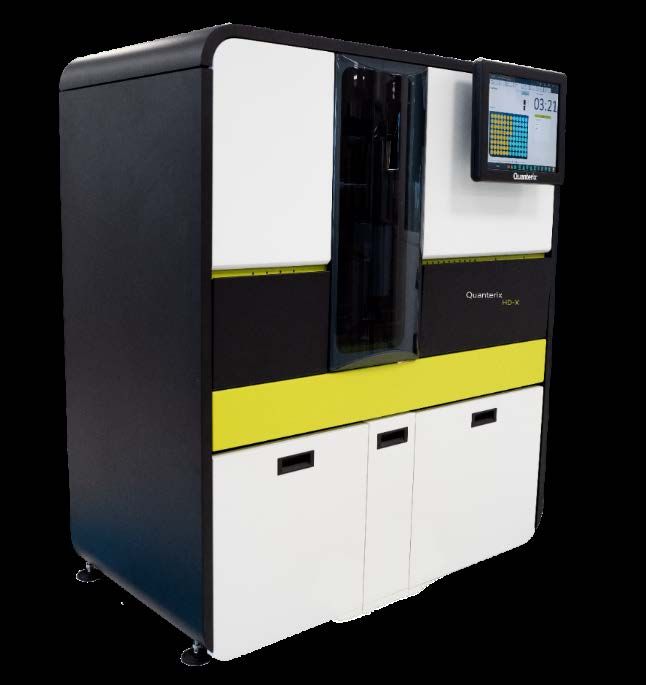
Q3 YTD 2019 Growth Stratification

                                                                                     2%
             12%                                                                          2%

         Geography                    50%Customer 50%
                                                                               36%   Diseases
                        53%
       35%                                                                                        60%

                   Growth                            Growth                                     Growth

                                                                                                            96%
        NA         +63%             Pharma/Biotech CRO +70%                      Neurology +123%
        Europe +105%                Academia                                     Oncology        +68%
                                                      +98%
        Asia       +129%

                                                              Quanterix Earnings Call | Q3 2019 | November 6, 2019 | 8
Scientific Research is Driving Brand Awareness,
Performance and Utilization
PUBLICATIONS* MARKERS* ACCELERATOR INSTRUMENTS CONSUMABLES
* Cumulative
$m Revenue # of units placed Consumables Revenue
Other Number of Drug Trial Projects Instument Revenue Growth vs. PYR Quarterly Revenue (excl. Study Revenue**)
622 Study Revenue
Oncology Quarter Revenue Growth % (excl. Study Revenue)
81 70%
Neurology 370 Quarter Revenue Growth % (Reported)
145 119%
29
48%
316 61 83%
80%
92%
409 35 7.7 278
162 45 7.4 22 79%
259 73%
1.0 .5 6.6
129 28 5% 45 59% 6.1 6.2
0.2
0.7
2.4 -6%
190 4.9 176
19 18
216 13
88 4 0.5 22 3.9
206 120 3.7
133 175 0 0.6 280 3.4 0.2
10 0.1
12 3.1
80 315 6.7 211 2.8 6.0
128 14 2.5 5.4
0.6
104 4.6 71
37 91 0.5 141 3.7
56 192 53 3.8 17 3.6
12 46 1.1 96
7
30 19 89 34 65 0.2 2.0
43 56 45
39 30 0.7
14 12
2015 2016 2017 2018 2019 Dec. Mar. Jun. Sept. Dec. Mar. Jun. Sept.
2015 2016 2017 2018 2019 2015 2016 2017 2018 2019 2015 2016 2017 2018 2019 2017 2018 2018 2018 2018 2019 2019 2019
YTD YTD YTD YTD
** Study Revenue includes $1.2m of Consumables Revenue recognized between Q3 2018 and Q2 2019 in connection with orders
from one customer for use in a large clinical study. Quanterix Earnings Call | Q3 2019 | November 6, 2019 | 9
Quanterix Product Offerings

                            Instruments                                      Assay kits                                Services

     HD-X                       SR-X                    SP-X                Plate            Bead                        Accelerator

Floor-standing integrated   Benchtop semi-         Simoa planar assay             300+ assays                       Contract research & testing
                            automated assay prep
Assay prep and detection                           Benchtop semi-                Homebrew kits                      Custom assay development &
                                                   automated assay prep                                             reagent production
Major performance                                                            Singleplex and Multiplex
improvements over HD-1                             Multiplex capabilities                                           CLIA and LDT capabilities

550+ publications

                                                                                        Quanterix Earnings Call | Q3 2019 | November 6, 2019 | 10
Simoa HD-X Analyzer ahead of schedule
Delivering disruption that you can count on
Unparalleled ultra-sensitivity, leveraging years of experience
Productivity improvements, greater flexibility and temperature
control
Best-in-class assay performance across a broad assay menu
Regulatory Compliance – Enables 21CFR Part 11 compliance
– Began shipping ahead of schedule in Q3
– Trade-in program exceeding expectations
– Early access customer results very promising
Quanterix Earnings Call | Q3 2019 | November 6, 2019 | 11Competitive Landscape
Bead-Based Planar SP-X Bead-based Erenna Electrochemi-
Technology ELLA
Simoa Simoa Immunoassay Immunoassay luminescence
Sensitivity
Dynamic Range
Automation & Ease of
Use
Precision
Multiplexing
Menu
Cost
Quanterix Earnings Call | Q3 2019 | November 6, 2019 | 122019 Goals
Large strides in Q3 towards securing our 2019 objectives
NeurologyWe are Addressing a Significant Unmet Need in Drug Development
DRUG PERFORMANCE PROBABILITY OF DRUG APPROVAL VALIDATION OF SIMOA IMPACT
TOXICITY 300% Simoa’S at CROs Trials at
Adverse drug events are a substantial 38
32
cause of
Death in USA increase if biomarkers are used
EFFICACY Hematology 26.1%
Depression 62% Infectious disease 19.1% 2
0
Schizophrenia 60% Metabolic 15.3%
2015 2018 2015 2018
Cardiac arrhythmia 60% Gastroenterolgy 15.1% 650 clinical trials
Asthma 60% Autoimmune 11.1% 8.4% with Simoa at single
Goes to CRO
All indications 9.6%
25%
Diabetes 57% 400 PHASE I
Osteoporosis 48% Neurology 8.4%
Approval 200 PHASE II
Hepatitis C 47% Cardiovascular 6.6% after PHASE I
Oncology 5.1% 50 PHASE III
AD 30%
Cancer 25% Probability of phase III approval
after Phase 1 approval
Source: Bio Industry Analysis; Clinical Development Success Rates (June 2016) Quanterix Earnings Call | Q3 2019 | November 6, 2019 | 14FDA Supporting Biomarker Development
1
FDA issuing guidance to
enable use of biomarkers
in drug trials for early
stage disease cohorts
Neuro health has become Biopharma industry
national Health Priority due discouraged by lack of
2
to veteran PTSD, opioid returns and use of Biopharma deploying
addictions, AD subjective cognitive biomarker approaches to
demographics mental , endpoints trial design
health issues, and
healthcare burden of
neurological conditions
Source: Health Advances analysis, Quanterix materials.
Quanterix Earnings Call | Q3 2019 | November 6, 2019 | 15Strategic Roadmap
Analytical Validity to Clinical Validity
HIGH
Analytical Validity
Traditional Clinical Validity
Late Detection
via biopsy and
Technology
Troponin
lumbar
puncture
PSA ?
Biomarker ?
Abundance
Nf-L ?
Early
Detection in
blood, saliva &
urine
$
Tau
$
ABeta
?
?
$ ?
Research Trials Diagnostics
LOW Value and Risk
Quanterix Earnings Call | Q3 2019 | November 6, 2019 | 16Nf-L Rapidly Expanding as Best In Class Neuro Biomarker
PEER-REVIEWED PUBLICATIONS ON Nf-L
Simoa NfL NFL PUBLICATIONS
46 active
160
Key meeting Abstracts and presentations
clinical trials
60 25
2015
140 Our Focus
using Nf-L
50 2016
20
2017
40
PubMed Citations
120 2018
30 15
49
100 20 40 10
10 21
10 5
80 0
AAN 2018 AAN 2019 ECTRIMS ECTRIMS
2018 2019 0
60 5 Phase III trails across >1600 MS patients Parkinsons FTD ALS Alzheimers TBI MS
demonstrate clinical utility of Simoa NfL
40 STUDIES CONFIRM NFL CLINICAL UTILITY:
• Disease activity monitoring
20 • Drug efficacy monitoring
• Relapse/severity prognostic
0
2000 2002 2004 2006 2008 2010 2012 2014 2016 2018
Source: Health Advances analysis, PubMed. Publication Year Majority of published data obtained with Simoa NfL
Quanterix Earnings Call | Q3 2019 | November 6, 2019 | 17.
Serum Nf-L Powering Major Drug Trials
Advancing toward the Clinic
Powering • Phase III ASCLEPIOS I and II trials: Relapsing MS patients had reduced disease
Drug Trials progression
• Nf-L measurements used as secondary endpoint, reduction after 3 months
Comparative • Retrospective data from Phase III OPERA I, OPERA II, AND ORATORIO trials: MS
Effectiveness of patients treated saw Nf-L levels lowered to healthy donor levels.
Therapeutics • Ocrevus: $1.75B sales, highest MS drug share in US of 40%
Understanding of genetics of MS severity
Revealing
•
• Identifying additional biomarkers in MS
Biology of
• sNf-L measured shown to be increased 6 years before onset of
Disease
MS
Advancing
• Nf-L showing extensive evidence for future IVD assay
Toward Clinic
Quanterix Earnings Call | Q3 2019 | November 6, 2019 | 18Uman Nf-L Antibody is Unparalleled
Publications (CSF & Blood)
Not based on
Based on Uman Nf-L
Uman Nf-L 23%
112
77%
382
Based on
Uman Nf-L
77%
100%
382
172
100%
Publications on Blood 172
Quanterix Earnings Call | Q3 2019 | November 6, 2019 | 19Quanterix to Offer Nf-L IVD Assay
in Partnership with Siemens
• Non-exclusive license to Siemens to develop NF-L IVD assay on
Siemens platform
• Siemens Nf-L assay combined with Quanterix/Uman’s Nf-L
antibody specificity provides clinically relevant sensitivity in
blood/serum for Multiple Sclerosis monitoring applications
• 1M patients with MS in US, should be tested twice annually similar
to MRI, TAM of 2M tests annually just for MS monitoring
• Provides pathway for Uman NF-L monetization in IVD with
immediate global scale – leverage Siemens installed base globally
• Highly favorable economics (details undisclosed)
• Demand already exists for MS treatment monitoring application but
volume could be significantly higher if AD, TBI, etc. clinically proven
in future
• Maintains Quanterix optionality for further value creation through
either diagnostic multiplex panels/algorithms and ultra-sensitive
clinical applications
Quanterix Earnings Call | Q3 2019 | November 6, 2019 | 20Digital Biomarkers Disruption Paradigm
Alzheimer’s Disease Opportunity – Biogen Resurrects Aducanumab
TODAY
Alzheimer’s disease not Imaging expensive and often Therapies for later stage
diagnosed until symptoms not covered disease have limited
effectiveness
TOMORROW
Detect or screen in Follow on Image or Therapy delivered sooner
annual blood test blood test to diagnose with less dosing / toxicity.
Blood test monitors
progression
Aducanumab from Biogen
Quanterix Earnings Call | Q3 2019 | November 6, 2019 | 21Powering Precision Health - Summit 2019
2019 Spons
Confirmed Spons
Barcelona,
November, 19
2018 2019
Speakers 18 42
Total AttendeesQ3 2019 & YTD Sept. 2019 Financials
$m Q3 Revenue in $m GAAP Non-GAAP *
Q3 2018 Q3 2019 Q3 Q3 YTD Sept. YTD Sept. Q3 Q3 YTD Sept. YTD Sept.
+79% 2019 2018 2019 2018 2019 2018 2019 2018
Total Revenue 14.9 10.6 40.8 26.8 14.9 9.2 40.8 25.4
+82% 6.6 +39% Growth vs. PYR 41% 53% 62% 61%
4.1 4.2 Gross Profit 7.0 5.6 20.0 12.7 7.7 4.3 20.7 11.4
3.7
3.0 Gross Margin % 47.1% 52.8% 48.9% 47.6% 51.8% 46.2% 50.7% 45.0%
2.3
Operating Expenses 17.3 13.3 50.1 34.9 17.3 13.3 50.1 34.9
Loss from Operations -10.2 -7.7 -30.1 -22.1 -9.5 -9.0 -29.4 -23.4
Instruments Consumables Services
$m YTD Revenue $m Unrestricted Cash 113.3
YTD Sept. 2018 YTD Sept. 2019
+91%
72.0 +64.5
18.8 +35% -9.9
+70% +3.1 -1.9
-14.5
11.8
Depreciation, A/R driven by
10.3 Amortization, Stock Revenue
9.9 8.7 Option Expenses Growth
6.0
Cash Net Non-Cash Working Uman Follow-On Cash
06/30/19 Loss P&L Capital & Acquisition Offering (Net) 09/30/19
Instruments Consumables Services Others
* Non-GAAP item. Reconciliations are included in the Appendix to this presentation and in our Q3 2019 press release. Quanterix Earnings Call | Q3 2019 | November 6, 2019 | 23Poised to Disrupt Healthcare and Create Significant Value
Differentiator Value
Best in
1 Category-defining; Unrivaled Sensitivity / Technology Disrupt
Class
2 $3B to New
Methodical market penetration strategy to reward investors $40B Answers
market
3 DNA – RNA - Protein; Better linked to Disease / Health Holy Grail
600+ pubs
4 Validation: 19/20 top pharma, PPH, 800+ trials Proven
All Areas
Product Rapid
5 Growth & Value; Razor – razor blade, $150M invested
execution Launches Growth
6 Low Risk / Solid Return + Uber Return Prospect Retail
7 Track Record for Commercializing Disruption Lynchpin
Quanterix Earnings Call | Q3 2019 | November 6, 2019 | 24APPENDIX
Q3 2019/8 and YTD 2019/8 GAAP RESULTS

($million)             Q3 2019       Q3 2018     YonY Change
Revenue                  $14.9        $10.6          41%
Gross Profit             $7.0           $5.6
Gross Margin (%)       47.1%          52.8%       - 570 bps
Operating Expenses      $17.3          13.3
Loss from               -$10.2         -$7.7
Operations

($million)           Q3 2019 YTD   Q3 2018 YTD   YonY Change
Revenue                  $40.8        $26.8          53%
Gross Profit             $20.0        $12.7
Gross Margin (%)        48.9%         47.6%       + 130 bps
Operating                $50.1        $34.9
Expenses
Loss from              -$30.1        -$22.1
Operations

                                                               Quanterix Earnings Call | Q3 2019 | November 6, 2019 | 26
Reconciliation of non-GAAP Financials
in thousands (unaudited)
Quanterix Earnings Call | Q3 2019 | November 6, 2019 | 27You can also read