INVESTOR PRESENTATION - MAY 2021 - MANPOWERGROUP INVESTOR RELATIONS

Page created by Teresa Richardson
 
CONTINUE READING
INVESTOR PRESENTATION - MAY 2021 - MANPOWERGROUP INVESTOR RELATIONS
Investor
Presentation
May 2021
INVESTOR PRESENTATION - MAY 2021 - MANPOWERGROUP INVESTOR RELATIONS
Forward-Looking Statement

           This presentation includes forward-looking statements which are subject to known and
           unknown risks and uncertainties. Actual results might differ materially from those projected in
           the forward-looking statements. Additional information concerning factors that could cause
           actual results to materially differ from those in the forward-looking statements can be found in
           the Company’s Annual Report on Form 10-K dated December 31, 2020, as well as the risks
           and uncertainties arising from the COVID-19 global pandemic and related governmental
           actions, which information is incorporated herein by reference. Forward-looking statements
           can be identified by forward-looking words such as “expect,” “anticipate,” “intend,” “plan,”
           “may,” “will,” “believe,” “seek,” “estimate,” and similar expressions.

           Please note that ManpowerGroup’s 2020 Form 10-K is available online at www.manpowergroup.com in the section titled
           “Investor Relations.” This presentation includes constant currency growth rates, which are further explained in our 10-K.

May 2021                                                  ManpowerGroup | Investor Presentation                                        2
INVESTOR PRESENTATION - MAY 2021 - MANPOWERGROUP INVESTOR RELATIONS
Over 70 Years of Global Workforce Expertise
           Global Workforce Solutions Company                                         Providing meaningful work
                                                                                      for over 600,000 people
                          IT Staffing     Project Solutions                           everyday
     Source                Professional Recruiting
                                             Contingent Staffing
                Permanent Recruiting                                                  Connecting millions of job
                                    Leader Development                                seekers with work every year,
             Develop                   Skills Training                                globally
              Talent Assessment     Workforce Planning

                          Career Mobility End-User Services                           Finding talent solutions for
    Manage                      Managed Service Provider
                                    Recruitment Process Outsourcing
                                                                                      clients from Fortune 100 to
            Career Transition                                                         small/medium companies
                                Workforce Consulting

                 Revenues of
                                                       75                             2,200               25K
    $            $18 billion                    Countries &
                                                Territories
                                                                                Offices               Employees

May 2021                                      ManpowerGroup | Investor Presentation                                   3
INVESTOR PRESENTATION - MAY 2021 - MANPOWERGROUP INVESTOR RELATIONS
Globally Recognized Leader                                                                       The only company in our industry awarded ALM
                                                                         ALM Intelligence Intelligence’s Pacesetter designation, recognized for
                                                                                                our digitally-enabled, data-driven workforce solutions

            One of the World's Most Ethical Companies for the
                                                                                                 Earned RPO leader designation for six consecutive
            twelfth year – more than any organization in the
                                                                                                 years and TAPFIN is recognized for the fourth year
            industry​
                                                                                                 as MSP leader

            Named to FTSE4Good Index for thirteen consecutive                                   Named global RPO leader for ten consecutive years
            years                                                                               and TAPFIN is recognized as MSP leader for the
                                                                                                seven consecutive years​

            Named to the DJSI - the gold standard for
            corporate sustainability leaders for twelve
                                                                                                 Ranked 158 on the 2020 FORTUNE 500
            consecutive years

            Earned new 2020 Platinum EcoVadis sustainability
            rating, designated for the top 1% of those scored,
            with Gold rating since 2012​                                                         Ranked 1,544 on the 2020 Global 2000

            Recognized as a best place to work in the U.S. by
            the Disability Equality Index for the fifth consecutive                              Named by Forbes as one of America’s Best Staffing
            year​                                                                                Firms and Best Employers for Women in 2020

            Received a perfect score on the Corporate Equality                                   Nominated for Corporate Governance Awards
            Index for the sixth consecutive year                                                 2020 for Best Compliance and Ethics Program
                                                                                                 by Corporate Secretary

            Recognized by 2020 Women on Boards campaign                                          Recognized as a Catalyst Champions for Change
            as a Winning “W” Company since 2011                                                  among 70+ companies outpacing our global peers
                                                                                                 in advancing women, particularly women of color.
             Named by Barron's as one of the most Sustainable
           Companies overall as well as a top Employer when it                                   ManpowerGroup one of 50 organizations
           applies to Human Capital Management, Cybersecurity,                                   recognized by IDG for its security projects and
           Supply Chain Management and Well-Being                                                initiatives with the CSO50 award.
May 2021                                                ManpowerGroup | Investor Presentation                                                       4
INVESTOR PRESENTATION - MAY 2021 - MANPOWERGROUP INVESTOR RELATIONS
Forces Driving Client Priorities

                                                                      Our
                           Individual          Customer
     This time of                                                     INNOVATIVE
                              Choice           Sophistication
     CERTAIN                                                          WORKFORCE
     UNCERTAINTY                                                      SOLUTIONS
     and change                                                       provide flexibility
     REQUIRES new                                                     and agility to our
     ways of getting                           Demographics /         clients as they
                       Technological                                  face these
     work done                                 Talent
                         Revolutions                                  challenges
                                               Management

May 2021                      ManpowerGroup | Investor Presentation                         5
INVESTOR PRESENTATION - MAY 2021 - MANPOWERGROUP INVESTOR RELATIONS
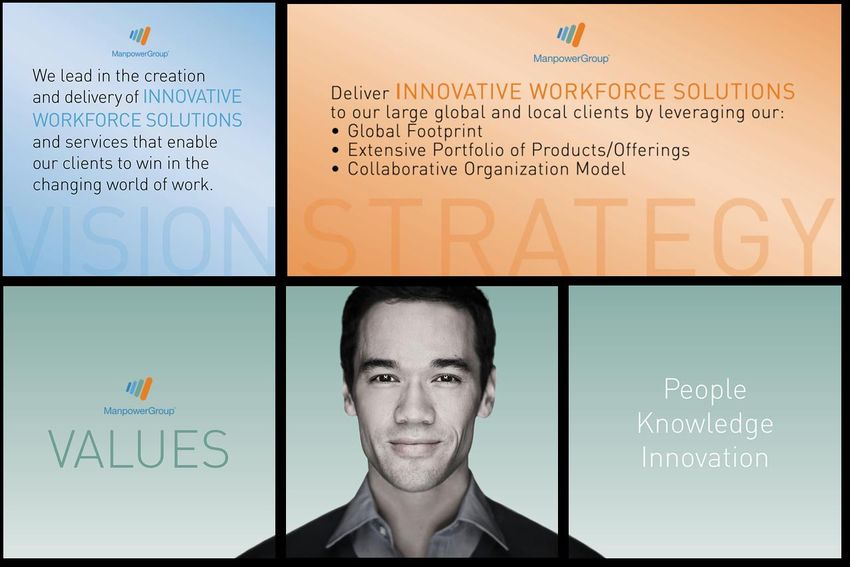
Our Vision, Strategy and Values

May 2021               ManpowerGroup | Investor Presentation   6
INVESTOR PRESENTATION - MAY 2021 - MANPOWERGROUP INVESTOR RELATIONS
Strong and Connected Brands
                                 We are a world leader in innovative workforce solutions and services,
                                 helping clients win through our family of brands and offerings.

           63% of GP
   Leverage our trusted brand,
     while driving relentless                                                  37% of GP
     efficiency / productivity          Drive higher growth and gross margin while investing more in changing our business mix

    • Targeted sales                  • Core growth in Experis IT                         • RPO, Tapfin MSP, Right Management
    • Permanent                       • Innovative talent resourcing                      • Expert workforce solutions that deliver
      recruitment growth              • Permanent recruitment growth                        performance
    • Multi-channel delivery          • Delivery excellence                               • Tailored solutions to improve the
    • Centers of recruiting                                                                 effectiveness of organizations and
      excellence                                                                            individuals

                                      Digitally-Fueled Transformation

                                    Sustainability, Mission and Values

May 2021                                          ManpowerGroup | Investor Presentation                                               7
INVESTOR PRESENTATION - MAY 2021 - MANPOWERGROUP INVESTOR RELATIONS
Shift Toward Higher Value Solutions and Services
                 2010 Gross Profit Mix                                                                  2020 Gross Profit Mix
                               Right Management
                                                                                                            Talent Solutions $0.4B
      ManpowerGroup
      Solutions

                           2010 Total
                           Gross Profit
Experis                    As Adjusted                                20%
                             $2.9B*

                                                                                 Experis $0.6B
                                                     Manpower                                                                        Manpower $1.8B

              * Amount calculated using 2020 exchange rates

                  Progressive quarterly improvement across all Brands in 2H 2020
                  Market-leading Recruitment Processing Outsourcing and Managed Service Provider offerings.
                  Experis Professional Services is predominately IT.
                  Permanent recruitment represents 14.2% of total Gross Profit in 2020.

   May 2021                                                     ManpowerGroup | Investor Presentation                                            8
INVESTOR PRESENTATION - MAY 2021 - MANPOWERGROUP INVESTOR RELATIONS
Strength Through Geographic Diversification

            2020 Segment Revenues                                                                 2020 Operating Unit Profit(1)
                    APME $2.4B
                                                                                                               APME $74.2M
                                                                    Northern Europe $24.8M

                                                    Americas $3.8B
                    13%                                                                                     14%                                Americas $151.5M
                                         21%                                                                                     29%
                                                                                                    5%
                          Total                                                                                  Total
           22%           $18.0B                                                                                $517.8M

                                        44%
                                                      Southern Europe $7.8B
                                                                                                                           52%
                                                                                                                                         Southern Europe $267.3M

           Northern Europe $4.0B

      (1) Excludes restructuring costs, the net impact of the loss from the disposition of subsidiaries and the impact of a software charge as detailed in our earnings
          release and further explained on our web site. As reported, OUP was as follows: $395.5M, Americas $116.0M (29%), Southern Europe $237.0M (60%),
          Northern Europe -$27.6M (-7%), and APME $70.1M (18%).

May 2021                                                             ManpowerGroup | Investor Presentation                                                                9
INVESTOR PRESENTATION - MAY 2021 - MANPOWERGROUP INVESTOR RELATIONS
Our Acceleration Plan – DDI

                                                                                      • Experis
  Diversification
                                                                                      • Talent Solutions
  • Accelerate growth of higher margin business in all brands
                                                                                      • Manpower Perm
  • Push for relentless efficiency and productivity across all brands                   and Convenience

  Digitization - at an accelerated pace
  • Better tools enabling deeper relationships with clients and candidates            • Global technology
  • Data assets and insight delivering new, differentiated value for stakeholders       implementations
  • Source and place more talent; predict match and performance more accurately

  Innovation - an engine for growth, progress and change                              • MyPath
  • Sustainable competitive advantage as client and candidate expectations evolve     • Assessments
  • Create new differentiation, add value and scale                                   • Data & Analytics

May 2021                                      ManpowerGroup | Investor Presentation                         10
PowerSuite

ManpowerGroup‘s integrated HR tech stack provides competitive advantage with the rapid deployment of best
in class technology together with deep and broad workforce expertise.

Predict: Help people                                                                           Connect: Superior
understand their potential and                                                         candidate experience to attract
anticipate an organization’s                                                             and source the diverse talent
workforce needs using data,                                                                          our clients need
analytics and AI

                                                                                       Manage: Manage, engage
Develop: Engage and                                                                        and motivate people while
develop people through                                                                      optimizing HR processes
personalized career
development

                       •   Optimized HR processes           •    Reduced risk
                       •   Increased efficiency             •    Accelerated speed
                       •   Decreased costs                  •    Improved client and candidate experience

  May 2021                                  ManpowerGroup | Investor Presentation                                 11
MyPath
           MyPath is building the talent pool of the future - providing people with
           career progression, developing skills for growth sectors, increasing
           earning potential through fast-track learning, on the job training and
           certification.

                                                                                       Rapid expansion in 2020

                                                                                   France    Canada    Spain
                                                                                   USA       Italy     Netherlands
                                                                                   India     Norway    Belgium
                                                                                   Mexico    UK        Japan

      •     More SKILLED talent pool for clients
      •     Higher UTILIZATION of talent
      •     Increased REASSIGNMENT rates
      •     Better MATCH, more satisfied clients and candidates
      •     Greater PRODUCTIVITY of associates and talent agents

May 2021                                   ManpowerGroup | Investor Presentation                                 12
Secular Trends Providing More Opportunity Globally
           Penetration Rates

                                                                                                                       Pre-pandemic*                          Most Recent
                                                                                                                                                              (as available)

  3.0%       3.0%          2.9%

                                     2.4%           2.3%
                                                                     1.9%                    2.0% 1.9%
                                                                                                                            1.8%
                                                                                                                                          1.6%
                                                                                                                                            Global Average 1.6%
                                                                                                                                                           0.8%

      UK     Netherlands    France    Belgium          Japan            Germany                       US                             Italy                         Spain

                                                                                     Source:
                                                                                        World Employment Confederation/CIETT and ManpowerGroup Estimates
                                                                                          Italy: Associazione Nazionale delle Agenzie per il Lavaro/World Employment Confederation
                                                                                          US: US Department of Labor
                                                                                    *Pre-pandemic: Generally represents 2019

   Previous peak penetration rates are generally exceeded in the subsequent economic cycle.
 Favorable workforce trends are expected to drive penetration rates beyond pre-pandemic levels

May 2021                                    ManpowerGroup | Investor Presentation                                                                                                    13
Emerging Market Investments Delivering Strong Returns

                                                                                                                                   • As the emerging
           Emerging Markets                                      Emerging Markets                                                    markets population
              Revenue                                             Billable Hours                                                     expands and labor
                                                                                                                                     rates equalize, we
                           Represents 13% of company revenues
                                and 44% of billable hours.                                                                           expect to see
                                                                                                                                     significant revenue
                                                                                                                                     and profitability
                                                                                                                                     growth.
                                                                                                                                   • Leading market
                      2020                                                   2020
                                                                                                   44%                               position with 250
    87%                                     13%            56%                                                                       offices across 23
                                                                                                                                     emerging markets
                                                                                                                                     generating
                                                                                                                                     revenues of $2.4B
                                                                                                                                     in 2020.

      The following countries contribute to total emerging markets: Argentina, Brazil, Chile, Colombia, Mexico, Peru, Turkey, Czech Republic, Hungary, Morocco,
      Poland, Romania, Russia, South Africa, India, Korea, Malaysia, Middle East, Philippines, Singapore, Thailand, and Vietnam.

May 2021                                                           ManpowerGroup | Investor Presentation                                                          14
Financial Update
Financial Summary
               Q1 Financial Highlights, As Adjusted(1)

                                           7%
                                                                             Revenue $4.9B
                                           1% CC

                                           10 bps                            Gross Margin 15.6%

                                            14%
                                                                              Operating Profit $98M
                                            8% CC
                                           10 bps                            OP Margin 2.0%
                                            35%
                                                                             EPS $1.11
                                            28% CC
                          (1) Excludes the impact of prior year items consisting of restructuring costs of $48.2M ($40.2 net of tax) and the impact
                              of a non-cash pension settlement expense of $10.2M ($6.3 net of tax) recorded in interest and other expenses
                              below operating profit. As reported, Operating Profit was $98M (+161%; +146% CC), Operating Margin was 2.0%
                              (+120 bps), and EPS was $1.11 (NM; NM CC)(2) .

       Throughout this presentation, the difference between reported variances and Constant Currency (CC) variances represents the impact of changes in currency on our
       financial results. Constant Currency is further explained in the Form 10-K on our web site.

May 2021                                                             ManpowerGroup | Investor Presentation                                                                16
Financial Summary
                   Q1 Revenue Growth YOY
  % of Segment                                                                                                        Average Daily
    Revenue                                                                                                        Revenue Growth - CC

                                                                      (1)

                                                                     (2)

           (1)   On an organic basis, revenue for the US decreased 1% and ADR increased 1%.
           (2)   On an organic basis revenue for Southern Europe Other increased 10% or 3% in constant currency.
May 2021                                                               ManpowerGroup | Investor Presentation                       17
Historical Trends
       Revenue

• Historical Trends
                                                                                                                             • 2020 experienced a
                                                            0                                                                  significant decline due
                                                                                                                               to Covid-19.

                                                                                                                             • We remain committed
                                                                                                                               to seizing growth
                                                                                                                               opportunities aligned
                                                                                                                               with our strategy,
           EBITA As Adjusted(*)                                                                                                improving leverage on
                                                                                                                               that growth and
                                                                                                                               building on our leading
                                                                                                                               global workforce
                                                                                                                               solutions position.

* EBITA As Adjusted for items shown on the Financial Sheet on our web site. As reported, EBITA was $215M in 2020, $675M in
2019, $832M in 2018, $824M in 2017, $722M in 2015, $546M in 2013, $448M in 2012, $563M in 2011 and ($83M) in 2010; and
EBITA% was 1.2%, 3.2%, 3.8%, 3.9%, 3.7%, 2.7%, 2.2%, 2.6%, and -0.4%, respectively.

May 2021                                                              ManpowerGroup | Investor Presentation                                      18
Balance Sheet
March 31, 2021 ($ in millions)
                Assets 9,231
               Cash                  Accounts Receivable                                 Other Assets
                                                                                                                                            Strong balance sheet
                                                                                                                                            with good liquidity to
                                                                                                                                            support future growth
              1,523                         4,889                                            2,819                                          • Net cash of $440M
                                                                                                                                            • Total debt-to-total
                Liabilities & Equity 9,231                                                                                                    capitalization at 31%

                                     Other Liabilities                   Total Debt             Equity                                      • Debt-to-EBITDA As
                                                                                                                                              Adjusted* of 2.3x
                                                                                                                                            • Untapped $600M revolver

                                          5,771                            1,083                2,377

                                                                                                                                            Focused on reducing
                                                                                                                                            capital deployed
                                                                                                                                            • Cost of accounts receivable
                                                                                                                                              included in all client
                                                                                                                                              profitability analyses and
                                                                                                                                              management incentive
                                                                                                                                              calculations

 * EBITDA As Adjusted amounts exclude the impact of global restructuring costs and other certain items further explained on our web site.
May 2021                                                               ManpowerGroup | Investor Presentation                                                          19
Free Cash Flow
($ in millions)

           Strong cash flow with counter-cyclical features provides liquidity entering into recessionary cycles.

May 2021                                         ManpowerGroup | Investor Presentation                             20
Returning Cash to Shareholders
($ in millions, except share and per share amounts)

       Dividends                                                                                                     Share Repurchases

                                                                                                                   600

                                                                                                                   500

                                                                                             Dollars in Millions
                                                                                                                   400

                                                                                                                   300

                                                                                                                   200

                                                                                                                   100

                                                                                                                            -    143        580   482   204   501   203   265   100
                                                                                                                     0
                                                                                                                         2013 2014 2015 2016 2017 2018 2019 2020 2021*
                                                                                                                         Number of Shares
                                                                                                                           --   2.0M 6.6M 6.6M 1.9M 5.7M 2.4M 3.4M 1.1M

 • Strong dividend performance. Current yield of 1.9%.**                                      • 1.1M shares repurchased in 2021; 26.6M shares (36% of
 • Annual dividends increased every year over the last 10                                       outstanding) repurchased from 2015.
   years.
                                                                                                                   *As of March 31, 2021

* Annual dividend payout per share divided by earnings per share-diluted, as
adjusted for items shown on the Financial Sheet on our web site.
** Yield based on April 27, 2021 price of $121.17

May 2021                                                                ManpowerGroup | Investor Presentation                                                                         21
Return on Invested Capital* (ROIC)

   22%
   20%
   18%
   16%
   14%
   12%
                          Estimated WACC
   10%
    8%
    6%
    4%
    2%
              6.1%         10.8%         9.4%         13.5%         15.7%         16.0%         16.7%         20.8%        19.4%         16.6%          9.8%
    0%
              2010          2011         2012          2013          2014          2015          2016         2017          2018          2019          2020

 • Capital efficiency metric, currently measured by ROIC, has been included in the executive team and global management annual
   incentive plans for over 20 years.
 • Rigorous cash management with a focus on DSO reduction.
 • Primary driver of ROIC improvement is operating profit after tax growth.

     *Defined here as operating profit after tax divided by the average monthly total of net debt (total debt less cash) and equity for the year, as adjusted
     for items shown on the Financial Sheet on our web site.

May 2021                                                           ManpowerGroup | Investor Presentation                                                        22
Financial Targets

  Revenue                                  • Exceed or maintain key market revenue growth
                      Market               • Disciplined profitable growth
  Growth                                   • Focus on improvement in client mix

                                           • Assumes stable economic environment and
                                             consistent revenue growth and pricing
    EBITA                                  • Growth driven by:
                    4.5% - 5.0%              − gross profit improvement
    Margin
                                             − continued steady efficiency/productivity
                                               enhancements

                                           • Disciplined capital allocation to achieve a return
                                             well above cost of capital
                                           • Rigorous cash management with a focus on DSO
     ROIC              15%                 • EBITA margin growth enabled
                                           • Capital efficiency metric in Executive Team and
                                             Global Management incentive plans for over 20
                                             years

May 2021                   ManpowerGroup | Investor Presentation                                  23
ManpowerGroup Strengths

                 Globally Recognized Industry Leader

                        Positive Secular Trends

                  Strong Assets, Connected Brands
                     and World-Leading Offerings

                Leading Position in Emerging Markets

                      Experienced Management

May 2021            ManpowerGroup | Investor Presentation   24
You can also read