AMYRIS, INC. INVESTOR PRESENTATION - June 2021
←
→
Page content transcription
If your browser does not render page correctly, please read the page content below
AMYRIS, INC.

INVESTOR PRESENTATION

June 2021
Investor Presentation | June 2021

         Forward-Looking Statements
         This presentation and oral statements accompanying this presentation contain forward-looking statements, and any statements other than statements of
         historical fact could be deemed to be forward-looking statements. These forward-looking statements include, among other things, statements regarding 2021
         financial guidance and outlook, goals and strategic priorities; and Amyris’s expectations regarding its development pipeline, planned product launches new
         markets and industries; and other future milestones such as pending and future strategic transactions, planned investments, expansion into other markets and
         industries, and the timing thereof. These statements are based on management’s current expectations and actual results and future events may differ
         materially due to risks and uncertainties, including risks related to Amyris’s liquidity and ability to fund operating and capital expenses, risks related to potential
         delays or failures in development, regulatory approval, production, launch and commercialization of products and brands, risks related to Amyris's reliance on
         third parties, and other risks detailed from time to time in filings Amyris makes with the Securities and Exchange Commission, including Annual Reports on
         Form 10-K, Quarterly Reports on Form 10-Q and Current Reports on Form 8-K. Amyris disclaims any obligation to update information contained in these
         forward-looking statements, whether as a result of new information, future events, or otherwise.

         NON-GAAP FINANCIAL INFORMATION
         To supplement Amyris’s financial results and guidance presented in accordance with U.S. generally accepted accounting principles (GAAP), Amyris uses non-
         GAAP financial measures that Amyris believes are helpful in understanding our financial results. These non-GAAP financial measures are among the factors
         management uses in planning and forecasting future periods. These non-GAAP financial measures also facilitate management’s internal comparisons to
         Amyris’s historical performance as well as comparisons to the operating results of other companies. Management believes these non-GAAP financial
         measures, when considered together with financial information prepared in accordance with GAAP, can enhance investors’ and analysts’ abilities to
         meaningfully compare our results from period to period, identify operating trends in our business, and track and model our financial performance. In addition,
         management believes that these non-GAAP financial measures allow for greater transparency into the indicators used by management to understand and
         evaluate Amyris’s business and make operating decisions. Non-GAAP financial information is not prepared under a comprehensive set of accounting rules, and
         therefore, should only be read in conjunction with financial information reported under GAAP in order to understand Amyris’s operating performance. A
         reconciliation of the non-GAAP financial measures in this presentation to the most directly comparable GAAP financial measure, is provided in the tables
         attached to this presentation.

         Totals in this presentation may not foot due to rounding.

© 2021 Amyris, Inc. All Rights Reserved.                                                                                                                                           | Page 2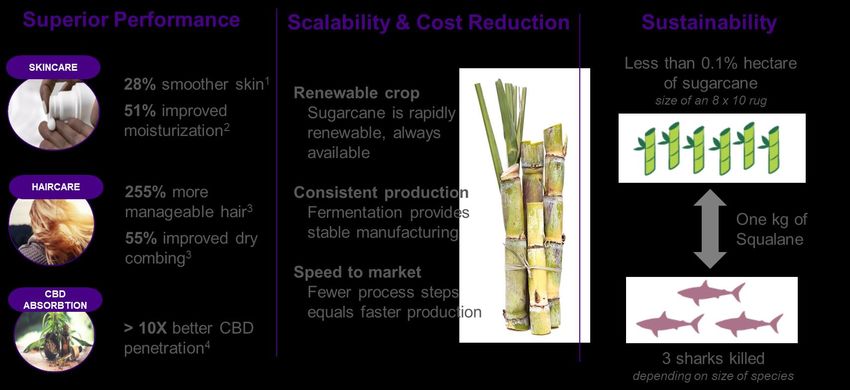
Investor Presentation | June 2021

        Agenda
                                           John Melo
                                           President and Chief Executive Officer

      1               Amyris Overview

      2               Business Model
                                           Han Kieftenbeld
                                           Chief Financial Officer

      3               2021 Outlook

      4               Q&A

© 2021 Amyris, Inc. All Rights Reserved.                                                                   | Page 3
Investor Presentation | June 2021

       Synthetic Biology is Capable of Remaking Most of the World’s Chemistry
       Global chemicals market was $4 trillion in 20191

         Intermediary chemicals                Consumers want          Synthetic Biology is            At Amyris, we               We work with partners to
         serve as building blocks           companies to replace       capable of remaking          successfully develop,            identify the market
            for most consumer                 their hydrocarbon-        most of the world’s       scale and commercialize             opportunity, drive
                 products                    based products with           chemistry                 We are a platform             adoption, and determine
         Traditionally, molecules            ones that are more           It is better for the    company that leads the            what attributes make a
            are either plant or            environmentally friendly   planet, better for people   sector with science that            real difference in
            animal-derived or                  and sustainable           and also becoming         designs solutions with                formulation
          petrochemical-based                                              better for profits         the end in mind

                                                                                                                             1Source: Statista (2021). 2019 revenue was $3.94 trillion.
                                                                                                                             Report: Total revenue of the global chemical industry from
                                                                                                                             2005 to 2019.

© 2021 Amyris, Inc. All Rights Reserved.                                                                                                                                     | Page 4
Investor Presentation | June 2021

        A Winning Business Model and Advantaged Portfolio

                                                                                                                                            *

                                                                                                                                                      *

                                                                                                           In
                                           13 ingredients in market        24 ingredients in development

                                                                                                                     *2021 launch dates are anticipated launch dates

Our proprietary Lab-to-Market                                  Our Ingredients Pipeline has                     Our Consumer Brands have
operating system has delivered                                 delivered unique, natural,                       delivered on the No Compromise®
predictable commercialization,                                 sustainably sourced, platform                    promise for health, clean beauty
significant cost reduction and fast                            molecules that disrupt markets and               and personal care products that
time-to-market                                                 enable the ESG agenda of industry                make people and our planet
                                                               leaders                                          healthier
© 2021 Amyris, Inc. All Rights Reserved.                                                                                                                          | Page 5
Investor Presentation | June 2021

      The Portfolio Connection

        A unique combination of science-based creativity, technological know-how and disruptive
        entrepreneurship

        • Our proprietary Lab-to-Market operating system delivers predictable
          commercialization, significant cost reduction and fast time-to-market

        • Our Ingredients Pipeline delivers unique natural, sustainably sourced, platform
          molecules that disrupt markets and enable the ESG agenda of industry leaders

        • Our Consumer Brands deliver on the No Compromise® promise for health, clean
          beauty and personal care products that make people and our planet healthier

© 2021 Amyris, Inc. All Rights Reserved.                                                    Page 6
                                                                                                                    | Page 6
Investor Presentation | June 2021

                                                              Automated
                                                                Strain
                                                              Engineering

                                                                                    High-
                                            Automated
                                                                                 throughput
                                             Design
  Our proprietary                                                                 screening

  Lab-to-Market operating system
  optimizes learning cycles,                                 Data capture,
                                                           machine learning,
  accelerates our time to market,                          human intelligence
  improves our predictive success
  and reduces cost                           Process
                                           development/                         Fermentation
                                           Manufacturing

                                                               Analytics

©
© 2020
  2021 Amyris,
       Amyris, Inc.
               Inc. All
                    All Rights
                        Rights Reserved.
                               Reserved.                                                                    | Page 7
Investor Presentation | June 2021

      Digitized Development Accelerates Time to Market

                                                                       >2
                   2012 vs 2020            1 strain constructed     Ingredients
                   Performance             every 42 seconds       commercialized
                                                                     per year
            90% Lower average
       product development cost

                                           100x throughput
              80% decreased                                              915 US and
                                             increase from
        average time to market                                          foreign patents
                                              automated
                                                                          issued and
                                            sample handling
             500% higher R&D                                             applications
                                               and data
                    productivity                                            pending
                                              processing

© 2021 Amyris, Inc. All Rights Reserved.                                                                          | Page 8
Investor Presentation | June 2021

      Our No Compromise® Natural Ingredients are Powering our Brands

            High growth wholly-
            owned consumer brands                                                                         Our ingredients
                                                                                                          are building
                                           Alternative Sweetener    Clean skincare   Baby & Mothercare    blocks for our
                                                PurecaneTM           Biossance®          Pipette®
                                                                                                          consumer brands
                                                                                                          formulations

            Functional natural
            ingredients delivering
            performance and
            sustainability
                                              Flavors &              Alternative     Clean Beauty for
                                            Fragrance for           Sweetener for       Cosmetics
                                              Home and             Food & Beverage
                                            Personal Care

© 2021 Amyris, Inc. All Rights Reserved.                                                                                         | Page 9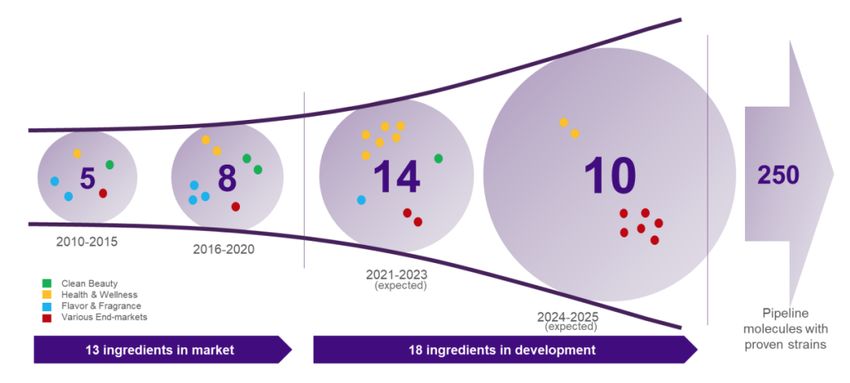
Investor Presentation | June 2021

                                           Squalane: Superior Moisturizer and Carrier
     Traditionally sourced                                                      Makes formulations perform better
     from shark liver

     Millions of sharks killed
     annually

                                           1.   After 4 weeks compared to control formulation. Clinical study performed on 30 women, ages 40-60
                                           2.   1 hour after application. Clinical study performed on 30 women ages 40-60
                                           3.   Compared to control formulation
© 2021 Amyris, Inc. All Rights Reserved.   4.   Better than Jojoba, Sunflower, CCT, and Hemp Seed Oil. Using 1% CBD EpiSkin -24 hours                                    | Page 10
Investor Presentation | June 2021
Ingredients Portfolio Growth Drivers
• Meets the No Compromise® standard: lowest cost, best performing and most sustainably
sourced
• Best Efficacy: clinically proven to be healthier for people and for the planet
• Effective solutions: formulation expertise to enable faster adoption into products
• Portfolio connection: promoting as hero ingredient in our own consumer brands
• Strategic partnerships: partnering with sector leaders in respective end-market to drive
adoption, impact and growth
© 2021 Amyris, Inc. All Rights Reserved. Page 11
| Page 11Investor Presentation | June 2021
Building Blocks: Evolving Our Ingredients Portfolio
Our Ingredients Pipeline delivers
unique natural, sustainably sourced,
platform molecules that disrupt markets 2nd Strategic Transaction
and enable the ESG agenda of industry Flavor & Fragrance
leaders Up to $500m transaction value
($150m upfront cash)
New Ingredients Plant
Barra Bonita, Brazil
Completed Completed
Q4 2020 Q2 2021
Completed 2022
Q1 2021 Expected
production
3rd Strategic Transaction
1st Strategic Transaction Reb M Sweetener
Givaudan Farnesene Up to $100m transaction value
Up to $50m transaction value ($24m upfront cash)
($40m upfront cash
© 2021 Amyris, Inc. All Rights Reserved. | Page 12Investor Presentation | June 2021
Amyris Products Target 80% of Global Beauty and Personal Care Market
Global Beauty and Personal Care
By Category
Beauty and Personal
Care Market Value
Worldwide
20% 11%
30%
Skincare
2% Clean Beauty is
Haircare
$420B
2018
$716B 4%
Color cosmetics
Bath & shower
Babycare
growing at nearly
double the rate of the
2025 Suncare
rest of beauty
10% Other
18%
16%
>7% Sources: Reuters (2019), L’Oreal (2020), Statista (2020), Forbes (2019), Euromonitor (2017), McKinsey & Company (2019).
Clean Beauty CAGR from Brandessence Market Research (2021). CAGR is for period 2018-2025
© 2021 Amyris, Inc. All Rights Reserved. Page 13
CAGR | Page 13Investor Presentation | June 2021
Soon all Beauty From Niche to Mainstream
products will be clean
Reasons consumers buy clean beauty and personal care products In the future, the "clean beauty
compared to traditional products industry" will be the "beauty
industry“
Clean Beauty will
become the Beauty "Clean" will evolve to be about
industry standard transparency and an eco-ethical
mission rather than fear-marketing
There will be more of a focus on the
power of plants, science and
fermentation
None
The growth of the beauty industry
will be accelerated by the
lengthened life expectancy and
the enormous growth of the
middle class in developing nations
Page 14
© 2021 Amyris, Inc. All Rights Reserved. | Page 14Investor Presentation | June 2021
Consumer Portfolio Growth Drivers
The Amyris Brand • New brand launches: clean color cosmetics with Rose Inc., clean haircare with
Differentiator JVN, clean skinicals with Terasana, clean luxury skincare with Costa Brazil and
clean Gen-Z health and beauty with EcoFabulous. Each of these brands are
scheduled to be launched in 2021
Leading science-to-consumer • Product line extensions: adding new and novel formulations to existing brands on
capability a monthly basis – deliver No Compromise® newness, every day
• Channel expansion: continue to expand consumer outreach in both offline (brick
High performing products and mortar) and online (ecommerce) channels – be where the consumer is at
• Geographic expansion: extending global reach in UK, Europe, Middle East, Asia
Pacific (China specifically) and Latin America – growing with the growth
Natural ingredients,
sustainably sourced $1 Importance of Beauty and Personal Care products that are clean 1 0.2 5
$1
$1 0.2
$1
$1 0.1 5
90%
$1
$0
72% 83% 71%
0.1
$0
$0
64% 56% 0.0 5
$0
$0 0
Global USA UK France Germany China
1 Source: AlixPartners Global Health and Wellness study (2018) Page 15
© 2021 Amyris, Inc. All Rights Reserved. | Page 15Investor Presentation | June 2021
Building Blocks: Evolving Our Consumer Brands Portfolio
Our Consumer Brands deliver on the No
Compromise® promise for health, clean
beauty and personal care products that Q2 2021 launch
make people and our planet healthier
Q3 2021 launch Clean luxury skincare
Clean haircare
2017 launch
Clean skincare Announced Announced Announced
October 2020 January 2021 April 2021
Announced Announced
2019 launch January 2021 March 2021
Clean baby & family care
2019 launch Q2 2021 launch
Alternative Sweetener Q3 2021 launch Acne and other treatment Q2 2021 launch
Clean color cosmetics focused skincare Gen Z
Clean cosmetics
© 2021 Amyris, Inc. All Rights Reserved. | Page 16Investor Presentation | June 2021
Record Growth and Strong Liquidity
Revenue $m
Enhanced capital structure, solidified liquidity and financial flexibility
to accelerate growth
• Continued strong revenue growth from product portfolio
• Well-positioned development pipeline to deliver new ingredients
at scale
• Completed three strategic transactions evidencing value of our
technology. Expect $270m in future earnouts and milestone Debt $m Cash $m
payments
• Reduced debt from $297m at start of 2020 to $115m at end of
235
Q1 2021 of which $60m is convertible to equity (i.e. net $55m) 297
• Cash balance as of May 6, 2021 of $235m 171
115
30
0
12/31/19 12/31/20 03/31/21 12/31/19 12/31/2020 Current
© 2021 Amyris, Inc. All Rights Reserved. | Page 17Investor Presentation | June 2021
Q1 2021 Continued Strong Sales Revenue Growth
Underlying Revenue $m
$45
Collaboration vs Consumer & Ingredients 0.2 5
Sales Revenue Q1 2021
40 $m 2021 2020 YoY%
$40
34 5 0.2 Consumer 15.7 9.1 73%
$35
33
30 3 Ingredients1 12.7 10.2 25%
$30 5
4
$25
24 0.1 5
Underlying Product1 28.4 19.3 47%
$20
5
Collaboration2 4.9 5.0 -3%
35
0.1
31
Underlying Total3
$15
26 28 33.3 24.3 37%
$10
19 0.0 5
One-off 143.6 4.8 2882%
$5
Reported Total 176.9 29.1 507%
$0 0
Q120 Q220 Q320 Q420 Q121 1 Excl one-off (Vitamin E & DSM strategic transaction)
2 Excl one-off (Vitamins in 2020)
3 Excl one-off (Vitamins & DSM strategic Transaction)
Consumer & Ingredients ($m) excl one-offs
Collaboration & Grants ($m) excl one-offs
© 2021 Amyris, Inc. All Rights Reserved. Page 18
| Page 18Investor Presentation | June 2021
Q1 2021 Key Financials
Underlying Total Gross Margin $m Adjusted EBITDA $m Debt $m Cash $m
Sales Revenue1 $m
GM% 63% 91%
+$130m
$12 0,000 0.2 5
$35 ,000
+37% 0.2 5
$18 0,000
+$142m
0.2 5
$25 0,000 0.2 5 $16 0,000
+$142m
0.2 5
$10 0,000
$16 0,000
$14 0,000
$30 ,000
0.2
0.2
0.2 $20 0,000 0.2 0.2
$14 0,000
$80 ,000
$12 0,000
$25 ,000
$12 0,000
$60 ,000
$10 0,000
0.1 5
103
0.1 5
0.1 5 $15 0,000 0.1 5 0.1 5
$20 ,000
$10 0,000
$40 ,000
-$94m
$80 ,000
33 $80 ,000
161 144
$15 ,000
0.1
0.1
$20 ,000
0.1
$10 0,000
209 0.1
$60 ,000
0.1
24 $60 ,000
$10 ,000
$0
115
$40 ,000
$40 ,000
0.0 5
0.0 5
0.0 5 $50 ,000 0.0 5 0.0 5
$5, 000
($20,0 00)
(27) $20 ,000
$20 ,000
18 3
($40,0 00) 0
$0 0
$0 0 $0 0 $0 0
Q1 2020 Q1 2021 Q1 2020 Q1 2021 Q1 2020 Q1 2021 Q1 2020 Q1 2021 Q1 2020 Q1 2021
1 Underlying total sales revenue as defined on previous page
Sales Revenue Gross Margin Adjusted EBITDA Total Debt Cash
UP UP UP DOWN UP
© 2021 Amyris, Inc. All Rights Reserved. | Page 19Investor Presentation | June 2021
2021 Full Year Outlook
• Underlying total revenue (Product, Collaboration & Grants) expected to be in the $250m range.
Reported total revenue expected to be around $400m inclusive of strategic transactions
• Continued growth combined with strategic transactions expected to result in positive full year
adjusted EBITDA
• Debt expected to be below $100m by year-end
© 2021 Amyris, Inc. All Rights Reserved. Page 20
| Page 20Investor Presentation | June 2021
We Deliver on The Promise of Synthetic Biology
• Leading Synthetic Biology platform: fast, cost-effective and
sustainable approach using innovative and disruptive chemistry
to commercialize products
• Delivering industry-leading growth: in fast-growing and
attractive Health, Beauty and Wellness markets driven by
consumer preferences for clean, safe and sustainable
• Investing in the future: balancing continued growth and
optimization of portfolio with new science-driven opportunities to
make our planet healthier
• Long-term approach to shareholder value: establishing the
foundation for profitable growth, cash delivery and self-funding
© 2021 Amyris, Inc. All Rights Reserved. | Page 21Investor Presentation | June 2021
GAAP to Non-GAAP Reconciliations
Sales Revenue Breakdown GAAP to Non-GAAP Gross Profit and Gross Margin
Three Months Ended
March 31, Three Months Ended
(In millions) 2021 2020 March 31,
Revenue: (In thousands) 2021 2020
Renewable products $ 28.2 $ 17.9 Revenue (GAAP and non-GAAP) $ 176,859 $ 29,130
Licenses and royalties $ 143.8 $ 5.2
Grants and collaborations $ 4.9 $ 6.1 Cost of products sold (GAAP) $ 22,659 $ 11,790
Total revenue $ 176.9 $ 29.1 Other costs/provisions (4,473) (1,431)
Manufacturing capacity fee adjustment (1,482) -
Inventory lower-of-cost-or-net realizable value adjustment 161 616
Three Months Ended Excess capacity (205) (66)
March 31, Stock-based compensation expense (63) -
(In millions) 2021 2020 YoY% Depreciation and amortization (514) (233)
Consumer 15.7 9.1 73% Cost of products sold (non-GAAP) $ 16,083 $ 10,676
Ingredients 12.7 10.2 25%
Product 28.4 19.3 47% Adjusted gross profit (non-GAAP) $ 160,776 $ 18,454
Collaborations & Grants 4.9 5.0 -3% Gross margin % 91% 63%
Underlying Total 33.2 24.3 37%
1
Other 143.6 4.8 2882%
Reported Total 176.9 29.1 507%
1 Incl one-off DSM transaction
© 2021 Amyris, Inc. All Rights Reserved. Page 23
| Page 23Investor Presentation | June 2021
GAAP to Non-GAAP Reconciliations
GAAP to Non-GAAP Net Income (Loss) and EPS
Three Months Ended March 31,
(In thousands, except per share data) 2021 2020
Net loss attributable to Amyris, Inc. common stockholders - Basic (GAAP) $ (289,152) $ (86,757)
Non-GAAP adjustments:
Stock-based compensation expense 4,281 3,504
GAAP to Non-GAAP Operating Expense (Gain) loss from change in fair value of derivative instruments
Loss from change in fair value of debt
22,745
326,785
(3,282)
16,503
Loss upon extinguishment of debt 27,313 27,319
Three Months Ended Income attributable to noncontrolling interest 1,200 -
March 31, Loss allocated to participating securities (2,099) (1,087)
Inventory lower-of-cost-or-net realizable value adjustment (161) (616)
(In thousands) 2021 2020 R&D Performance Agreement termination 1,850 -
Research and development expense (GAAP) $ 23,332 $ 17,126 Manufacturing capacity fee adjustment 1,482 -
Stock-based compensation expense (1,062) (1,065) Other (income) expense, net, and (gain) loss from investment in affiliate 286 411
Adjusted net income (loss) attributable to Amyris, Inc. common stockholders (non-GAAP) $ 94,530 $ (44,005)
Depreciation and amortization (1,321) (1,225)
R&D performance agreement termination (1,850) - Weighted-average shares outstanding
Research and development expense (non-GAAP) $ 19,099 $ 14,836 Weighted-average shares of common stock outstanding used in computing earnings (loss) per share attributable to
Amyris, Inc. common stockholders (non-GAAP) 267,733,555 155,065,635
Sales, general and administrative expense (GAAP) $ 37,922 $ 32,014 Loss per share attributable to Amyris, Inc. common stockholders - Basic (GAAP) $ (1.08) $ (0.56)
Stock-based compensation expense (3,156) (2,439) Non-GAAP adjustments:
Stock-based compensation expense 0.02 0.02
Depreciation and amortization (279) (261) (Gain) loss from change in fair value of derivative instruments 0.08 (0.02)
Sales, general and administrative expense (non-GAAP) $ 34,487 $ 29,314 Loss from change in fair value of debt 1.22 0.11
Loss upon extinguishment of debt 0.10 0.18
Income attributable to noncontrolling interest 0.00 -
Cash operating expense $ 53,586 $ 44,150 Loss allocated to participating securities (0.01) (0.01)
Inventory lower-of-cost-or-net realizable value adjustment (0.00) (0.00)
R&D Performance Agreement termination 0.01 -
Manufacturing capacity fee adjustment 0.01 -
Other (income) expense, net, and (gain) loss from investment in affiliate 0.00 0.00
Adjusted earnings (loss) per share attributable to Amyris, Inc. common stockholders (non-GAAP) (1) $ 0.35 $ (0.28)
(1)
Amounts may not sum due to rounding. - -
© 2021 Amyris, Inc. All Rights Reserved. Page 24
| Page 24Investor Presentation | June 2021
GAAP to Non-GAAP Reconciliations
GAAP to Non-GAAP Net Income (Loss) to EBITDA and Adjusted EBITDA
Three Months Ended March 31, Nine Mo
(In thousands) 2021 2020
Net loss attributable to Amyris, Inc. common stockholders, basic $ (289,152) $ (86,757)
Adjustment to earnings and Loss allocated to participating securities $ (2,099) $ (1,087)
Dividend to preferred stockholder on issuance and modification of common stock warrants $ - $ -
Dividend to preferred stockholders on conversion of preferred stock $ - $ -
Interest Exp, Income Tax, Depreciation/Amortization $ 5,813 $ 15,002
Income Tax $ 55 $ 91
Depreciation & Amortization $ 2,114 $ 1,719
EBITDA $ (283,269) $ (71,032)
Interest & Other income (expense), net $ 354,384 $ 44,233
Gain (loss) from change in fair value of derivative instruments $ 22,745 $ (3,282)
Income attributable to noncontrolling interest $ 1,200 $ -
Lower Cost to Market Adjustment $ (161) $ (616)
R&D Performance Agreement termination $ 1,850 $ -
Manufacturing capacity fee adjustment $ 1,482
Stock Compensation $ 4,281 $ 3,504
Adjusted EBITDA $ 102,512 $ (27,193)
© 2021 Amyris, Inc. All Rights Reserved. Page 25
| Page 25You can also read