CIBC 16th Annual Eastern Institutional Investor Conference - Le Centre Sheraton Hotel September 28, 2017

Page created by Ross Herrera
 
CONTINUE READING
CIBC 16th Annual Eastern Institutional Investor Conference - Le Centre Sheraton Hotel September 28, 2017
CIBC 16th Annual Eastern Institutional
        Investor Conference

         Le Centre Sheraton Hotel

           September 28, 2017
CIBC 16th Annual Eastern Institutional Investor Conference - Le Centre Sheraton Hotel September 28, 2017
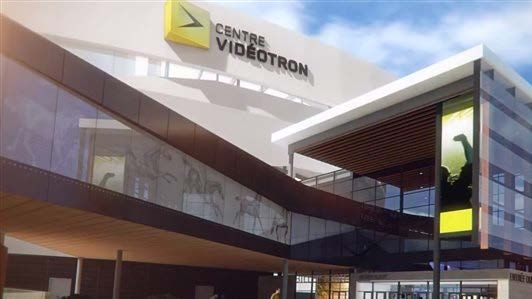
Cautionary Statements
Forward Looking Statement
This presentation contains forward-looking statements, which are subject to known and unknown risks and uncertainties that could cause Quebecor Inc.’s (“the
Company's”) actual results to differ materially from those set forth in the forward-looking statements. These risks include changes in customer demand for the
Company's products, changes in raw material and equipment costs and availability, seasonal fluctuations in customer orders, pricing actions by competitors,
and general changes in the economic environment. For additional information on such risks and uncertainties relating to the Company, you can consult
Quebecor Media Inc.’s and Videotron’s Annual Reports on Form 20F which have been filed with the SEC. Except as may be required by applicable securities
laws, we do not undertake any obligation to update any forward looking statement, whether as a result of new information, future events or otherwise.

Transition to IFRS
On January 1, 2011, Canadian GAAP, as used by publicly accountable enterprises, were fully converged to International Financial Reporting Standards (“IFRS”)
issued by the International Accounting Standards Board (“IASB”). Accordingly, the financial results for the periods ending after January 1, 2011 (and, for
comparative purposes, the financial results for the period ended December 31, 2010) presented herein were prepared in accordance with IFRS.
Results presented herein for all years up to and including the year ended December 31, 2009, were prepared in accordance with Canadian GAAP and have not
been restated to conform with IFRS. The Company is not required to restate figures for periods prior to January 1, 2010. IFRS uses a conceptual framework
similar to Canadian GAAP, but there are differences related to recognition, measurement and disclosures.
We caution you that this presentation includes financial information based on IFRS and Canadian GAAP, and that the information based on Canadian GAAP
may not be comparable to information prepared in accordance with IFRS.

Restatement of Financial Information and Customer Statistics
In 2015, the Company announced the closing of Sun News and the sale of Archambault Group’s retail operation to Renaud-Bray. In 2014, the Company sold its
Nurun subsidiary to Publicis Groupe, its Quebec weeklies to Transcontinental Inc. and its English-language newspapers and publications to Postmedia Network
Canada Corporation. In 2014, the Company also discontinued its door-to-door distribution business in Quebec. In 2013, the Company sold its specialized Web
sites Jobboom and Réseau Contact to Mediagrif Interactive Technologies. The results of operations and cash flows related to these businesses have been
reclassified as discontinued operations in the Company’s consolidated statements of income and cash flows.
For comparative purposes, unless otherwise noted, results presented herein for the periods ending after January 1, 2010 have been restated to exclude results
related to Nurun, the Quebec weeklies, the English-language newspapers and publications, the door-to-door distribution business, Jobboom, Réseau Contact,
Sun News and Archambault Group’s retail operations.

Currency
Unless otherwise noted, all amounts are expressed in Canadian dollars.

LTM Results
LTM Results presented herein are for the twelve-month period ended June 30, 2017, unless otherwise noted.

                                                                          -2-
Key Highlights
   Strong brand names with leading market positions

   Differentiated bundled product offerings

   Proven track record of managing growth and deploying new
    services

   Stable and resilient cash flow generation

   Optimal leverage for shareholders’ return

   Experienced management team

                                    -3-
Quebecor Media Inc. Overview
A Fully Integrated Telecom &
    Media Company
    (C$ in millions)

                                                       81.5%                                                     18.5%

                                                                                         LTM Revenue :           $4,077
                                                                                         LTM EBITDA :             1,543

                Media                                                     Telecommunications                                              Sports and Entertainment

  Conventional & specialty television;                            Largest cable operator in Quebec;                                Production & promotion of shows;
Newspaper, magazine & book publishing;                          Third largest cable operator in Canada;                           Management of the Videotron Center;
        Outdoor advertising;                                                                                                            Two QMJHL franchises
         Internet properties

        LTM Revenue: $930                                                  LTM Revenue:       $3,219                                      LTM Revenue:    $33
        LTM EBITDA:    72                                                  LTM EBITDA:         1,494                                      LTM EBITDA:      (8)

             Notes: Segmented revenues include inter-company revenues and segmented EBITDA excludes head office.
                    QMI owns a 68% economic interest in TVA Group.
                    Le Superclub Videotron’s results are reported in QMI’s telecommunications segment despite this entity not being owned by Videotron.

                                                                                   -5-
Increased Ownership of QMI by QI
   Recap of the 2012 agreement:
        Purchase and cancellation by Quebecor Media Inc. (“QMI”) of 20.4 million QMI shares owned by
         CDP for a price of $1 billion, payable in cash
        Purchase by Quebecor Inc. (“QI”) of 10.2 million QMI shares owned by CDP, in consideration of the
         issuance by QI to CDP of $500 million principal value of debentures convertible into QI Class B
         subordinate shares
        Granting of 2019 exit rights to CDP through, among other means, an IPO or a sale to a financial
         third party
        Increase in QI’s ownership of QMI from 54.7% to 75.4%

   September 2015 agreement:

         September 9, 2015:
        Purchase and cancellation by QMI of 7.3 million QMI shares owned by CDP for a price of $500
         million, payable in cash
        Implied QI share value of more than $36
        Increase in QI’s ownership of QMI from 75.4% to 81.1%

          July 6, 2017:
        Purchase and cancellation by QMI of 541,899 shares owned by CDP for a price of $38 million,
         payable in cash
        Increase in QI’s ownership of QMI from 81.1% to 81.5%

                                                   -6-
Financial Profile Benefiting from
       Telecom Growth
           Telecom’s growth and resilient business model strengthen the overall financial profile
              97% of Quebecor Media’s consolidated EBITDA
                                  Revenue                                                                                      EBITDA
100%                                                                                         100%                                                                           3%
90%                                                                                           90%
                                                                                       21%
80%                                                                                           80%

70%                                                                                           70%

60%                                                                                           60%
                                                                                                                                                                            97%
50%                                                                                           50%
                                                                                       79%
40%                                                                                           40%

30%                                                                                           30%

20%                                                                                           20%

10%                                                                                           10%

 0%                                                                                           0%
       2003 2004 2005 2006 2007 2008 2009 2010 2011 2012 2013 2014 2015 2016 LTM                    2003 2004 2005 2006 2007 2008 2009 2010 2011 2012 2013 2014 2015 2016 LTM
                                                                (1)                                                                                      (1)
                      Telecom                         Others                                                       Telecom                      Others

              QMI LTM Revenues = $4.1 billion                                                                QMI LTM EBITDA = $1.5 billion

             (1) Includes other segments, head office and inter-segment adjustments.

                                                                                        -7-
Media Group: Leading Market Positions
                Strong brand names with leading market positions in their respective markets
                Effective leveraging of content across multiple distribution platforms
                                                            TVA Network has a larger market share in
    Television

                                                             conventional TV than its rivals combined
                                                            Strongest market share amongst specialty
                                                             channels in Quebec
    Newspapers

                                                            JdeM and JdeQ are the #1 newspapers in
                                                             their markets
                                                            Montreal 24H attracts more than a million
                                                             readers every week
    Magazines

                                                            Top publisher of French-language
                                                             magazines in Québec

                                                            MELS is Canada’s largest provider of
                                                             services to the film and television industry
    Others

                                                            Largest number of out-of-home advertising
                                                             face in Quebec

                                                       -8-
Media Segment:
NHL Broadcasting Rights
   Twelve-year agreement with Rogers Communications for Canadian French-
    language broadcasting rights of the NHL (began with the 2015-2016)
        Provides significant upside potential
   TVA Sports establishing itself as the leading sports broadcaster in Quebec
      Significant increase in advertising revenues and fee-for-carriage
        Agreement provides for multi-platform digital rights

                                                 Financial and Operational Results

                                                       Revenue                                            Subscribers
                                                 200                                                4.0
                                                        175
                                                 175

                                                                          Millions of subscribers
                                                                                                           3.0
                                                                                                    3.0
                           Millions of dollars

                                                 150

                                                 125

                                                 100                                                2.0          1.9
                                                              82
                                                  75

                                                  50                                                1.0

                                                  25

                                                   0                                                0.0

                              Source: CRTC, for the twelve-month period ended August 31, 2016

                                                                   -9-
Sports and Entertainment Segment
   Creation of a live event-oriented segment
       Production and promotion of major cultural and sporting events
       25-year agreement to manage the Videotron Centre which opened its doors in
        September 2015 in Quebec city
          - More than 1.1 million visitors over the first year of operation
       In April 2016, Gestev became the official brand for all shows and events produced
        and/or presented by Quebecor
       Two QMJHL hockey franchises
   In June 2016, the NHL deferred QMI’s application for an expansion team

                                          - 10 -
Repositioning for Growth
   Concrete actions being carried-out to sustain growth

          Focus on Core Business                           Investment in Growth

                Sale of Spectrum outside
                         Quebec
                  $614M ($331M Gain)
                                                      IPTV           IPTV Service

                  Sale of Sun Media’s
                   English-language
                      newspapers                                     LTE Network
                         $316M

                     Sale of Nurun                                  Acquisition of
                        $125M                                         4Degrees

                Sale of Quebec Weeklies                             Acquisition of
                         $74M                                        Fibrenoire

                                           - 11 -
Investment in Growth
                                    Partnership with Comcast to develop an innovative and
                                     full IPTV service
  IPTV     IPTV Service
                                    Choice of award-winning XFINITY X1 platform to support
                                     a peerless customer experience

                                    September 2014 launch came 6 months following the
                                     addition of Apple products to Videotron’s handset lineup
           LTE Network
                                    At par with respect to network and handsets
                                    15% market share in Quebec leaves room for growth

                                    Acquisition of a 41,000-square-feet data center in
           Acquisition of            Québec City in March 2015 (later expanded to 91,000-
             4Degrees                square-feet)
                                    Official opening of a 46,000-square-feet data center in
                                     Montréal in September 2016

                                    Acquisition of a business providing fibre-optic
           Acquisition of            connectivity services in January 2016
            Fibrenoire
                                    Complementing Videotron’s B2B offering

                                    Upcoming auction of 600 MHz spectrum represents the
           Acquisition of            last allocation of low frequency spectrum (< 1GHz) for
         600 MHz spectrum            the foreseeable future

                            - 12 -
Telecommunications Segment Update
Leading Canadian
        Telecommunications Operator

      Cable TV                          Internet                    Telephony                     Mobile                  OTT Video
- 1,657K basic subs            - 1,627K cable Internet subs    - 1,221K lines as of        - 953K lines as of        - 338K subs as of
  (1,597K digital subs) as        as of June 30, 2017            June 30, 2017               June 30, 2017              June 30, 2017
  of June 30, 2017             - 57% penetration of homes      - 43% penetration of        - Network launched on     - Service launched on
- Digital penetration of         passed                          homes passed                September 9, 2010         February 23, 2013
  96% of basic subs                                            - Similar market share to   - LTE network launched on - Unlimited access to
                               - Roll out of Docsis 3.0
                                                                 legacy incumbent            September 10, 2014        largest selection of
- Superior content offering      completed
                                                               - Hybrid VoIP telephony                                 French-language movies,
  including VOD (illico)       - Current roll out of a 1 GB      service                                               series, youth shows and
- First in Canada to             service and Docsis 3.1
  release an Ultra-HD set-                                                                                             documentaries
                               - Internet service available
  top box across its service     outside our cable footprint                                                         - Production of local
  area                           through wireless                                                                      original series

                                    Strategy based on convergence of content and platforms –
                                        5.8M revenue generating units as of June 30, 2017

                                                                        - 14 -
Strong Financial Performance
                       Robust new service deployment and focus on customer service have led to solid
                        financial performance
                       Mobile telephony service expected to be a growth driver over the coming years

                      Telecommunications Segment Revenue                                                                    Telecommunications Segment EBITDA

                                                                                      $3,219                                                                                                $1,494
              3,200                                                             $3,152                              1,500                                                              $1,449
                                                                            $3,007                                                                                                 $1,386
              3,000                                                                                                 1,400                                                    $1,353
                                                                        $2,837
                                                                                                                                                                         $1,293
              2,800                                                 $2,726                                          1,300
                                                               $2,617                                                                                                $1,216
              2,600                                                                                                 1,200
                                                           $2,411                                                                                                  $1,085
              2,400                                                                                                 1,100                                     $1,036
                                                      $2,209
              2,200                                                                                                 1,000                                 $973
C$ millions

                                                                                                      C$ millions
                                                  $2,001
              2,000                                                                                                  900
                                             $1,804                                                                                                    $798
              1,800                                                                                                  800
              1,600                     $1,553                                                                       700                        $642
              1,400                $1,310                                                                            600
                                                                                                                                         $510
              1,200        $1,080                                                                                    500
                                                                                                                                    $411
              1,000     $938                                                                                         400        $364
                    $863
               800                                                                                                   300 $290
               600                                                                                                   200
                      2003 2004 2005 2006 2007 2008 2009 2010 2011 2012 2013 2014 2015 2016 LTM                             2003 2004 2005 2006 2007 2008 2009 2010 2011 2012 2013 2014 2015 2016 LTM

                                                                                                  - 15 -
Resilient Primary Service Customer Base
                                         Videotron has demonstrated greater resilience than its cable peers to telco competition
                                          and trends impacting the industry
                                                     Basic Cable Customers                                                                                                     Digital TV Customers
                                 160%                                                                                                                      700%
                                                                                                                                                                          Videotron
                                 140%                                                                                                                      600%
                                                                                                                                                                          Rogers
  Subscribers as percent of

                                                                                                                               Subscribers as percent of
                                 120%
                                                                                                                                                           500%           Shaw
                                 100%
                                                                                                                                                                          Cogeco
        base period

                                                                                                                                     base period
                                                                                                                                                           400%
                                 80%
                                                    Videotron                                                                                              300%
                                 60%
                                                    Rogers
                                                                                                                                                           200%
                                 40%                Shaw
                                 20%                Cogeco                                                                                                 100%

                                     0%                                                                                                                     0%
                                          2003 2004 2005 2006 2007 2008 2009 2010 2011 2012 2013 2014 2015 2016 Q2-17                                             2003 2004 2005 2006 2007 2008 2009 2010 2011 2012 2013 2014 2015 2016 Q2-17

                                                   Cable Internet Customers                                                                                               Primary Service Customers
                                 450%
                                                  Videotron
Subscribers as percent of base

                                                                                                                                                                         Videotron
                                 400%                                                                                                                      250%
                                                  Rogers                                                                                                                 Rogers
                                                                                                                             Subscribers as percent of
                                 350%
                                                  Shaw                                                                                                     200%
                                 300%                                                                                                                                    Shaw
                                                  Cogeco
                                                                                                                                   base period                           Cogeco
           period

                                 250%                                                                                                                      150%
                                 200%
                                 150%                                                                                                                      100%
                                 100%
                                                                                                                                                           50%
                                 50%
                                     0%                                                                                                                     0%
                                          2003 2004 2005 2006 2007 2008 2009 2010 2011 2012 2013 2014 2015 2016 Q2-17                                             2003 2004 2005 2006 2007 2008 2009 2010 2011 2012 2013 2014 2015 2016 Q2-17

                                 Source: Financial reports and management’s estimates
                                 Note: Primary Service Customers represent the total of Videotron’s basic cable, cable Internet and cable telephony customers

                                                                                                                        - 16 -
Strong Wireless Telephony Momentum
                                     Strengthening of Videotron’s offering through LTE technology, Apple devices and data-rich
                                      packages has accelerated growth
                                             Added 124K lines over the last twelve months
                                             44% of new residential customers in the quarter subscribed to monthly plans in excess
                                              of $60
                                             ARPU from new residential activations exceeded $56 in the quarter
                                             Positive impact of increased number of BYOD subscribers on profitability
                                                Robust Sub Growth                                                                                   Wireless ARPU

                              1100                                                                                     55.00                                                                        $53.32
                              1000                                                     953
                                                                                                                                                                                $52.61     $52.64
                                                                                894
Wireless Suscribers in 000s

                              900                                                                                      52.50                                                          $51.96
                                                                                                                                                                           $50.51
                                                                         769                                                                                         $49.66

                                                                                                 Wireless ARPU in C$
                              800
                                                                                                                       50.00                              $49.08 $49.23
                              700                                 633
                                                                                                                                                    $47.04
                              600                                                                                      47.50
                                                           504                                                                                $46.02
                              500                                                                                                        $45.48
                                                    404                                                                45.00       $44.14
                              400
                                             291
                              300                                                                                      42.50 $41.35
                              200
                                      95                                                                               40.00
                              100
                                0                                                                                      37.50
                                     Q3-10   2011   2012   2013   2014   2015   2016   Q2-17                                   Q2-14 Q3-14 Q4-14 Q1-15 Q2-15 Q3-15 Q4-15 Q1-16 Q2-16 Q3-16 Q4-16 Q1-17 Q2-17

                                                                                               - 17 -
Bundling Increases ARPU and
        Reduces Churn
             Strong demand for bundled offerings and a superior customer experience resulted in
              improved ARPU
                Churn rates for quadruple play customers remain more than 10 times lower than
                  for single product customers

       Total Subscriber Base – Residential Clients                                                             Net Total ARPU
100%                                                                                                                                                       $153.28
                                                                                  $150.00
90%                                                                         16%
80%
                                                                                  $125.00
70%

60%                                                                         39%
                                                                                  $100.00
50%

40%                                                                                $75.00
30%                                                                         25%
                                                                                            $46.50
20%                                                                                $50.00
10%                                                                         20%
 0%                                                                                $25.00
       2004 2005 2006 2007 2008 2009 2010 2011 2012 2013 2014 2015 2016 Q2-17               2004 2005 2006 2007 2008 2009 2010 2011 2012 2013 2014 2015 2016 Q2-17

            4 Services      3 Services     2 Services      1 Service

                                                                                - 18 -
QMI’s Financial Highlights
Exhibiting Strong and Steady Growth
                      Wireless initiative expected to be a key driver for future growth due to Videotron’s
                       operating leverage
                                LTM EBITDA impacted by approximately $50 million in customer acquisition costs

                                              QMI Revenue                                                                                      QMI EBITDA
                                                                                         $4,077                                                                                    $1,543
                                                                                                                 $1,600
                                                                                     $4,017                                                                                    $1,498
              $4,000                                                            $3,891                           $1,500                                                    $1,441
                                                                                                                                                                       $1,405
              $3,750                                                       $3,620                                                                                 $1,388
                                                                      $3,550
                                                                                                                 $1,400
                                                                                                                                                              $1,304
              $3,500                                             $3,455
                                                                                                                 $1,300
                                                             $3,268                                                                                         $1,206
              $3,250                                                                                             $1,200                                $1,184
                                                        $3,034                                                                                      $1,117

                                                                                                   C$ millioms
C$ millioms

              $3,000                                $2,841                                                       $1,100
                                              $2,794
              $2,750                                                                                             $1,000                        $951

              $2,500                      $2,425                                                                  $900
                                                                                                                                             $795
              $2,250                                                                                              $800
                                     $2,050
              $2,000                                                                                              $700
                                 $1,747                                                                                               $628
              $1,750                                                                                              $600             $561
                           $1,497                                                                                           $529
              $1,500                                                                                              $500    $444
                       $1,332
              $1,250                                                                                              $400
                       2003 2004 2005 2006 2007 2008 2009 2010 2011 2012 2013 2014 2015 2016 LTM                          20032004200520062007200820092010201120122013201420152016 LTM

                         Note:      Results from 2010 to 2014 have been restated to exclude results from discontinued operations (see slide 2 for greater detail). Results from
                                    2003 to 2009 have been adjusted downward by an amount corresponding to the restatement applicable for 2010 ($966 million in revenues
                                    and $168 million in EBITDA) to approximate results over that period excluding discontinued operations.

                                                                                               - 20 -
Cash Flow Generation
                       QMI’s intense focus on growth, cost containment and opportunistic refinancings have
                        resulted in improved EBITDA and free cash flow
                       Significant positive free cash flow despite our investment in future growth

              Telecommunications Segment (EBITDA – Capex)                                                                                             QMI Consolidated Free Cash Flow

              800                                                                                                $755                     450
                                                                                         $710
                                                                                                $660 $662 $657                            400                                                                                              $377
              700
                                                                                                                                          350                                                                  $332
              600
                                                                                                                                          300                                          $286
                                                             $486                 $469                                                                                                                                       $260
              500
C$ millions

                                                                                                                            C$ millions
                                                      $393                                                                                250                                                                         $224
              400                                                                                                                                                                                                                   $197
                                               $312                 $312                                                                  200
                                                                           $288                                                                                                 $164
              300                                                                                                                                                                                       $146
                                                                                                                                          150                            $134
                           $219
                    $185           $192 $207
              200                                                                                                                                                                             $90 $91
                                                                                                                                          100         $68
              100                                                                                                                          50   $22                $18
                                                                                                                                                            ($9)
                0                                                                                                                           0
                    2003 2004 2005 2006 2007 2008 2009 2010 2011 2012 2013 2014 2015 2016 LTM                                                   2003 2004 2005 2006 2007 2008 2009 2010 2011 2012 2013 2014 2015 2016 LTM

                           Note:      Free cash flow is defined as EBITDA, less interest expense, less cash taxes, less Capex (excluding spectrum).
                                      QMI’s results from 2010 to 2014 have been restated to exclude results from discontinued operations (see slide 2 for greater detail).
                                      QMI’s free cash flow from 2003 to 2009 has been adjusted downward by $124 million annually, such amount corresponding to the
                                      restatement applicable for 2010, to approximate results over that period excluding discontinued operations.

                                                                                                                   - 21 -
No Significant Maturities Over the
Next Few Years
                                           QMI Consolidated Debt Maturity Profile

              1,400                                                               $1,331

              1,200

              1,000
C$ millions

                                                                        $800                                        $804
               800
                                                                                               $662

               600

                                                                                                      $400
               400                                  $340                                                     $375

               200

                                $9         $4
                 0
                      2017     2018      2019       2020      2021      2022       2023        2024   2025   2026   2027

                       Notes: Excluding debt of 68%-owned TVA Group.
                              US$ debt converted at exchange rates under hedging agreements.
                              Includes drawings under revolving credit facilities.

                                                                         - 22 -
Reasonable Leverage
   Stable and reasonable leverage despite over $2 billion in investment in wireless
    and the buybacks of CDPQ’s stake for a combined consideration of $1.5 billion

                         QMI Consolidated Net Debt / EBITDA

    5.0x
                                                                            Pro forma the sale of spectrum
    4.5x   4.1x                                                             licences to Shaw

    4.0x          3.8x   3.8x
                                                       3.6x
                                                              3.4x              3.4x
    3.5x                                                             3.1x                 3.2x     3.1x
                                3.1x          3.1x
                                       2.9x
    3.0x

    2.5x                                                                                                  2.7x
    2.0x

    1.5x

    1.0x

    0.5x

    0.0x
           2006   2007   2008   2009   2010   2011     2012   2013   2014       2015     2016      LTM

                                              - 23 -
Distributions to Shareholders
   On August 9, 2017, the board of directors of Quebecor renewed its normal
    course issuer bid for a maximum of:
        500,000 class A multiple voting shares (~1.3% of class A shares), and
        2,000,000 class B subordinate voting shares (~2.4% of class B shares)
   The purchases will be made from August 15, 2017 to August 14, 2018, at
    prevailing market prices, on the open market
   As of June 30, 2017, 7.8 million class B shares had been repurchased at an
    average price of $23.26 for a total consideration of $181 million
   120% cumulative increase in the quarterly dividend since the first quarter of
    2015 (from 2.5 cents to 5.5 cents)
   Higher distributions to shareholders reflect strong projected operating
    performance and liquidity

                                           - 24 -
Appendix
Convertible Debentures:
Key Terms & Conditions
   QI issued $500M principal amount of subordinated convertible debentures in 2012

   Key terms and conditions:
            Tenor: 6 years, maturing October 15, 2018
            Interest rate: 4.125% per year
            Right to convert at maturity:
                 −   If the market value of our Class B stock is equal to or greater than $24.0625, the applicable
                     number of shares will be 20.8M Class B shares
                 −   If the market value of our Class B stock is less than $24.0625, but greater than $19.25, the
                     applicable number of shares will be equal to $500M divided by the market value of our
                     Class B stock
                 −   If the market value of our Class B stock is less than or equal to $19.25, the applicable
                     number of shares will be 26.0M Class B shares
                 −   In any case, in lieu of conversion of all or a portion of the Debentures, QI will have the right
                     to pay an amount in cash equal to the applicable number of shares multiplied by the
                     market value of our Class B stock
             Right to redeem prior to maturity (in cash or in shares)
             Holder’s right to convert prior to maturity (can be settled in cash at QI’s option)

   On July 14, 2017, QI received a notice related to the conversion of an aggregate principal amount of
    $50M of convertible debentures (10% of the original principal amount)
            QI later exercised its option to pay in cash and paid $96.0M on September 6, 2017

                                                             - 26 -
Convertible Debentures:
Illustrative Impact at Maturity                                                                          (1)

   Ownership by debenture holders of 13.4% of total number of QBR shares
    outstanding assuming QBR share price remains above $24.0625
            Cost to settle in cash at maturity of $803M if then prevailing market price of
             a share is equal to prevailing market price on June 30, 2017

             QBR Share Price at     QBR Shares     % Held by Debenture                                   Cost to Repay in
                 Maturity       Issuable upon 100% Holders upon 100%                                           Cash
                                    Conversion        Conversion (2)

               $19.25 and below                 23,376,623                       16.2%                         ≤ $450M
                      $20.00                    22,500,000                       15.7%                          $450M
                      $21.00                    21,428,571                       15.0%                          $450M
                      $22.00                    20,454,545                       14.4%                          $450M
                      $23.00                    19,565,217                       13.9%                          $450M
             $24.0625 and above                 18,701,299                       13.4%                         ≥ $450M

(1) Pro forma the settlement in cash of an aggregate principal amount of $50M of convertible debentures on September 6, 2017
(2) Based on the number of common shares outstanding of 121,133,064 as of June 30, 2017

                                                                       - 27 -
You can also read