Results Presentation For the period ended 30 June 2020 (H1 2020) - Cell C

Page created by Marilyn Glover
 
CONTINUE READING
Results Presentation For the period ended 30 June 2020 (H1 2020) - Cell C
Results
Presentation
For the period ended 30 June 2020 (H1 2020)

                     Cell C’s Turnaround
                     Strategy yields results
Results Presentation For the period ended 30 June 2020 (H1 2020) - Cell C
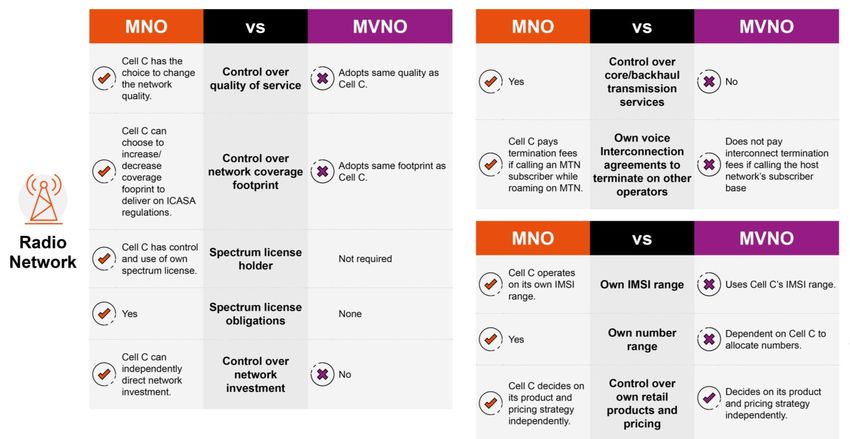
Cell C Interim Results

                      Call Presenters

Douglas Craigie Stevenson                         Zaf Mahomed
    Chief Executive Officer                     Chief Financial Officer

       3 years in company                          2 years in company
      20+ years in industry                       20+ years in industry
Results Presentation For the period ended 30 June 2020 (H1 2020) - Cell C
Agenda
1   Strategic Update

2   Operational Update

3   Evolution of the Telecoms Value Chain

4   Financial Results (for HY 30 June 2020)

5   Highlights

6   Balance Sheet

7   The Way Forward

8   Questions
Results Presentation For the period ended 30 June 2020 (H1 2020) - Cell C
Strategic Update

Interim Results Presentation   4
Results Presentation For the period ended 30 June 2020 (H1 2020) - Cell C
The big shifts
              shaping our
              performance

              Focused turnaround strategy

              Overall impact of the strategic focus
              is evident in this set of results as new
              management team continues to
              drive positive change.

Interim Results Presentation   5
Results Presentation For the period ended 30 June 2020 (H1 2020) - Cell C
1                                 2                                     3                                       4
               Liquidity Focus                     Network strategy              Operational Rationalisation                     Recapitalisation

     •   Liquidity platform is in place.                                         •   Significant cost efficiency
                                                                                                                          •   Complex restructure.
                                           •   Actively driving ‘The Age of          programme to optimise and
     •   Strict liquidity protocols            Resource sharing’. Evolution          right-size the cost base.
                                                                                                                          •   Multiple stakeholders.
         overseen by independent               of business from the capex
         3rd party.                            intensive, infrastructure-        •   Nearing completion of
                                                                                                                          •   Good progress.
                                               based network to an                   restructure process.
     •   Informal debt standstill,             aggregator of infrastructure.
                                                                                                                          •   Final step will be term
         current terms on hold while                                             •   Change in operating model -
                                                                                                                              sheets.
         debt is restructured as part      •   Successfully concluded                focused investment,
         of recapitalisation.                  Phase 2 MTN roaming                   partnering and a buyer of
                                               agreement.                            services, instead of build, buy
     •   Continue to operate despite                                                 and run everything.
         facing significant liquidity      •   Commenced implementation
         constraints.                          1 May 2020. 36-month              •   A shift in KPI’s aligned to
                                               transition from Jan 2021              business model.

               Complete
                Ongoing                             Complete                              Ongoing                               In Progress

         CELL C OF THE FUTURE                          Lean         Agile      Flexible           Responsive           Accountable       Resilient

Interim Results Presentation   6
Results Presentation For the period ended 30 June 2020 (H1 2020) - Cell C
Spectrum auction
      An interested party under the right conditions

                        1                      2                            3                            4
             The initial costs of    A catalyst for the industry       As part of Cell C’s       Digital technologies can
            spectrum through an          and to stimulate             network strategy it        enhance lives, improve
           auction must not be a        economic growth.           considers high demand        education, drive financial
          barrier to the end game.                                    spectrum a critical      inclusion and drive access
                                                                    resource in addition to   to trade and public services,
                                                                   other spectrum bands for     it is a great enabler for
                                                                   the provision of bundled           South Africa.
                                                                      data services in the
                                                                          digital era.

Interim Results Presentation   7
Results Presentation For the period ended 30 June 2020 (H1 2020) - Cell C
Cell C is an MNO not a super MVNO

      R Results
Interim e s u l Presentation
                t s P r e s e 8n t a t i o n
Results Presentation For the period ended 30 June 2020 (H1 2020) - Cell C
30%     Lower retail footfall

        The way people
                                                      Increase in online activity
        live, work and                        18.4%   •    26.7% increase on app

        shop is changing                                   8.41% increase on website

         Redesigning our Retail Model
                                                      A Hybrid Approach
                                                +
                                                       •   Combine digital, physical stores
                                                           and retail partnerships.

        Coupled with new operating model
        we are reshaping our retail
        footprint and consumer touchpoints.           Phased store closures
                                                       •   Over 18 months as leases expire and/or
                                                           are taken over by third parties

Interim Results Presentation   9
Results Presentation For the period ended 30 June 2020 (H1 2020) - Cell C
Operational
                                   Update

Interim Results Presentation 10
Macro-economic factors
                                  impacting consumer spend
                                   •   Contraction of GDP
                                   •   Unemployment at all time high
                                   •   Volatile exchange rate
                                   •   Recession
       Market dynamics
       affecting                  Competitive environment
       operational                 •   Evolving telecoms value chain
       performance                 •   Margins eroded due to price strategies
                                   •   Spectrum allocation – future auction

                                  Black swan event
                                   •   COVID-19 impacts (and opportunities!)
                                   •   Need to be resilient, agile and flexible

Interim Results Presentation 11
Covid-19 Impact                                     We noticed a larger volume of prepaid
                                                         churn due to COVID 19. This has
                                                         normalised in Level 1.

                                  Upswing in adoption               Recharges contracted and
                                  of digital platforms              bundle purchased increased
                                                                    this resulted in higher revenue
                                                                    for the period.
    As consumers stayed home, we
    noticed a considerable increase
    in traffic on our network
                                                                                    Contract churn
                                                                                    wasn’t affected and
                                                                                    in fact lessened in the
      Data volumes +25%                                                             months of March, April
      Outgoing voice calls +18%                                                     and May.

Interim Results Presentation 12
Evolution of
                                  the Telecoms
                                   Value Chain
                                  Understanding the shifts
                                   in our financial results

Interim Results Presentation 13
A fragmenting telecoms value chain

      Regulations                  Licences        Technology        New Services    Competition      Specialisation
       The rise of                The emergence   The emergence of   The emergence       Rise of      Rise of fragmented
     mobile operators                 of fixed    mobile broadband       of OTT      infrastructure     telecoms value
                                    broadband                          providers       companies             chain

            1990’s                   2000’s          Mid 2000s         Late 2000s      +/-2015             2020’s

Interim Results Presentation 14                                                                         Source: Africa Analysis
Challenging the industry measurement paradigms

                              The Telco of the Past                   Cell C has a strategy

                    1                Network focused                   This set of results reflects
                                                                             the transition.
                         A shift in metrics and understanding of
                                relevance to new models.
                                                                         Future results will be
                                  The future must reflect value.      measured on the new model.

                    2             KPI’s have a life cycle
                                  # of subscribers vs profitability
                                          Capex vs ROI
                                             Margins

Interim Results Presentation 15
Financial
                                     Results
                                  For the period ended
                                     30 June 2020

Interim Results Presentation 16
Expenditure once off – R5.5bn
                                                         • Restructuring costs / retrenchments of
                                                           R64.2m as at 30 June 2020 (still ongoing)
                                                         • Recapitalisation costs - R100.9m as at
                                              Once         30 June 2020 (still ongoing)
                                                         • Impairment – R5.0bn
                                               off       • Network Site Restoration – R247.6m

                                               Items
  Rand weakened from R14.04
                                            impacting
  (June ‘19) to R17.36 (Jun ‘20).
      This has resulted in Forex
                                             reporting
    loss of R1.3bn in June 2020
       in comparison to a loss of   Rand      results
         R0.2m as at June 2019.
                                    value                IFRS
                          R1.3bn                                          Cell C Implemented IFRS 15
                                                                          and 16 as at 1 January
                                                                          2019, therefore these
                                                                          standards are included in
                                                                          both H1 2019 and 2020.

Interim Results Presentation 17
Key performance indicators
      H1 2020

                             -6%                             -12%                                     -2%
                  vs H1 2019 Service Revenue                vs H1 2019 EBITDA                  Gross Margin Increase
                     R6.5 Billion                        R1.3 Billion

        Service revenue decreased by 6% due       Decreased EBITDA is a result of the         Margins are stabilising.
         to the change in company strategy to   once-off restructuring and recapitalisation
             focus on profitable customers.         costs. Operational Rationalisation
                                                   resulted in a 13% saving in Direct
                                                 Expenditure as compared to H1 2019.
Interim Results Presentation 18
Key performance indicators - Normalised
      H1 2020

                             -6%                              64%                               11.5%
                  vs H1 2019 Service Revenue              vs H1 2019 EBITDA                  Gross Margin Increase
                     R6.5 Billion                       R1.8 Billion

        Service revenue decreased by 6% due      Improvement in normalised earnings,        Margins are stabilising.
         to the change in company strategy to     EBITDA adjusted based on once-off
             focus on profitable customers.     restructuring and recapitalisation costs.

Interim Results Presentation 19
2020 Results Half Year                                                 Notes & Comments
      Summary of reported financial information
                                                                             •   Excluding once-off recapitalisation and
                                                                                 restructure costs, EBIT for H1 2020
         R’m                               H1 2020   H1 2019   % change
                                                                                 would have been at R162-million, an
                                                                                 improvement of 80%.
         Service revenue                    6 542     6 972          -6%
                                                                             •   Generated R418-million more cash
         Non-Service revenue                  378      523           -28%        from operations compared to the
                                                                                 previous period.
         Total revenue                     6 920      7 495          -8%
                                                                             •   An annual impairment assessment
         Gross margin                       3 466     3 538          -2%         was performed and this resulted in an
                                                                                 impairment of R5.0bn.
         Gross margin %                      50%       47%            3%
                                                                             •   Current year net loss after tax
         EBITDA                             1 258     1 434          -12%        excluding the impact of impairment
                                                                                 totals a loss of R2.5bn
         EBITDA margin %                     18%       19%            -1%
                                                                                 Impact of roaming on EBITDA
          Cash EBITDA                          511       93          450%                        (ZAR mln)
                                                                                                                      2 750
          Depreciation, Amortisation       (6 512)   (1 344)        >-100%                                    2 384
          & Impairment
              Depreciation, Amortisation                                           1 258 1 434
                                            1 418      1 249         -14%
              Impairment                    5 092         94       >-100%

         Net loss after tax                (7 598)    (875)         >-100%
                                                                                 Incl Roaming                Excl Roaming

Interim Results Presentation 20                                                            H1 2020      H1 2019
Highlights from H1 2020
      Impact of the turnaround strategy

                         18%          18%           13%                  8%

              MVNO Revenue          Increase in      Direct        Management of
                   Increase        Overall ARPU    Expenditure   capacity purchase
             Strong performance   compared to H1    decrease      due to maintaining
               in this segment         2019                      profitable customers

Interim Results Presentation 21
Revenue
                                     Story
                                  Maintained revenue
                                  while right-sizing the
                                    customer base

Interim Results Presentation 22
Revenue by subscriber type
       Segment (R’m)                            H1 2020                  H1 2019                 % change
                                                                                                                    Notes & Comments
                                                                                                                    Increase in other is due to 80mln roaming revenue
       Prepaid*                                  3 123                      3 468                           -10%    incurred in the current year from MTN phase 2

       Contract*                                  1 805                     1 814                           -1%
                                                                                                                                              5%
                                                                                                                                        7%
       Broadband*                                    383                      481                           -20%
                                                                                                                                   6%

       Mobile revenue                             5 311                     5 763                           -8%                   5%         H1 2020       45%
                                                                                                                                 6%          Subscriber
       Other^                                        321                      231                           38%                               Revenue

       Wholesale                                                                                                                        26%
                                                     422                       452                           -7%
           MVNO                                       399                       338                           18%
           BSP                                         23                       114                          -80%

                                                                                                                                              7%
       Incoming                                      489                      526                           -7%                         7%
                                                                                                                                   6%
       Net Service revenue                       6 542                      6 972                           -6%
                                                                                                                                  3%         H1 2019       46%
       Equipment                                     378                      523                           -28%                  7%          Subscriber
                                                                                                                                               Revenue

       Total Revenue                              6 920                     7 495                           -8%
                                                                                                                                        24%

 •   Segments of mobile revenue are net of volume discounts.
 •   ^ Other revenue is made up of FTTH, other bulk SMS, Content, Roaming revenue and Financial services.

Interim Results Presentation 23
Unpacking our Subscribers
       Other key performance indicators                               Notes & Comments
        Thousand                   H1 2020    H1 2019     % change    •   Prepaid base decreased by 35%.
                                                                          However, annualised ARPU increased
        A3 prepaid base              8 350     12 782         -35%        27%. Our strategy is focusing on profitable
                                                                          subscribers rather than subscriber base.
        Contract base                 968       1 131         -14%    •   Contract base decreased by 14% whilst
            Postpaid Base             255         362         - 30%
            Hybrid Base
                                                                          ARPU has increased by 9%.
                                      713         769           -7%

                                                                      •   Broadband decreased 19% whilst ARPU
        Broadband base               335         412          -19%        has decreased by 9%.

         Wholesale^                 2 066       1 939           7%    •   Wholesale base increased by 7%. This is
                                                                          mainly due to the focus of reducing prices
       Total Subscribers            11 719     16 265         -28%        to remain competitive and attract more
                                                                          customers.

          YTD ARPU ‘R               H1 2020     H1 2019   % change

            Prepaid                  66          52             27%

           Contract                  303        277             9%

            Broadband                178         196            -9%

^ - MVNO and BSP base.

 Interim Results Presentation 24
The SIM card washing machine
      An analogy for the relentless chasing of subscribers for no value   Notes & Comments

                                                                          • Cell C’s strategy has been
                                                                            to rationalise its subscriber
                                                                            base and retain profitable
                                                                            customers.
                 Prepaid customer base
                                                                          •   # of SIMS in market is not a true
                 decreased by 34.7% YoY.
                                                                              measure of core subscribers.

                  ARPU increased by                                       •   A SIM connection is not a
                  45% YoY.                          Core                      sustainable and profitable
                                                 subscribers                  customer.
                  Gross margin for prepaid                                •   The cost of acquisition is
                  increased by 5% YoY.                                        ineffective and drives bad
                                                                              distribution behaviour.
                  Direct costs decreased
                  by 16.3% YoY.

Interim Results Presentation 25
A focus on profitable customers
                                     Subscriber Base Growth                                                            Voice Traffic

                                             Prepaid     Contract                                    4 000

                         20          1,6                 1,7

                                                                                          Millions
          Millions

                         15
                                                                      1,4
                         10                                                                                                             3 215
                                                                                                               3 126           2 939
                          5          13,1               12,8
                                                                      8,4
                          0                                                                          2 000
                                 H12018                H12019        H12020                                   H12018          H12019    H12020

                                                ASPU                                                                  Data Traffic

                                            Prepaid      Contract                        120 000
                                                                                         100 000
          400

                                                                              Millions
                                                                                          80 000
          300                                                                             60 000                              110 975     98 708
          200                                                        241                  40 000
                               208                     206                                                   62 871
          100                                                                             20 000
                     0          52                  49                71                             0
                              H12018              H12019            H12020                                   H12018            H12019     H12020

                                                                              Note: There was an increase in Data Traffic due to Covid,
                                                                              however when comparing YOY the reduction of 28% in total
                                                                              subscribers must be taken into account.
Interim Results Presentation 28
Optimising network traffic to
      improve profitability                                                                                                                                                                                                Notes & Comments

                                                                                                                                                                                                                           •   The trend line is flat over period
                                                  Service Revenue vs Data Usage                                                                                                                                                and in line with industry trends.

                                                                                                                                                                                                                           •   Data Traffic reduced during the
                                                                                                                                                                                                                               period. Data usage reduced by
                                                                                                                                                                                                                               11% YOY as at end June 2020.

                                                                                                                                                                                                                           •   There was an increase in data
                                                                                                                                                                                                                               usage in Q2 2020 as a result of

                                                                                                                                                                                                         SERVICE REVENUE
                                                                                                                                                                                                                               the COVID pandemic.
       DATA USAGE

                                                                                                                                                                                                                           •   The lower revenue in April was
                                                                                                                                                                                                                               specifically due to reduced gross
                                                                                                                                                                                                                               additions as distribution channels
                                                                                                                                                                                                                               were impacted as a result of
                                                                                                                                                                                                                               lockdown restrictions.
                                                                          Jul-19

                                                                                                                                                                                       Jul-20
                                               Apr-19
                                                        May-19
                                                                 Jun-19

                                                                                                               Nov-19

                                                                                                                                                            Apr-20
                                                                                                                                                                     May-20
                                                                                                                                                                              Jun-20
                                                                                   Aug-19

                                                                                                                                                                                                Aug-20
                    Jan-19
                             Feb-19
                                      Mar-19

                                                                                            Sep-19

                                                                                                                        Dec-19
                                                                                                                                 Jan-20
                                                                                                                                          Feb-20
                                                                                                                                                   Mar-20
                                                                                                     Oct-19

                                                                                   Data (GB)                  Service Revenue

•   ^ Data in GPRS

Interim Results Presentation 27
Evolution of the customer base in
       pursuit of profitability                                                                                                                                                                                                      Notes & Comments

                                                                                                                                                                                                                                     •   We have been actively pursuing
                                                       Service Revenue vs Total Subscribers                                                                                                                                              more profitable customers.

                                                                                                                                                                                                                                     •   Despite a reduction in the Cell C
                                                                                                                                                                                                                                         customer base, we have maintained
        Million                                                                             2019                                         2018                                 % change
                                                                                                                                                                                                                                         and seen a slight increase in
                                                                                                                                                                                                                                         revenue based on the trend line.

                                                                                                                                                                                                                                     •   For the reporting period there was a
        TOTAL SUBSCRIBERS

                                                                                                                                                                                                                   SERVICE REVENUE
                                                                                                                                                                                                                                         28% reduction in the customer base
                                                                                                                                                                                                                                         YOY but only 7% impact on
                                                                                                                                                                                                                                         revenue.
                                                                                  Jul-19

                                                                                                                                                                                                 Jul-20
                                                       Apr-19
                                                                May-19
                                                                         Jun-19

                                                                                                                                                                                        Jun-20
                                                                                                                      Nov-19

                                                                                                                                                                     Apr-20
                                                                                                                                                                               May-20
                                                                                           Aug-19

                                                                                                                                                                                                          Aug-20
                            Jan-19
                                     Feb-19
                                              Mar-19

                                                                                                    Sep-19

                                                                                                                                Dec-19
                                                                                                                                          Jan-20
                                                                                                                                                   Feb-20
                                                                                                                                                            Mar-20
                                                                                                             Oct-19

                                                                                  Total Subscribers                            Service Revenue

- Customer base excludes FTTH subscriber bases.

 Interim Results Presentation 28
Robust Wholesale Model
                                                                                                                                                                                                                                       Notes & Comments

                                                                                                                                                                                                                                       •   Wholesale revenue contributed 7% of
                                    Wholesale Revenue vs Wholesale Subscribers                                                                                                                                                             the total service revenue in H1 2020.

                                                                                                                                                                                                                                       •   The value proposition proposed by
                                                                                                                                                                                                                                           new MVNOs is creating new demand
                                                                                                                                                                                                                                           for subscribers. This has resulted in
                                                                                                                                                                                                                                           an increase in subscribers as
                                                                                                                                                                                                                                           indicated in the graph.

                                                                                                                                                                                                               WHOLESALE SUBSCRIBERS
       WHOLESALE REVENUE

                                                                                 Jul-19

                                                                                                                                                                                             Jul-20
                                                      Apr-19
                                                               May-19
                                                                        Jun-19

                                                                                                                     Nov-19

                                                                                                                                                                  Apr-20
                                                                                                                                                                           May-20
                                                                                                                                                                                    Jun-20
                           Jan-19
                                    Feb-19
                                             Mar-19

                                                                                                                                       Jan-20
                                                                                          Aug-19
                                                                                                   Sep-19

                                                                                                                              Dec-19

                                                                                                                                                Feb-20
                                                                                                                                                         Mar-20

                                                                                                                                                                                                      Aug-20
                                                                                                            Oct-19

                                                                         Wholesale Subscribers                                Wholesale Revenue

Interim Results Presentation 29
Expenditure
                                       story
                                     Direct expenses were
                                  13% lower when comparing
                                      H1 2020 vs H1 2019,
                                    right sizing the operator
                                        for future growth.

Interim Results Presentation 30
Operational expenditure

          R’m                                 H1 2020                    H1 2019                 %change

                                                                                                                                               3%
      Direct expenditure                       (3 454)                   (3 957)                      13%                                                  14%
                                                                                                                                 22%
          Network Expenses                     (730)                      (440)                       -66%

          Commercial Expenses                   (317)                      (597)                          47%                                H1 2020
                                                                                                                            1%                 Direct
                                                                                                                            5%               Expenditure
          Administrative Expenses              (1 186)                   (1 203)                          1%
                                                                                                                             2%                                        35%
          Depreciation, Amortisation
                                              (6 512)                    (1 344)                   >-100%
          & Impairment                                                                                                              15%
                                                                                                                                                 3%

            R’m                                  H1 2020               H1 2019

                                                                                                                Termination Costs                          Roaming Costs
          Capital expenditure                      109                   236                                    Purchase of Retail Content                 Other Mobile Services Costs
                                                                                                                On-Going Commissions and Discounts         Prepaid SAC and SRC *
                                                                                                                Bad Debts                                  Other
      Capital expenditure
      •    Capital expenditure is lower than 2019 due to the prioritisation of the turnaround strategy.         Handset and Sims                           Wholesale Cost
      •    Expansionary capex ceased due to the MTN roaming agreement and current liquidity
           pressures..

19Interim Results Presentation 31
Balance sheet
                                      story

Interim Results Presentation 32
Balance sheet
                                                                                 Notes & Comments
           R’m                                 H1 2020    H1 2019    % change
                                                                                 •   Decrease in assets is
                                                                                     attributed to the impairment
          Fixed Assets                           2 055     12 452         -83%       of assets in the current year.

          Intangible assets                        224      1 202         -81%   •   Weakening of the rand has
                                                                                     resulted in higher FX losses
          Trade receivables and other assets     5 405      4 610         17%        that contributed to the
                                                                                     increase in borrowings. Rand
          Total assets                           7 684     18 264         -58%       weakened from R14.04
                                                                                     (June ‘19) to R17.36 (Jun
          Loans and borrowings                   9 716      8 754         11%        ‘20)

          Other liabilities and provisions       9 199      7 857         17%    •   The reduction in lease
                                                                                     liabilities is due to
          Lease obligations                      4 321      6 395         -32%       implementation of MTN
                                                                                     Phase 2.
          Total Liabilities                     23 236     23 006          1%

          Net equity                           (15 552)    (4 742)      >-100%

Interim Results Presentation 33
Analysis of debt and finance cost
                                                                                                                              Notes & Comments
               Description                          Debt                      Interest                        F-X

                                          H1 2020     |    H1 2019   H1 2020      |      H1 2019   H1 2020     |    H1 2019   •   The cost of funding remains
                                                                                                                                  excessively high.

    Short term debt                        9 716           8 754        477               458         1 162          -46      •   Debt has not increased from
                                                                                                                                  2019. No additional debt or
    Finance leases                          4 321          6 395        358               402          -              -
                                                                                                                                  drawdowns since 2019. The
                                                                                                                                  increase in debt is du to
                                                                                                                                  interest and FX incurred on the
    Other finance costs                      -               -          172               133         180             46          loan.
    - Other finance costs                    -               -          35                 67          -              -

    - Discounting future cash flows           -              -           -                 39          -              -
                                                                                                                              •   Handset financing liability
                                                                                                                                  decreased due to not acquiring
    - Working capital                         -              -           -                 -          180            14
                                                                                                                                  customers at any cost.
    - Derivatives                             -              -           -                 -           -             32
    - Other interest                         -               -          137                27          -                  -

    Cash / interest income                  -159            -345         -4                -26         -              -

    Net debt excl. leases (net of cash)     9 557          8 409        645                566       1 342                -
    Net debt incl. leases (net of cash)    13 878          14 804      1 003               967       1 342                -

    Handset finance (off balance sheet)    1 666           1 868        77                110          -              -

Interim Results Presentation 34
Breakdown of short-term debt
                                                                          H1 2020   |   H1 2019

                    Description                                             Principal Debt

          Listed Bonds                                                      3 493        2 611

          CDB                                                               2 487        1 897

          ICBC                                         Unchanged in ZAR     1 171        1 047

          Nedbank                                      Unchanged in ZAR      906          798

          DBSA                                         Unchanged in ZAR      217          190

          RMB/ABSA                                     Unchanged in ZAR      902         1 176

          Capitalised Finance Costs                                          -6           -19

          ZTE Bridge Vendor                                                  192          147

          Subsidy                                                            354          907

                                                              Total         9 716        8 754

USD/ZAR closing exchange rate of R17.36 as at 30 June 2020.

 Interim Results Presentation 35
The Way Forward

Interim Results Presentation 36
The Cell C of the Future
       From build, own and run everything ourselves to focused investment, partnering and a buyer of services

                                                                                        OUR FOCUS

                                                                                                         Focused product &                                  Superior customer
       Network strategy                                Platform-based solutions
                                                                                                          services offering                                    experience
     Scalable and cost efficient                            Overlay quality services
                                                                                                       Leverage adjacent technologies                      Embed customer proximity

                                                                      OUR POSITIONING

                                                             A digital solutions provider                                                                      Positioning of new,
 Redefined positioning on the
                                                                                                                                                         non-traditional digital offerings
back of technology convergence                             that leverages its telco platform                                                                      beyond telco

                                                                 An innovative Disrupter

                                   Differentiate on providing innovative                  HOW W E
                                                                                                                    A customer first service provider
                                   digital solutions on a scalable quality             DIFFERENTIATE                championing digital inclusion that
                                                telco platform                           OURSELVES                          enhances lives

 CELL C OF THE FUTURE                                           Lean
                                                                Lean                 Agile
                                                                                  Agile        Flexible Responsive
                                                                                                             Responsive                        Accountable                 Resilient
Continue to build a strong and
                                                relevant brand

     Proudly South                    Product          Launched the         Renewed          The CellCgirl        Supporting Data       Launched our
    African company               innovation built        Innovation       Cell C Sharks    online portal is      Scientists of the   Summer Campaign
        achieved                    on consumer       Challenge in 2019    sponsorship        growing and              future            ‘Change your
    Level 2 BBBEE                 insights and the      to partner with                        Take A Girl                             Summer, Change
         status                      best value      SME’s. 2020 entries                     Child to Work                                your World’
                                      bundles.         currently being                     is in its 18th year.
                                                           evaluated

Interim Results Presentation 38
Immediate priorities

         Successfully                    Leverage the           Manage costs tightly
                                                                                        Enable digitisation to          Finalise
        conclude the              recapitalisation quickly by    in the face of tough
                                                                                        benefit our customers    collaborations and
      recapitalisation.             allocating capital and      economic conditions.
                                                                                           and employees,         partnerships and
                                   liquidity prudently and
                                                                                         including reskilling.        launch new
                                  driving change internally.
                                                                                                                     propositions.

Interim Results Presentation 39
Questions?
You can also read