Chapter 3: Results - Shodhganga
←
→
Page content transcription
If your browser does not render page correctly, please read the page content below
Chapter 3:
Results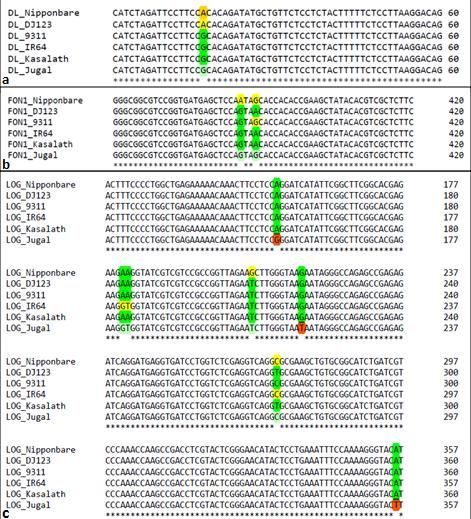
Chapter 3: Results

3.1. Morphological study of flowers

3.1. 1. Microscopic study

The microscopic observation of dissected matured flowers showed no structural differences
in first three whorls. All flowers of the two investigated rice lines have one lemma, one palea,
two lodicules, and six stamens at first, second and third whorls respectively (Table 5).
However, a significant alteration observed in the fourth whorl; when the normal rice (IR36)
flowers possess a single carpel, majority of the mutant rice (Jugal) flowers bear more than
one carpel. Carpels of both Jugal and IR36 flowers are presented on Figure 6. Figure 6a
shows a dissected mature Jugal flower which possesses three carpels, whereas, Figure 6b
shows a mature dissected IR36 flower having a single carpel. The Table 6 represents the
number of flowers with their carpel numbers; among the 200 IR36 flowers that were
investigated, all flowers have single carpels. Whereas, in case of Jugal, only 58 flowers
among the 200 investigated flowers have single carpels; the remaining flowers bear more
than one carpels. Interestingly, Jugal flowers with more than one carpels, showed presence of
two, three even in some cases four carpels also. Among the 200 Jugal flowers investigated,
89 flowers found to have two carpels. Similarly, the number of Jugal flowers with three
carpels and four carpels were 46 and 7 respectively among the 200 investigated Jugal
flowers.

Table 5. Number of floral organs in Jugal and IR36 flowers

                   Flower Lemma Palea Lodicules               Pistil   Carpel

                    Jugal        1        1          2          6       1-4

                    IR36         1        1          2          6        1

                                                                                             32
Results

Figure 6. a Dissected Jugal flower with three carpels; b Dissected IR36 flower with single
carpel. The arrows indicate carpels.

Table 6. Details of carpel numbers of Jugal and IR36 flowers

                     Flower Flowers Flowers Flowers Flowers
                     Name     with    with    with    with
                              One     Two    Three   Four
                            Carpel Carpels Carpels Carpels
                      Jugal    58      89      46      07
                      IR36    200       0       0       0

                                                                                             33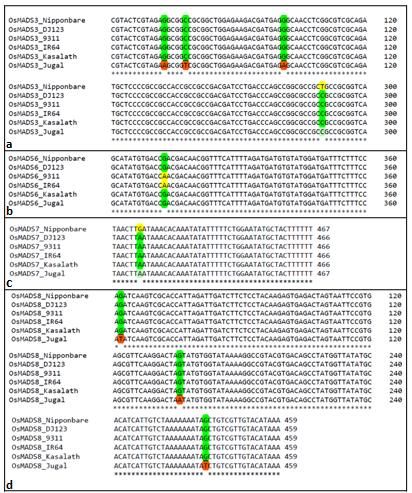
Results

3.1. 2. Scanning electron microscopy (SEM) study

The Scanning Electron Microscopic (SEM) observation of dissected mature flowers of both
Jugal and IR36 are presented in Figure 7. The image of Figure 7a represents a mature
dissected Jugal flower which showed to bear two carpels. Figure 7b displays a mature and
dissected IR36 flower possessing a single carpel. SEM analysis reveals that both the two
carpels of Jugal flower have developed from the same whorl and they are fused at the base.
SEM study also shows that the shape and the arrangement both the two carpels of Jugal
flower are almost similar to that of the IR36 carpel. Thus the SEM study confirmed the
presence of more than one carpel in Jugal flowers.

Figure 7. a SEM image of Jugal flower; the two arrows indicate presence of two carpels. b
SEM image of IR36 flower. The carpel was indicated by the arrow.

                                                                                            34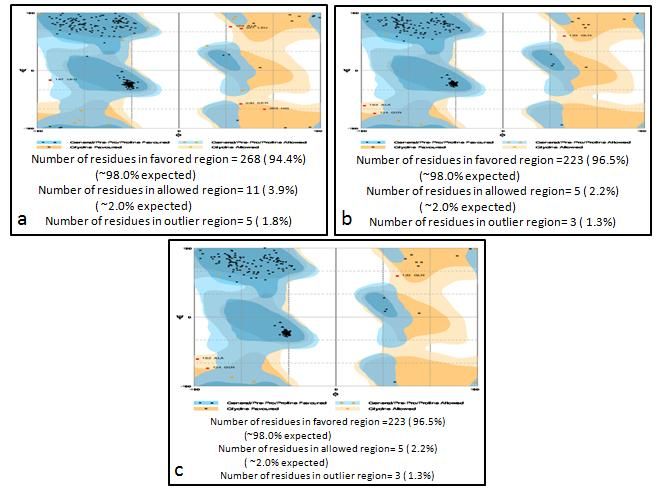
Results

3.2. Characterization of floral meristem
Microscopic study of floral meristems showed that the floral meristems of Jugal are enlarged
when compared with IR36 floral meristems (Figure 8). The sections of Jugal and IR36 floral
meristems are presented in Figure 9.

                 Figure 8. a Jugal Floral Meristem. b IR36 floral meristem.

Figure 9. a Microtomic section of Jugal floral meristem. b Microtomic section of IR36 floral
meristem.

                                                                                         35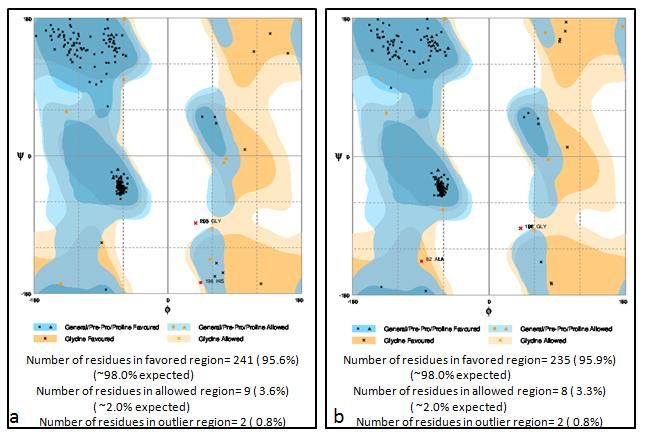
Results

3.3. Hybridization program

Forty two traits of both Jugal and IR36 plants were studied in field for two successive years
(2015-16, and 2016-17), which showed significant differences between these varieties
regarding most of the traits studied. While Jugal has long stem, late heading time, few
panicles par plant, and late time of maturity, IR36 has very short stem, early heading time,
much more panicles per plant than Jugal and very early maturity time (Table 7).

Table 7. Characterization of Jugal and IR36 plants

  Sl            Characteristics                      States          Jugal         IR36
  No
  1     Coleoptile: Colour                Colourless/ Green/       Colourless Colourless
                                          Purple

   2    Basal leaf: Sheath colour         Green/ Light Purple/       Green        Green
                                          Purple Lines/
                                          Uniform Purple
   3    Leaf: Intensity of green colour   Light/ Medium/ Dark         Dark        Medium

   4    Leaf: Anthocynin coloration       Absent/ Present            Absent       Absent

   5    Leaf: Distribution of             On tip only/ On              NA          NA
        Anthocyanin coloration            margins only/ In
                                          blotches only/
                                          Uniform
   6    Leaf Sheath: anthocyanin          Absent/ Present            Absent       Absent
        coloration
   7    Leaf: Pubescence of Blade         Absent/ Weak/              Weak         Absent
        Surface                           Medium/ Strong/ Very
                                          Strong
   8    Leaf: Auricles                    Absent/ Present            Absent       Absent

   9    Leaf: Anthocyanin Coloration      Colorless/ Light             NA          NA
        of Auicles                        Purple/ Purple
   10   Leaf: Collar                      Absent/ Present            Present      Absent

   11   Leaf: Anthocyanin coloration      Absent/ Present            Absent        NA
        of collar
   12   Leaf: Ligule                      Absent/ Present            Present      Present

                                                                                            36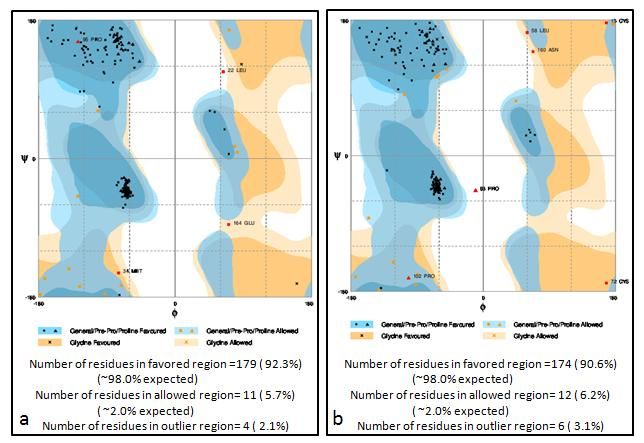
13   Leaf: Shape of Ligule            Truncate/ Acute/ Spilt   Truncate   Truncate

14   Leaf: Colour of the Ligule       White/ Light Purple/      White      White
                                      Purple
15   Leaf: Length of Blade            Short (45cm)
16   Leaf: Width of Blade             Narrow(2cm)
17   Culm : Attitude                  Erect/ Semi Erect/        Erect      Semi
                                      Open/ Spreading                      Erect

18   Time of Heading (50% of the      Very Early (131
                                      Days)
19   Flag Leaf: Attitude of Blade     Erect/ Semi Erect/        Semi       Semi
     (Early Observation)              Horizontal/ Drooping      Erect      Erect

20   Lemma: Anthocyanin               Absent/ Very week/       Absent     Absent
     coloration on keel               Week/ Medium/
                                      Strong/ Very Strong
21   Lemma: Anthocyanin               Absent/ Weak/             Weak      Absent
     coloration of area below apex    Medium/ Strong/ Very
                                      Strong
22   Lemma: Anthocyanin               Absent/ Weak/            Strong     Absent
     coloration of apex               Medium/ Strong/ Very
                                      Strong
23   Spikelet: Color of Stigma        White/ Light Green/       Purple     White
                                      Yellow/ Light Purple/
                                      Purple
24   Stem: Thickness                  Thin(0.55cm)
25   Stem: Length (excluding          Very Short(150cm)

26   Stem: Anthocyanin coloration     Absent/ Present          Present    Absent
     of nodes
27   Stem: Intensity of Anthocyanin   Weak/ Medium/             Weak        NA

                                                                                     37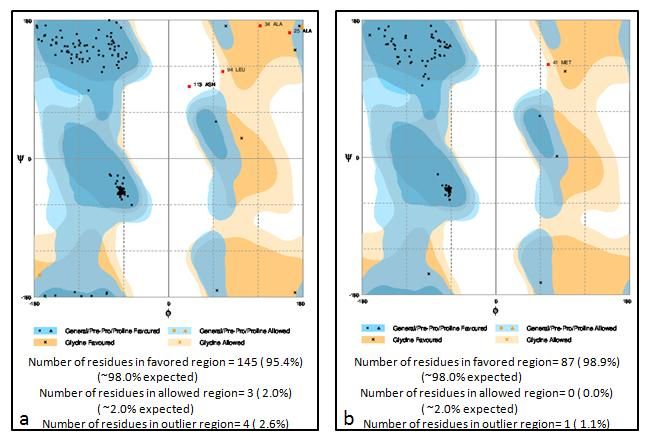
coloration of nodes              Strong
28   Stem: Anthocyanin coloration     Absent/ Present         Absent     Absent
     of internode
29   Panicle: Length of Main Axis     Very Short (30cm)
30   Flag Leaf: Attitude of Blade     Erect/ Semi Erect/       Semi       Erect
     (Late Observation)               Horizontal/ Deflexed     Erect

31   Panicle: Curvature of main       Straight/ Semi          Straight   Straight
     Axis                             Straight/ Deflexed/
                                      Dropping
32   Panicle: Number per Plant        Few(20)
33   Spikelet: Colour of the tip of   White/ Yellowish/        Brown      White
     Lemma                            Brown/ Red/ Purple/
                                      Black

33   Lemma and Palea: Colour          Straw/                  Gold and   Gold and
                                      Gold and gold/           gold       gold
                                      furrow on straw
                                      background/
                                      Brown spots on straw/
                                      Brown furrows on
                                      straw/
                                      Brown(tawny)/
                                      Reddish to light
                                      purple/
                                      Purple spot/
                                      furrows on straw/
                                      Purple/
                                      Black
34   Panicle: Awns                    Absent/ Present         Absent     Absent

35   Panicle: Presence of Secondary   Absent/ Present         Present    Absent
     Branching
36   Panicle: Secondary Branching     Weak/ Strong/            Weak        NA
                                      Clustered
37   Panicle: Attitude of Branches    Erect/ Erect to Semi     Erect       NA
                                      Erect/ Semi Erect/
                                      Semi Erect to
                                      Spreading/ Spreading
38   Time of maturity (days)          Very Early(160)

                                                                                    38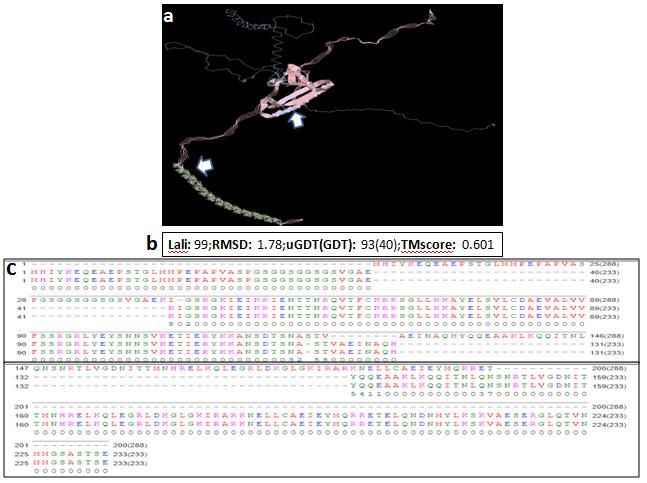
39    Sterile lemma: Color             Straw/ Gold/ Red/          Straw       Straw
                                          Purple
   40    Grain : Weight of 1000 fully     Very low(30gm)
   41    Grain: Length                    Very Short (12.5mm)
   42    Grain : Width                    Very                       Very       Narrow
                                          Narrow(3.5mm)

The crosses between Jugal and IR36 produce F1 progeny only in the combinations where
Jugal plants were selected as male parent donating pollen and IR36 plants were recipient of
those pollens and act as female parent (Figure 10). Interestingly, there were no F1 seeds
produced on crosses between Jugal as female parent and IR36 as male parent. However, Jugal
female plants produce seeds when they were self-pollinated which clearly indicates that they
are not female sterile.

Figure 10. a Seeds of F1 generation in cross between male Jugal and female IR36; b a viable
germinating seed of F1 generation.

                                                                                         39
Results

     3.4. Study of sequence diversity of the major genetic loci involved in floral
     organ development

     3.4.1. PCR amplification and sequencing of Jugal floral organ developmental genes

     The details of the floral organ developmental genes selected for this present investigation are
     presented in Table 8, which included both the biological and the molecular function of the
     genes studied. Most of the genes selected for this study are transcription factors and belong to
     the gene groups described in ABCDE model; however, the DL, LOG, and FON1 genes are
     associated with development and maintenance of floral meristem.

     Table 8. Details of the floral organ developmental genes investigated

Sl        Genes        RAP-DP                             Functional Annotation
No                     Gene ID                 Biological Function            Molecular Function
 1         DL        Os03g0215200             Specification of carpel         Transcription factor
 2        LOG        Os01g0588900      Regulation of meristem development      Hydrolase activity
 3        FON1       Os06g0717200      Specification of floral organ number     Serine/threonine
                                                                                 protein kinase
4      OsMADS1       Os03g0215400         Floral meristem determinacy         Transcription factor
5      OsMADS3       Os01g0201700              Carpel development             Transcription factor
6      OsMADS6       Os02g0682200      Specification of floral organ identity Transcription factor
7      OsMADS7       Os08g0531700              flower development             Transcription factor
8      OsMADS8       Os09g0507200              flower development             Transcription factor
9      OsMADS13      Os12g0207000              Ovule development              Transcription factor
10     OsMADS17      Os04g0580700      Specification of floral organ identity Transcription factor
11     OsMADS18      Os07g0605200              flower development             Transcription factor
12     OsMADS21      Os01g0886200              Ovule development              Transcription factor
13     OsMADS34      Os03g0753100              flower development             Transcription factor
14     OsMADS58      Os05g0203800              Carpel development             Transcription factor

                                                                                                  40
Results
3.4.2. Bioinformatical analysis of the derived sequences
The sequences of PCR derived amplicons were first subjected to BLASTN with the reference
genome in ensemble plant database for quality check and the outcome of that is presented in
Table 9.
Table 9. BLAST analysis of the sequences
Sl Gene Gene ID Genomic Alignment Alignment E-value Percentage
No Name location length score identity
1 DL Os03g0215200 3:6042148 to 525 521 0.0 99.8
6042672 (+)
2 FON1 OS06G0717200 6:30470192 to 432 428 0.0 99.8
30470623 (+)
3 LOG OS01G0588900 1:22955171 to 372 348 0.0 98.4
22955542 (+)
4 OsMADS3 OS01G0201700 1:5568017 to 527 511 0.0 99.2
5568543 (+)
5 OsMADS6 OS02G0682200 2:27883673 to 360 360 0.0 100.0
27884032 (+)
6 OsMADS7 OS08G0531700 8:26511898 to 467 463 0.0 99.8
26512364 (+)
7 OsMADS8 OS09G0507200 9:19659409 to 459 447 0.0 99.3
19659867 (+)
8 OsMADS1 OS03G0215400 3:6061106 to 174 70 7.0E-32 85.1
6061279 (-)
9 OsMADS13 OS12G0207000 1:5568068 to 181 169 6.1E-91 98.3
5568248 (-)
10 OsMADS17 OS04G0580700 4:29308380 to 154 74 2.5E-34 87.0
29308533 (+)
11 OsMADS18 OS07G0605200 7:24788591 to 122 46 9.8E-18 84.4
24788712 (+)
12 OsMADS21 OS01G0886200 1:38501862 to 152 76 1.6E-35 87.5
38502013 (+)
13 OsMADS34 OS03G0753100 3: 31054588 to 122 46 9.8E-18 84.4
31054709 (-)
14 OsMADS58 OS01G0201700 1:5568065 to 178 166 3.7E-89 98.3
5568242 (-)
In the above mentioned table, genomic location is the location of the query sequence on rice
genome. Alignment length is the full length of the alignment which includes all the gaps
presented either in the query (input) sequence or subject (hit) sequence. Alignment score was
calculated from the alignment, which mainly indicates the number of matches in the
alignment. Percentage identity is the percentage of the query (input) sequence identical to the
subject (hit) sequence.
41Results
E-value is the probability that the alignment between the query sequence (input) and the
subject sequence (hit) due to chance; i.e. higher the E-value, higher the probability of error.
In this experiment though we sequenced 14 genes, 7 of them (OsMADS1, OsMADS13,
OsMADS17, OsMADS18, OsMADS21, OsMADS34, OsMADS58) were found to have higher
E-value and therefore excluded from further investigation.
The PCR derived sequences of FON1, DL, LOG, OsMADS3, OsMADS6, OsMADS7, and
OsMADS8 were submitted to Gene bank of NCBI with the accession numbers - MH053403,
MH053404, MH053405, MH053406, MH065616, MH065617, and MH065618, respectively
and were further analyzed bioinformatically. At first, the sequences were investigated to find
out genetic variations, which were indicated by sequence variation between Jugal floral organ
developmental gene sequences and the rice reference genome sequences of the same genes.
The outcome of pair-wise alignment between Jugal and the rice reference genome genes
showed that, six among the seven Jugal floral organ developmental genes studied possess
nucleotide sequence variations. Only, sequence of OsMADS6 did not showed any alteration
between Jugal and the reference genome. The total number of variations in each individual
gene sequences were counted, and also whether the variations were transitions (T/C and G/A)
or transvertions (T/G, C/G, T/A, and C/A) were estimated (Table 10). The sequence
variations are presented in Figure 11, where the nucleotide variations were highlighted with
colours.
To find out the consequences of nucleotide variations at amino acid level, the Jugal floral
organ developmental gene sequences were bioinformatically converted into their
corresponding amino acid sequences. The tool used for conversion of nucleotide conversion
was NCBI ORF finder (Wheeler et al. 2003), a web based tool which analyze Open Reading
Frame (ORF) of any sequence that had been input. The derived amino acid sequences were
pair-wise aligned which showed that three (FON1, LOG, and OsMADS8) among the seven
investigated genes have changes into their amino acid sequences (Table 10). In case of
OsMADS6, as there was no variation in nucleotide sequence thus there is no changes in
amino acids. Interestingly, DL, OsMADS3, and OsMADS7 genes have changes in their
nucleotide sequences, but still that did not confer any alterations in amino acid sequence. The
outcome of pair-wise alignment with amino acid sequence variations are presented in Figure
12.
42Results
Table 10. Variations presented in nucleotide sequences of Jugal floral organ developmental
genes and their corresponding amino acid sequences
Sl Gene RAP-DP Variations of Nucleotide Variations of Amino acid
No Sequence sequences
Gene ID
No Transition Presence of No of
of (Ts) or variation variation
variation Transversion
(Tv)
1 DL Os03g0215200 1 Ts-1 No NA
2 FON1 OS06G0717200 1 Ts-1 Yes 1
3 LOG OS01G0588900 6 Ts-2, Tv-4 Yes 4
4 OsMADS3 OS01G0201700 4 Ts-4 No NA
5 OsMADS6 OS02G0682200 NA NA No NA
6 OsMADS7 OS08G0531700 1 Ts-1 No NA
7 OsMADS8 OS09G0507200 3 Ts-1, Tv-2 Yes 1
Figure 11. Variations presented in Jugal floral organ developmental genes. The variations are
highlighted with colours; green colour was used to highlight the reference genome sequences,
while the Jugal sequences were highlighted with red colour. a Alignment of DL; b Alignment
of FON1; c Alignment of LOG; d Alignment of OsMADS3; e Alignment of OsMADS7; f
Alignment of OsMADS8.
43Results
Figure 12. Variations presented in Jugal floral organ developmental genes corresponding
amino acid sequences. The variations are highlighted with colours; green colour was used to
highlight the amino acids in reference genome sequences, yellow colour was used to Jugal
amino acids which are related to the reference genome amino acids; red colour was used to
highlight Jugal amino acids which are completely different than the reference genome
sequences. a Alignment of FON1; b Alignment of LOG; c Alignment of OsMADS8.
Table 11 contains the open reading frame analysis of the Jugal floral organ developmental
genes, which showed that out of the seven genes investigated only Jugal LOG gene have
changes in its open reading frame when compared with the reference genome genes. Six
among the seven genes studied, both in Jugal and the reference genome, the number of ORFs
present, presence of ORFs in positive (+) or negative (-) stand, the ORF staring nucleotide
number in sequence and the ORF ending nucleotide in sequence, length of the ORF by the
presence of number of nucleotide residues, and the number of amino acids that the ORF
codes are same. In case of LOG gene the starting point of ORF varies in Jugal and the
reference genome sequences. While in Jugal sequence, the ORF stars from the 357th
nucleotide, in the reference genome sequence the 330th nucleotide is the starting nucleotide.
However, both in Jugal and the reference genome LOG gene, the end of ORF are same (the
106th nucleotide). This change in LOG gene ORF starting point resulted alterations in the
length of ORF as well as the corresponding number of amino acid residues. While the
reference genome LOG gene ORF contains 225 nucleotides which encodes 74 amino acids,
the Jugal genome LOG gene ORF contains 252 amino acids and encodes 83 amino acids.
44Results
Table 11. Open Reading Frame (ORF) analysis of Jugal and the reference genome floral
organ developmental genes by NCBI ORF Finder
Sl Gene Genome Number Strand Start End Length Amino
No of of Of of ORF Acid
ORF ORF ORF (bp) Residues
1 DL Reference 2 + 178 309 132 43
Jugal 2 + 178 309 132 43
2 FON1 Reference 2 + 142 432 291 96
Jugal 2 + 142 432 291 96
3 LOG Reference 1 - 330 106 225 74
Jugal 1 - 357 106 252 83
4 OsMADS3 Reference 3 + 96 419 324 107
Jugal 3 + 96 419 324 107
5 OsMADS6 Reference 1 + 94 276 183 60
Jugal 1 + 94 276 183 60
6 Reference 5 - 123 1 123 40
OsMADS7
Jugal 4 - 123 1 123 40
7 Reference 3 + 156 308 153 50
OsMADS8
Jugal 3 + 156 308 153 50
3.4.3. Validation of variations
The Jugal gene sequences were further compared and analysed with the data of Rice SNP-
SEEK (Figure 13).
Figure 13: Screenshot of Rice SNP-SEEK database
45Results
The Table 12 displays the locations of the Jugal floral organ developmental genes on the
selected five reference genomes. The Jugal floral organ developmental genes sequences along
with their corresponding gene sequences from the five reference genomes were multiple
sequence aligned (MSA). The MSA data showed that, although, all the seven Jugal genes
investigated possess variations, only three genes possess unique variations. The Jugal LOG,
OsMADS3, and OsMADS8 genes have unique variations in their nucleotide sequence. The
number of variations and unique variations are presented in Table 13. FON1, DL, OsMADS6,
OsMADS7 genes were also showed variation in multiple sequence analysis; however, those
variations are not unique, as these variations are not only present in the Jugal genome but also
present in other genome gene sequences investigated. The MSA data are represented in
Figure 14 and Figure 15, where the nucleotide variations were highlighted with colours.
Table 12. Details of the five reference genome sequences on SNP-Seek database
corresponding to Jugal floral organ developmental gene sequences
Sl Gene Nipponbare 93–11 DJ 123 IR 64 Kasalath
No
1 DL chr03:6042148- chr03:6211078- scaffold_35:58 scaffold_365:2 chr03:589065
6042672 6211602 1285-581809 57499-258023 2-5891176
2 FON1 chr06:30470192- chr06:30891262- scaffold_95:48 scaffold_90:48 chr06:290668
30470623 30891693 2612-483043 5579-486010 04-29067235
3 LOG chr01:22955171- chr01:24717061- scaffold_76:53 scaffold_286:2 chr01:213437
22955542 24717435 9124-539498 89110-289481 84-21344158
4 OsMADS3 chr01:5568017- chr01:5703633- scaffold_357:1 scaffold_81:38 chr01:527858
5568543 5704159 86246-186772 0374-380900 3-5279109
5 OsMADS6 chr02:27883673- chr02:28402000- scaffold_122:2 scaffold_276:2 chr02:269515
27884032 28402359 41261-241620 50977-251336 56-26951915
6 OsMADS7 chr08:26511898- chr08:29013349- scaffold_130:5 scaffold_348:1 chr08:250821
26512364 29013814 2429-52894 89405-189870 16-25082581
7 OsMADS8 chr09:19659409- chr09:18988348- scaffold_235:1 scaffold_144:2 chr09:189003
19659867 18988806 20837-121295 18517-218975 44-18900802
46Results
Table 13. Study of uniqueness of variations of Jugal sequences
Sl Gene No of No of unique
No variations in variations in
Jugal Jugal
1 DL 1 0
2 FON1 2 0
3 LOG 7 3
4 OsMADS3 4 3
5 OsMADS6 1 0
6 OsMADS7 1 0
7 OsMADS8 3 3
Figure 14. Results of Multiple sequence alignment (MSA) of Nipponbare, DJ123, 9311,
IR64, Kasalath, and Jugal sequences. The variations which present only in Jugal sequences
are highlighted with red colour; variations present in rice genomes other than Jugal are
highlighted with yellow colour, the other variations of the alignment are highlighted by green
colour. a MSA of DL gene; b MSA of FON1 gene; c MSA of LOG gene.
47Results
Figure 15. Results of Multiple sequence alignment (MSA) of Nipponbare, DJ123, 9311,
IR64, Kasalath, and Jugal sequences. The variations which present only in Jugal sequences
are highlighted with red colour; variations present in rice genomes other than Jugal are
highlighted with yellow colour, the other variations of the alignment are highlighted by green
colour. a MSA of OsMADS3 gene; b MSA of OsMADS6 gene; c MSA of OsMADS7 gene; d
MSA of OsMADS8 gene.
48Results
3.5. Whole genome sequencing of Jugal
Whole genome sequencing of Jugal was done by next generation sequencing technology.
3.5.1. Raw data statistics
Sequencing the whole genome of Jugal rice line has generated two files (VB-156-2_1.fastq
and VB-156-2_2.fastq). A total 47.59 Million reads were obtained of which 39.31 Million are
high quality reads and 8.28 Million reads are of low quality (Table 14). The total number of
reads with non-ATGC bases are 1,59,142 (0.33%). Total no of bases are 4,806,304,372
among which total no of high quality bases are 4,418,550468 (91.93%) and the total number
of non-ATGC bases are 8,60,683 (0.01%).
Table 14. Raw Data Quality Summery
Total No. of reads Total High Quality (HQ) Total Low Quality
reads reads
47,587,172 39,311,826 8,275,346
Figure 16. Summary of the sequenced reads
49Results
3.5.2. Pre-processing and mapping of reads
Whole genome sequencing of var. Jugal generated total 4.09 GB of high quality sequence
data. Total 4.76X10⁷ paired-end raw reads with 101bp length were obtained with an average
depth of coverage of 10X. After quality check 4.58X10⁷ (96.2%) cleaned and high quality
reads were identified and studied for variant analysis and other downstream analysis (Figure
16). Around 4.08X10⁷ (89.02 %) reads were mapped properly onto the reference genome and
out of which 3.39X10⁷ reads were mapped uniquely which were further used for variant
discovery analysis. The aligned reads were converted into BAM file and submitted to the
Sequence Read Archive (SRA) at NCBI with the accession number SRP131720. Analysis of
mapped reads showed that maximum reads (3,966,575) were mapped to chromosome 1,
followed by chromosome 3 (3,550,428) and chromosome 2 (3,358,620); Chromosome 9 has
the minimum number of mapped reads (2,002,568) (Table 15). The unmapped reads were
further de novo assembled which was described later.
Table 15. List of chromosome number with uniquely mapped reads into the reference
genome
Sl
No Chromosome Oryza sativa japonica Uniquely paired
(Accession) cv. Nipponbare (bp) mapped reads
1 Chromosome 1
43270923 3966575
(NC_029256.1)
2 Chromosome 2
35937250 3358620
(NC_029257.1)
3 Chromosome 3
36413819 3550428
(NC_029258.1)
4 Chromosome 4
35502694 3007257
(NC_029259.1)
5 Chromosome 5
29958434 2816056
(NC_029260.1)
6 Chromosome 6
31248787 2829818
(NC_029261.1)
7 Chromosome 7
29697621 2637964
(NC_029262.1)
8 Chromosome 8
28443022 2593109
(NC_029263.1)
9 Chromosome 9
23012720 2002568
(NC_029264.1)
10 Chromosome 10 23207287 2208380
50(NC_029265.1)
11 Chromosome 11
29021106 2433673
(NC_029266.1)
12 Chromosome 12
27531856 2290523
(NC_029267.1)
Table 16. Chromosome wise variant distribution and density per 100 kb
Sl Chromosome Oryza sativa Total Variants SNPs InDels
No (Accession) japonica cv. (Density per (Density per (Density per
Nipponbare (bp) 100 kb) 100 kb) 100 kb)
1 Chromosome 1 43270923 129,870 110,196 19,674
(NC_029256.1) (300.1) (254.7) (45.5)
2 Chromosome 2 35937250 107,230 91,546 15,684
(NC_029257.1) (298.4) (254.7) (43.6)
3 Chromosome 3 36413819 109,464 93,481 15,983
(NC_029258.1) (300.6) (256.7) (43.9)
4 Chromosome 4 35502694 84,725 73,253 11,472
(NC_029259.1) (238.6) (206.3) (32.3)
5 Chromosome 5 29958434 84,282 72,643 11,639
(NC_029260.1) (281.3) (242.5) (38.9)
6 Chromosome 6 31248787 96,356 83,055 13,301
(NC_029261.1) (308.4) (265.8) (42.6)
7 Chromosome 7 29697621 86,599 74,765 11,834
(NC_029262.1) (291.6) (251.8) (39.8)
8 Chromosome 8 28443022 85,179 73,370 11,809
(NC_029263.1) (299.5) (258) (41.5)
9 Chromosome 9 23012720 70,611 60,850 9,761
(NC_029264.1) (306.8) (264.4) (42.4)
10 Chromosome 10 23207287 75,563 65,582 9,981
(NC_029265.1) (325.6) (282.6) (43)
11 Chromosome 11 29021106 90,428 78,460 11,968
(NC_029266.1) (311.6) (270.4) (41.2)
12 Chromosome 12 27531856 75,075 64,922 10,153
(NC_029267.1) (272.7) (235.8) (36.9)
13 Mitochondrion 490520 66 50 16
genome (13.5) (10.2) (3.3)
(NC_011033.1)
14 Other genomic - 971 860 111
regions
15 Total - 1,096,419 943,033 153,386
51Results
3.5.3. Variant (SNP/InDels) Discovery
Total 3,574,389 variants (3,226,099 SNPs and 348,290 InDels) were detected initially using
default parameters. Several filtering parameters were used to remove the false positive
variants and finally 1,096,419 variants were obtained which contain 943,033 SNPs and
153,386 InDels. Out of the 153,386 InDels, 75,051 were insertion and 78,335 were deletions.
Moreover, a total of 962,268 and 134,151 variants were identified as homozygous and
heterozygous respectively. Chromosome 1 has the maximum number of variants i.e. 129,870,
followed by Chromosome 3 (109,464 variants) and Chromosome 2 (107,230 variants); least
number of variants were found in chromosome 9 i.e. 70,611 (Figure 17 and Figure 18).
Density distribution of all the chromosome were calculated per 100 kb, chromosome 11 has
the maximum density i.e. 311.6, followed by 308.4 and 306.8 in chromosome 6 and
chromosome 9, respectively (Table 16). Chromosome 4 has the lowest density i.e. 238.6.
Structural variant analysis detected 12,143 structural variants (SV) which included 896 intra-
chromosomal translocation (ITX), 3,895 inter-chromosomal translocation (CTX), 6,754
deletion (DEL), 459 inversion (INV), 87 unknown (UN) and 52 insertion (INS) (Figure 19).
3.5.4. Analysis of Variants (SNPs and InDels)
The 1,096,419 variants included 1,200 multiallelic sites and 600 multiallelic SNP sites.
Among the 943,033 SNPs detected, 668,660 are transitions (T/C and G/A) and 274,373 are
transversion (T/G, C/G, T/A, and C/A). The ratio of transition to transversion is 2.44. The
frequency of transversions is comparatively lower than transitions. In transition, maximum
SNPs are C to T i.e. 181,812 count and A to G is minimum in count i.e. 152,353. Whereas in
case of transversion, T to A is maximum in count i.e. 39,127 and C to G has 25,035 which is
minimum in count (Figure 20). In InDels, the insertions variants are ranged from 1bp to 29bp
and deletions are ranged in between -1bp to -44bp. In both insertion and deletion, maximum
changes are in 1bp, followed by 2bp and 3bp (Figure 21).
52Results
Figure 17. Chromosome-wise distribution of SNPs and InDels
Figure 18. Circular plot of variants across 12 rice chromosome
53Results
Figure 19. Distribution of structural variants
Figure 20. Transitions/transversion (Ts/Tv) distribution in SNPs
Figure 21. Length variation found in insertion and deletion in InDels
54Results
Table 17: Summary of variants in the selected 23 flowering genes
Sl Gene Name Gene_ID Total No of
No variants
1 OsMADS1 Os03g0215400 23
2 OsMADS2 Os01g0883100 7
3 OsMADS3 Os01g0201700 20
4 OsMADS4 Os05g0423400 7
5 OsMADS5 Os06g0162800 17
6 OsMADS6 Os02g0682200 23
7 OsMADS7 Os08g0531700 16
8 OsMADS8 Os09g0507200 21
9 OsMADS13 Os12g0207000 15
10 OsMADS14 Os03g0752800 26
11 OsMADS15 Os07g0108900 24
12 OsMADS16 Os06g0712700 13
13 OsMADS17 Os04g0580700 22
14 OsMADS18 Os07g0605200 18
15 OsMADS21 Os01g0886200 5
16 OsMADS34 Os03g0753100 20
17 OsMADS58 Os05g0203800 20
18 FON1 Os06g0717200 9
19 FON2 Os11g0595400 13
20 DL Os03g0215200 32
21 LOG Os01g0588900 11
22 SNB Os07g0235800 25
23 OSH1 Os03g0727000 32
55Results
3.5.5. Variants Annotation
Annotation of the variants against the reference genome was done of which 821,472 variants
were found in intergenic region and 123,739 variants were in exon region. In addition to this,
40,408 missense variants, 508 nonsense, and 34,924 silent variants were detected. Ratio of
Missense/Silent ratio was 1.157 (Figure 22). Out of 1,096,419 variants, 24,920 were non-
synonymous SNPs which found in 11,529 genes. SNPs per gene in non-synonymous SNPs
were ranged from 1 to 49.
Figure 22. Annotation and distribution of Variants (SNPs and InDels)
3.5.6. De novo assembly of unmapped reads
Total 1,601,994 paired end unmapped reads were used for de novo assembly of var. Jugal.
After assembly, total 16,585 contigs were generated with minimum read length between 56bp
with kmer of 55bp. Contigs with sequence length less than 200bp were removed. Finally,
16,159 contigs were remained with N50 of 977bp. Maximum contigs have length in between
200 to 299 i.e. 6653, followed by 2430 and 1343 in base pair ranged 300 to 399 and 400 to
499, respectively. Out of 16,159 contigs, 9,075 contigs were not showed any similarity
against NR database, while 7,084 contigs matched with known genes. Maximum hits were
found with Oryza sativa Japonica and Oryza sativa Indica i.e. 1,478 and 1,298, respectively
(Figure 23). Annotation and gene ontology of contigs were performed and sub categorized
mapped genes into cellular component, molecular function and biological process
56Results
(Figure 24). Variants were also mined against de novo assembly of unmapped reads. Total
2,772 variants were detected which contains 2,636 SNPs and 136 InDels. Out of 2,772
variants, 2,542 and 230 were heterozygous and homozygous, respectively. Out of 2,636
SNPs, 1,670 and 966 were transitions (Ts) and transversion (Tv), respectively with Ts/Tv
ratio of 1.73. In case of InDels, 87 were insertions and 49 were deletions. In insertion and
deletion both were ranged from 1 to 5 and -1 to -5.
3.5.7. Analysis of the variants in the floral organ developmental genes
Analysis of the variations of the 23 floral organ developmental genes shows that the selected
genes in Jugal contained 419 SNPs. The detail information of the genes studied was provided
in Table 18 and the summery of variants in the studied genes were presented in Table 17.
Among the 23 floral organ developmental genes studied, DL and OSH1 genes found to have
highest number of variants (32 variants); whereas, MADS21 gene has lowest number of
variants (5 variants).
Figure 23. Top hit species distribution of de novo assembly of unmapped contigs
57Results
Figure 24. Gene ontology of contigs
3.6. Bioinformatical analysis
For detail analysis of floral organ development in Jugal, twenty three genes involved in
different floral organ development pathways were selected. Table 18 displayed details of the
genes selected for this study which include name of the genes, their accession numbers in
RAP-DB database (Sakai et al. 2013), function of the genes, accession number of the protein
products of each gene in UniProt database and reference of the genes.
For OsMADS58 gene, two isoforms of protein were presented in the UniProt database; these
isoforms are produced by alternative splicing of the OsMADS58 gene. Therefore, for
OsMADS58 both the two isoforms are considered as reference; the isoform1
(identifier: Q2V0P1-1) is considered as reference genome isoform-1, whereas, isoform2
(identifier: Q2V0P1-2) is considered as reference genome isoform-2 in all the investigations.
58Results
Table 18. Details of the floral organ developmental genes
Sl Gene RAP-DB Function UniProt Reference
No Names Accession No Accession No
1 FON1 Os06g0717200 Enlargement of Q5Z9N5 Suzaki et al.
floral meristem 2004
2 FON2 Os11g0595400 Enlargement of A0MH06 Suzaki et al.
floral meristem 2006
3 DL Os03g0215200 Carpel Q76EJ0 Yamaguchi et al.
development 2004
4 LOG Os01g0588900 Maintenance of Q5ZC82 Kurakawa et al.
floral meristem 2007
5 OSH1 Os03g0727000 Maintenance of A0A0P0W324 Sato et al. 1996
reproductive
meristem
6 SNB Os07g0235800 Maintenance of B9FWB1 Lee and An 2011
floral meristem
7 OsMADS1 Os03g0215400 MADS-box Q10PZ9 Agrawal et al.
transcription factor 2005
8 OsMADS2 Os01g0883100 MADS-box Q40702 Prasad et al. 2003
transcription factor
9 OsMADS3 Os01g0201700 MADS-box S5CT07 Li et al. 2011
transcription factor
10 OsMADS4 Os05g0423400 MADS-box Q40703 Kang and An
transcription factor 2005
11 OsMADS5 Os06g0162800 MADS-box Q0DEB8 Kang and An
transcription factor 1997
12 OsMADS6 Os02g0682200 MADS-box Q6EU39 Tao et al. 2018
transcription factor
13 OsMADS7 Os08g0531700 MADS-box Q0J466 Kang et al. 1997
transcription factor
14 OsMADS8 Os09g0507200 MADS-box Q9SAR1 Kang et al. 1997
transcription factor
15 OsMADS13 Os12g0207000 MADS-box Q2QW53 Dreni et al. 2007
transcription factor
16 OsMADS14 Os03g0752800 MADS-box A0A0P0W361 Pelucchi et al.
transcription factor 2002
17 OsMADS15 Os07g0108900 MADS-box Q6Q9I2 Pelucchi et al.
transcription factor 2002
18 OsMADS16 Os06g0712700 MADS-box Q944S9 Yun et al. 2013
transcription factor
19 OsMADS17 Os04g0580700 MADS-box Q7XUN2 Ohmori et al.
59transcription factor 2009
20 OsMADS18 Os07g0605200 MADS-box Q0D4T4 Fornara et al.
transcription factor 2004
21 OsMADS21 Os01g0886200 MADS-box Q8RU31 Dreni et al. 2013
transcription factor
22 OsMADS34 Os03g0753100 MADS-box Q6Q9H6 Gao et al. 2010
transcription factor
23 OsMADS58 Os05g0203800 MADS-box Q2V0P1-1 & Yamaguchi et al.
transcription factor Q2V0P1-2 2006
The derived amino acid sequences were aligned with the reference genome amino acid
sequences which showed that nineteen among the twenty three investigated amino acid
sequences of Jugal, are similar to the reference genome amino acid sequences. However, four
translated gene sequences (OsMADS3, OsMADS17, OsMADS58, and DL) of Jugal showed
alterations when compared with the reference genome amino acid sequences.
The OsMADS3 of the reference genome consists of 90 amino acid residues and Jugal
OsMADS3 has 154 amino acid residues. Thus Jugal OsMADS3 has 64 additional amino
acids when compared with the reference genome OsMADS3. The pair-wise alignment of
Jugal and the reference genome OsMADS3 are presented in Figure 25.
Figure 25. Pair-wise alignment of Jugal and the reference genome OsMADS3 amino acid
sequence; the variations are highlighted by yellow colour.
The reference genome OsMADS17 protein possesses 249 amino acids, whereas Jugal
OsMADS17 consists of 254 amino acids. Thus the Jugal OsMADS17 has 5 more amino acid
residues in comparison to the reference genome (Figure 26).
60Results
Figure 26. Pair-wise alignment of Jugal and the reference genome OsMADS17 amino acid
sequences; the variations are highlighted by yellow colour.
Among the two isoforms of the reference genome OsMADS58 protein, the isoform-1 has 272
amino acids and the isoform-2 bears 233 amino acids. The Jugal OsMADS58 has 233 amino
acids which is the same number of amino acids that the reference genome OsMADS58
isoform-2 possess but 39 amino acids less than that of the reference genome OsMADS58
isoform-1 possess. The multiple sequence alignment of both the two reference genome
OsMADS58 isoforms along with the Jugal OsMADS58 amino acid sequences are presented
in Figure 27.
Figure 27. Pair-wise alignment of Jugal and the reference genome OsMADS58 amino acid
sequence; the variations are highlighted by yellow colour.
61Results
The reference genome DL protein has 194 amino acids; while the translated gene sequence of
Jugal DL has 196 amino acids, i.e. there were two additional amino acids are present in the
Jugal DL sequence. In Jugal DL, the 24th amino acid is a leucine and the 25th amino acid is a
glutamine, which are not present in the reference genome DL (Figure 28).
Figure 28. Pair-wise alignment of Jugal and the reference genome DL amino acid sequence;
the variations are highlighted by red colour.
The physiochemical properties of OsMADS3, OsMADS17, OsMADS58, and DL proteins
were estimated by ProtParam (Figure 29). The estimated physiochemical properties of the
selected proteins are presented in Table 19. The parameters estimated include total number of
amino acids, molecular weight, theoretical pI, aliphatic index, and grand average of
hydropathicity (GRAVY).
Figure 29. Screenshot of ProtParam
62Results
Table 19. Physiochemial properties of the proteins
Sl Protein Genome Number Molecular Theoretical Aliphatic Grand
No of weight pI index average of
amino hydropathicity
acids
1 OsMADS3 Reference 90 9462.96 8.96 77.11 0.000
Jugal 154 16636.77 9.51 71.69 -0.455
2 OsMADS17 Reference 249 28183.94 9.08 76.39 -0.739
Jugal 254 28802.60 8.97 74.88 -0.765
Isoform-1 272 30830.68 8.60 67.79 -0.824
3 OsMADS58 Isoform-2 233 25868.16 9.02 72.45 -0.744
Jugal 233 25868.16 9.02 72.45 -0.744
4 DL Reference 194 21663.9 8.98 62.27 -0.547
Jugal 196 21905.19 8.9 63.62 -0.540
Domain prediction of the OsMADS3, OsMADS17, OsMADS58, and DL proteins were done
by using InterPro (Figure 30).
Figure 30. Screenshot of InterPro
Domain prediction by InterPro showed that there are no changes in domain number in all the
four Jugal proteins in comparison to the reference genome proteins (Table 20). However,
there are some alterations of start and end point of domains. Both Jugal and the reference
genome OsMADS3 have a single domain which is a MADS-box domain. In the reference
genome OsMADS3, the MADS-box domain starts in 41th amino acid and ends on 90th amino
acid. The Jugal OsMADS3 also possesses a single domain (MADS-box domain) and its
starting position is also similar to that of the reference genome OsMADS3 i.e. the 41th amino
63Results
acid. However, the Jugal MADS-box domain ends at 115th amino acid, while the reference
genome MADS-box ends at 90th amino acid. Thus the Jugal OsMADS3 MADS-box domain
has 25 more amino acids when compared with the reference genome OsMADS3.
Both Jugal and the reference genome OsMADS17 bear two domains, a MADS-box domain
and a K-box domain. In the reference genome OsMADS17 protein, the MADS-box domain
starts at 1st amino acid and ends at 77th amino acid. While in Jugal OsMADS17, the MADS-
box starts at 6th amino acid and ends at 82th amino acid. Thus though the number of amino
acids in the Jugal OsMADS17 MADS-box domain same with the reference genome
OsMADS17, there is a shift of 5 amino acids in both the start and end of the domain. The
second domain present in OsMADS17 is a K-domain which starts in the reference genome at
87th amino acid and ends at 178th amino acid. Whereas in Jugal, the start and end of the K-
domain is the 92th and the 183th amino acid respectively, which is also a shift of 5 amino
acids.
There are no changes in domains of both the two isoforms of reference genome OsMADS58
(isoform-1 and isoform-2) and Jugal OsMADS58. All the three OsMADS58 proteins possess
two domains, a MADS-box domain and a K-box domain. In all the three OsMADS58
proteins, the MADS-box domain starts from the 43th amino acid and ends in the 117th amino
acid. Whereas, the K-box domain starts from the 128th amino acid and ends in the 219th
amino acid. Thus despite the differences in their length, there are no differences in the
domains of the reference genome OsMADS58 isoform-1, isoform-2 and Jugal OsMADS58.
The DL protein of both the reference genome and Jugal has a single domain which is a
HMG-box domain. The domain of the reference genome DL starts from the 92th amino acid
and ends at the 158th amino acid. While Jugal DL HMG-box starts in the 94th amino acid and
ends in the 160th amino acid. Thus, there is a shift of 2 amino acids on the Jugal DL domain.
64Results
Table 20. Domain prediction by InterPro
Sl Protein Genome No of Name of Location Name of Location
No name Domains Domain Domain
1 2
1 OsMADS3 Reference 1 MADS 41-90 N.A. N.A.
BOX
Jugal 1 MADS 41-115 N.A. N.A.
BOX
2 OsMADS17 Reference 2 MADS 1-77 K BOX 87-178
BOX
Jugal 2 MADS 6-82 K BOX 92-183
BOX
Isoform-1 2 MADS 43-117 K BOX 128-219
3 OsMADS58 BOX
Isoform-2 2 MADS 43-117 K BOX 128-219
BOX
Jugal 2 MADS 43-117 K BOX 128-219
BOX
4 DL Reference 1 HMG 92-158 N.A. N.A.
BOX
Jugal 1 HMG 94-160 N.A. N.A.
BOX
Protein Structures were predicted by RaptorX (Figure 31). RaptorX is a Web Portal for
Protein Structure and Function Prediction; RaptorX Structure Prediction
(http://raptorx.uchicago.edu/StructurePrediction/predict/) is a server that predicts three-
dimensional structures of proteins.
Figure 31. Screenshot of RaptorX server for protein structure prediction.
65Results
The RaptorX server provides several parameters for interpretation of the results as well as
estimation of the quality of the predicted structure (Ma et al. 2013). The H, E, and C are
assigned for secondary structure prediction and represent Helix, Beta-sheet and Loop,
respectively. The P-value used to evaluates the relative quality of a predicted structure;
usually, smaller the P-value, the higher quality of the model. For alpha proteins, P-value less
than 10^-3 is a good indicator; whereas, for beta proteins, P-value less than 10^-4 is a good
indicator. uGDT(GDT) measures the absolute model quality; uGDT is the unnormalized
GDT (Global Distance Test) score; whereas, GDT is calculated as uGDT divided by the
protein (or domain) length and multiplied by 100. For a protein with >100 residues,
uGDT>50 is a good indicator. A predicted structure with both good P-value and uGDT(GDT)
is very likely to be of high quality. However, a model with good P-value but poor uGDT
value may be of low quality. Whereas, a model with a good uGDT, but poor P-value often
considered as of good quality.
The structures of OsMADS3, OsMADS17, OsMADS58, and DL proteins were predicted by
Raptor X and the predicted models are presented in Figure 32, Figure 33, Figure 34, and
Figure 35, respectively. The predicted structure of Jugal OsMADS3 protein is presented in
Figure 32a and the predicted structure of the reference genome OsMADS3 is presented in
32b. Figure 33a shows Jugal OsMADS17 protein, while the reference genome OsMADS17
protein presented in Figure 33b. The reference genome OsMADS58 isoform-1, OsMADS58
isofom-2 and Jugal OsMADS58 are presented in Figure 34a, Figure 34b, and Figure 34c
respectively. The Figure 35a shows Jugal DL and Figure 35b represents the reference genome
DL. Each predicted protein structures in the Figure 32, Figure 33, Figure 34, and Figure 35
include 4 parameters, which are - the total number of domains presented in the protein,
information about the secondary structure (the percentage of the Helix (H), Beta-sheet (E),
and Loop (C)), overall p-value, and overall µGDT(GDT).
66Results
Figure 32. Predicted structure of OsMADS3; a Jugal; b the reference genome.
Figure 33. Predicted structure of OsMADS17; a Jugal; b the reference genome.
67Results
Figure 34. Predicted structure of OsMADS58; a the reference genome isoform-1; b the
reference genome isoform-2; c Jugal.
Figure 35. Predicted structure of DL; a Jugal; b the reference genome.
68Results
Validation of the predicated structures was done by RAMPAGE (Figure 36).
Figure 36. Screenshot of RAMPAGE
RAMPAGE uses several parameters for interpretation of the output of RAMPAGE which
includes – the number of amino acids in the favoured region in the Ramachandran Plot will
be around 98%, the number of amino acids in the allowed region in the Ramachandran Plot
will be around 2%; RAMPAGE also shows the number of amino acids in the outlier region in
Ramachandran Plot. The Figure 37a and Figure 37b represent validation of Jugal OsMADS3
and the reference genome OsMADS3, respectively. Figure 38a shows validation of Jugal
OsMADS17 and Figure 38b shows validation of the reference genome OsMADS17. Figure
39a, Figure 39b, and Figure 39c represent validation of OsMADS58 isoform-1, OsMADS58
isofom-2 and Jugal OsMADS58 respectively. Validation of Jugal DL is presented in Figure
40a and validation of the reference genome DL is presented in Figure 40b.
69Results
Figure 37. Structure validation OsMADS3 protein; a Jugal; b the reference genome.
Figure 38. Structure validation OsMADS17 protein; a Jugal; b the reference genome.
70Results
Figure 39. Structure validation OsMADS58 protein; a the reference genome isoform-1; b the
reference genome isoform-2; c Jugal.
Figure 40. Structure validation DL protein; a Jugal; b the reference genome.
71Results
Alignment of the predicted protein structures was done by RaptorX Structure Alignment
Server (Figure 41).
Figure 41. Screenshot of RaptorX Structure Alignment Server
RaptorX structure alignment server uses several parameters to evaluate the quality of a
aligned protein structure which included Lali, RMSD, uGDT(GDT), and TMscore. The
length of alignment abbreviated as Lali represents the length of core. The core of aligned
protein structure is the portion of the structures in an alignment which aligned perfectly, and
represented as fully-aligned columns. RMSD is root-mean-square deviation and calculated
only on the core residues; the RMSD value was used for calculation of uGDT. uGDT is the
unnormalized GDT (Global Distance Test) score; whereas, GDT is calculated as uGDT
divided by the shorter (shortest) protein length and multiplied by 100. For protein structure
alignment, TMScore is the average TMscore of all the pair-wise alignments; the range of
TMscore is between 0 to 1. If TMscore >0.6, it is very likely (90% of chance) that two
proteins share a similar fold. When TMscoreResults
The alignment of the reference genome OsMADS3 and Jugal OsMADS3 proteins structures
are presented in Figure 42. Figure 42a shows the alignment of the two OsMADS3 proteins of
both the reference genome and Jugal. The Lali, RMSD, uGDT(GDT), TMscore values of the
alignment are presented in Figure 42b. The amino acids of the core of the alignment are
presented in Figure 42c, where the top row of the alignment shows the reference genome
OsMADS3 amino acid sequences and the bottom row shows amino acid sequences of Jugal
OsMADS3. Residues in the alignment are coloured according to their chemical nature – the
red colour indicates the hydrophobic amino acids, blue indicates acidic amino acids, the
magenta colour corresponds to basic amino acids, and the green colour indicates hydroxyl
and amine amino acids. The length of the alignment (Lali) is 49, which indicates that the 90
amino acid residues long the reference genome OsMADS3 and the 154 amino acid long Jugal
OsMADS3 produce protein structures which have a region of similar protein structures of 49
amino acids long. The 49 amino acids long structure of both the reference genome and Jugal
OsMADS3 protein is also called as core of the alignment and indicated with an arrow in the
Figure 42a.
Figure 42. Alignment of OsMADS3 protein structure of Jugal and the reference genome.
73Results
The aligned protein structures of OsMADS17 are presented in Figure 43. Figure 43a contains
the alignment of the reference genome OsMADS17 and Jugal OsMADS17 protein structures,
where the core of the alignment is showed by an arrow. Figure 43b shows the Lali, RMSD,
uGDT(GDT), and TMscore values of the alignment. The amino acids of the core of the
alignment are presented in Figure 43c. The Lali of the alignment of OsMADS17 is 102, this
indicates that among the 249 amino acid long the reference genome OsMADS17 protein and
254 amino acids long Jugal OsMADS17 protein, structures produced by 102 amino acids are
identical. The 102 amino acids that included in the core of the alignment are 78th-179th amino
acids of the reference genome OsMADS17 and 83th-184th amino acids of Jugal OsMADS17.
In Figure 43c, the top row of the alignment shows Jugal OsMADS17 amino acid sequences,
while the bottom row shows amino acid sequences of the reference genome OsMADS17.
Figure 43. Alignment of OsMADS17 protein structure of Jugal and the reference genome.
74Results
The alignment of the reference genome OsMADS58 isoform-1, OsMADS58 isoform-2 and
Jugal OsMADS58 are presented in Figure 44a and the core of the alignment was indicated
with arrow. Figure 44b shows Lali, RMSD, uGDT(GDT), and TMscore values of the
alignment. Figure 44c shows alignment of the amino acids.
Figure 44. Alignment of OsMADS58 protein structure of Jugal, the reference genome
isoform-1, and the reference genome isoform-2.
75Results
The alignment of the reference genome DL and Jugal DL are presented in Figure 45. The
alignment of protein structure is presented in Figure 45a, where the core of the alignment was
indicated by an arrow. The parameters for interpretation of the alignment data are represented
in Figure 45b, which shows that Lali of the alignment was 102. Figure 44c shows that 93th-
194th amino acids of the reference genome DL and 95th-196th amino acids of Jugal DL
possess similar protein structure and constitute the core of alignment. In Figure 45c, the top
row of the alignment showed Jugal DL amino acid sequences, while the bottom row showed
amino acid sequences of the reference genome DL.
Figure 45. Alignment of DL protein structure of Jugal and the reference genome.
76Results
3.6. Expression study of floral organ developmental genes
3.6.1. Expression analysis by Semi-quantitative PCR
The PCR derived amplicons were resolved in 1.5% agarose gel (Figure 46a and 46b); the
variations in expression of the selected genes were estimated as variations in band intensities.
The band intensities were measured by ImageJ (Rueden et al. 2017). The Figure 46a
represents expression of DL, FON1, and OsMADS3 genes from both Jugal and IR36; whereas
expression of OsMADS13, OsMADS58, and UBIQUITIN genes are presented in Figure 46b.
The band intensities of Jugal DL and OsMADS3 genes are higher when compared with the
IR36 DL and OsMADS3 genes; whereas, for FON1 gene, there were no detectable bands
observed (Figure 7a). Figure 46b shows that the expression of Jugal OsMADS13 gene is quite
higher when compared with IR36 OsMADS13; although the expression of OsMADS58 gene
both from Jugal and IR36 are very low and merely visible, still bands for Jugal OsMADS58
has batter band intensities than that of IR36 OsMADS58. The expression of Jugal
UBIQUITIN is higher in comparison to IR36 UBIQUITIN as indicated by band intensities.
Figure 46c shows ImageJ analysis of DL, FON1, and OsMADS3 genes and 46d shows
OsMADS13, OsMADS58, and UBIQUITIN genes. The values of each band that were
generated by ImageJ are presented at the base of every band in Figure 46c and Figure 46d.
Figure 46. Semi-quantitative PCR derived amplicons resolved in 1.5% agarose gel. a DL,
FON1, and OsMADS3 genes of Jugal and IR36. b OsMADS13, OsMADS58, and UBIQUITIN
genes of Jugal and IR36. c Study of DL, FON1, and OsMADS3 genes of Jugal and IR36 by
ImageJ. d Study of OsMADS13, OsMADS58, and UBIQUITIN genes of Jugal and IR36 by
ImageJ.
77Results
3.6.2. Expression analysis by real time PCR
3.6.2.1. Expression analysis of OsMADS3
The expression of OsMADS3 is presented in Figure 47 which shows that the OsMADS3 gene
expression slowly increased from Sp5 to Sp6 and Sp7 developmental stages in IR36.
However, although expression of OsMADS3 was considerably low at initial developmental
stage (Sp5) in the mutant rice (Jugal), in later developmental stages, the OsMADS3 level has
increased and its expression was almost same as the normal rice at Sp6 and Sp7 stages.
Figure 47. Expression of OsMADS3 in IR36 and Jugal flowers
3.6.2.2. Expression analysis of OsMADS13
The expression of OsMADS13 is presented in Figure 48. In IR36 flower, the OsMADS13
expression level slowly decreases in Sp6 when compared with the Sp5 and then a very little
increase in expression was observed in Sp7. However, in Jugal flower OsMADS13 expression
was considerably high at Sp5 then a sudden decrease in expression was observed at Sp6 and
at Sp7 its expression increased drastically.
78Results
Figure 48. Expression of OsMADS13 in IR36 and Jugal flowers
3.6.2.3. Expression analysis of OsMADS21
Figure 49 represents expression of OsMADS21 gene. The OsMADS21 gene showed a slow
but continuous decrease in expression from Sp5 to Sp7 stage in IR36. At Sp5 stage, in Jugal
flower the expression of OsMADS21 was almost similar as that of IR36, it then shows a
decrease in expression at Sp6 and at Sp7 its expression level again increased and expressed
much higher when compared with IR36.
Figure 49. Expression of OsMADS21 in IR36 and Jugal flowers
79Results
3.6.2.4. Expression analysis of OsMADS58
The expression of OsMADS58 is the most interesting among the five selected genes and
represented in Figure 50. In IR36 its expression was higher at Sp6 than both Sp5 and Sp7.
But in case of Jugal, level of expression was almost similar of IR36 at Sp5 stage; after that a
sudden decrease in expression was observed at Sp6 stage then its expression again started to
increase and at Sp7 OsMADS58 expression was much higher when compared with the IR36.
Figure 50. Expression of OsMADS58 in IR36 and Jugal flowers
3.6.2.5. Expression analysis of DL
The expression pattern of DL gene was almost similar in both Jugal and IR36 at early stage of
floral organ development i.e. at Sp5 stage and Sp6 stage (Figure 51). However, after Sp6
stage expression of DL reduced in the normal rice (IR36) but in case of the mutant rice
(Jugal) the expression started to increase and at Sp7 the expression level was much higher in
the mutant line.
Figure 51. Expression of DL in IR36 and Jugal flowers
80You can also read