Identification of Reference Genes for Quantitative Gene Expression Studies in Three Tissues of Japanese Quail - MDPI
←
→
Page content transcription
If your browser does not render page correctly, please read the page content below
G C A T
T A C G
G C A T
           genes
Article
Identification of Reference Genes for Quantitative
Gene Expression Studies in Three Tissues of
Japanese Quail
Anaïs Vitorino Carvalho † , Nathalie Couroussé † , Sabine Crochet and Vincent Coustham *
 BOA, INRA, Université de Tours, 37380 Nouzilly, France; anais.carvalho@inra.fr (A.V.C.);
 nathalie.courousse@inra.fr (N.C.); sabine.crochet@inra.fr (S.C.)
 * Correspondence: vincent.coustham@inra.fr; Tel.: +33-247-427-923
 † These authors contributed equally to this work.

 Received: 18 January 2019; Accepted: 25 February 2019; Published: 4 March 2019

 Abstract: RT-qPCR is the gold standard for candidate gene expression analysis. However,
 the interpretation of RT-qPCR results depends on the proper use of internal controls, i.e., reference
 genes. Japanese quail is an agronomic species also used as a laboratory model, but little is known
 about RT-qPCR reference genes for this species. Thus, we investigated 10 putative reference genes
 (ACTB, GAPDH, PGK1, RPS7, RPS8, RPL19, RPL32, SDHA, TBP and YWHAZ) in three different female
 and male quail tissues (liver, brain and pectoral muscle). Gene expression stability was evaluated
 with three different algorithms: geNorm, NormFinder and BestKeeper. For each tissue, a suitable set
 of reference genes was defined and validated by a differential analysis of gene expression between
 females and males (CCNH in brain and RPL19 in pectoral muscle). Collectively, our study led to the
 identification of suitable reference genes in liver, brain and pectoral muscle for Japanese quail, along
 with recommendations for the identification of reference gene sets for this species.

 Keywords: Japanese quail; reference gene; RT-qPCR; gene expression

1. Introduction
     Japanese quail (Coturnix japonica) is the smallest avian species farmed for egg and meat production
and is a popular source of proteins in the world [1,2]. In addition to being an established model for
embryology studies [3], Japanese quail is also a popular laboratory model [4] especially for behavior [5],
genetics and genomics studies [6,7]. Females are sexually mature at 5–6 weeks of age, allowing the
production of 3 to 4 generations per year [2,8]. The complete Japanese quail genome sequence was
recently released (2016, The International Quail Genome Consortium and McDonnell Genome Institute,
Washington University School of Medicine) and inbred laboratory lines are available, thus facilitating
genome-wide studies. Together, Japanese quail can be considered as an economic and multipurpose
animal model for research [1,9].
     Since its description in 1992 [10], real-time PCR (qPCR) has been the most common technique to
quantify nucleic acid abundance for molecular diagnostics and life science research [11–14]. Indeed,
given its accuracy, reproducibility, low cost and speed as well as reduced labor, qPCR can permit
the detection and quantification of very limited copies of nucleic acid [10–14]. Thus, associated
with reverse-transcription (RT), this technique became the gold standard to evaluate gene expression.
Furthermore, now that transcriptome studies are less expensive and thus more accessible [15], RT-qPCR
is routinely used as validation tool to confirm gene expression analysis observed in microarray and
RNA-seq experiments [16]. One limitation, however, is the necessity of using reliable reference genes
that are required for the interpretation of RT-qPCR results [17].

Genes 2019, 10, 197; doi:10.3390/genes10030197                                    www.mdpi.com/journal/genes
Genes 2019, 10, 197                                                                                   2 of 12

      RT-qPCR quantification depends on various parameters in the workflow, especially RNA quality
and qPCR efficiency. To estimate these parameters and avoid bias, the use of an internal reference
is necessary to compare several samples and various experimental conditions (time points, tissues,
treatments, etc.). Thus, a reference gene is defined as non-variant gene between all samples and
all experimental conditions [17]. Among published studies, the GAPDH gene is frequently used as
a reference gene [12]. Nowadays, the normalization to a single reference gene is generally admitted as
suboptimal for accurate interpretation and the combination of multiple reference genes to mimic the
ideal reference and limit the natural variation is preferred [18–22].
      The identification of multiple reference genes has been performed in various animal species
including pig [23], cattle [24–26], dog [27] and avian species (in particular, chicken) [28–31]. Concerning
quails, although a RT-qPCR normalization based on several genes was already published, this study
was limited to an embryonic tissue, the blastoderm [32]. Thus, there is a lack of information regarding
suitable reference genes in adult quails. In the present study, we investigated 10 potential reference
genes in 3 tissues (liver, pectoral muscle and brain) in both sexes. To estimate the suitability as reference
gene of each candidate, we used the statistical tools geNorm [22], NormFinder [19] and BestKeeper [18].
Finally, we used reference genes to normalize the expression of differentially expressed genes between
both sexes. Collectively, our data allowed the identification of a set of reference genes suitable for the
analysis of gene expression in the liver, brain and pectoral muscle of Japanese quail.

2. Materials and Methods

2.1. Animal Sample Collection
     All experiments were carried out in accordance with the legislation governing the ethical treatment
of birds and were approved by the French Ministry of Higher Education and the Val-de-Loire Animal
Ethics Committee (authorisation N◦ APAFIS#4606-2016032111363124). They were performed in the
INRA UE1295 PEAT experimental facilities (Poultry Experimental Unit of Tours, Agreement N◦
C37-175-1).
     Cons DD quails (INRA) were raised in standard conditions. At 35 days of age, 10 females
and 10 males were sacrificed and liver, pectoral muscle (Pectoralis major) and brain (excluding
hypothalamus) were immediately sampled and frozen in liquid nitrogen. Samples were stored
at −80 ◦ C before the analyses.

2.2. RNA Extraction
     All tissue samples were ground in liquid nitrogen and 25 mg of powder was used for RNA
extraction using a NucleoSpin® RNA kit (Macherey-Nagel, Bethlhem, PA, USA), according to
the manufacturer’s instructions for the isolation of RNA from hard-to-lyse tissues. RNA integrity
and concentration were measured by migration on 1% agarose gel and by quantification on
a Nanodrop ND-1000 spectrophotometer, respectively. The RNA purity was verified by the analysis
of the A260/A280 ratios, which were all between 2.10 and 2.18. To avoid DNA contamination
as recommended by the Minimum Information for Publication of Quantitative Real-Time PCR
Experiments (MIQE) guidelines [17], DNAse (Ambion by Life Technologies, Carlsbad, CA, USA)
treatment was performed on 0.545 µg of total RNA according to the manufacturer’s instructions and
then RNA integrity was checked by migration on 1% agarose gel.

2.3. Reverse Transcription and Quantitative Real-Time PCR
     RT-qPCR experiments were performed following the MIQE guidelines [17].
     cDNA was synthesized from 0.5 µg of total RNA using the Superscript II enzyme (Invitrogen,
California, CA, USA) and random hexamer primers (Promega, Fitchburg, WI, USA) in a final volume
of 20 µL, following the manufacturer’s instructions.
Genes 2019, 10, 197 3 of 12
Gene expression was evaluated in each tissue independently. Primer sequences were designed
following the MIQE guidelines [17] with NCBI Primer blast (https://www.ncbi.nlm.nih.gov/tools/
primer-blast/index.cgi?LINK_LOC=BlastHome; Table 1). All primers were designed and tested for
an annealing temperature of 60 ◦ C. The absence of primer secondary structure was checked using
OligoEvaluator (Sigma-Aldrich, Saint-Quentin Fallavier, France, http://www.oligoevaluator.com/).
qPCR reactions were performed in a final volume of 10 µL (2.5 µL of RT dilution, 2 µL of water, 5 µL of
Takyon mix, 0.25 µL of each primer at 10 µM) with a Takyon qPCR kit (Eurogentec, Liège, Belgium)
and using a LightCycler® 480 Instrument II system (Roche, Basel, Switzerland) in white 384-well plates
(4titude, Surrey, UK) sealed by adhesive films. A standard curve analysis was performed by pooling
all cDNA samples (serial dilution from 1/10 to 1/5000 in water; eight measured points) to calculate
the PCR efficiency and the correlation coefficient of each primer pair in each tissue independently.
Reactions were performed on two technical replicates. A denaturation step (5 min at 95 ◦ C) was
followed by an amplification step with 45 cycles of 10 s at 95 ◦ C, 20 s at 60 ◦ C and 10 s at 72 ◦ C.
To ensure the presence of only one amplicon, melting curves were produced by gradually increasing
the reaction temperature from 65 ◦ C to 95 ◦ C (5 s at 95 ◦ C, 1 min at 65 ◦ C, heating to 95 ◦ C at a rate of
0.11 ◦ C/s) (Supplementary Figures S1–S3). Furthermore, the presence of a unique amplicon and its
size were checked on a 2% agarose gel. The amplicon sequence was verified by Sanger sequencing
(Genewiz, Leipzig, Germany) and then blasted on the NCBI database of quail transcripts (genome:
Coturnix japonica 2.0). To ensure the absence of primer dimers, negative control was analyzed as
a no-template sample for which cDNA was replaced by water.
Table 1. Primers used in the study. F: forward primer. R: reverse primer.
Gene Accession Amplicon
Gene Name Primer (50 –30 )
Symbol Number Size (bp)
F: TGACCGCGGTACAAACACAG
ACTB Actin β XM_015876619.1 167
R: CATACCAACCATCACACCCTGA
F: GTCTGTAGTGGGAACGGCTT
CCNH Cyclin H XM_015849748.1 177
R: TGTCCAACAGGGCTTTCTCG
Glyceraldehyde-3-phosphate F: TCTCTGTTGTTGACCTGACCTG
GAPDH XM_015873412.1 154
dehydrogenase R: ATGGCTGTCACCATTGAAGTC
F: CAAGCTCACCCTGGACAAGT
PGK1 Phosphoglycerate kinase 1 XM_015860450.1 119
R: GGACGGCTGCCTTGATTCTT
F: GCATCGGTAAGAGGAAGGGT
RPL19 Ribosomal protein L19 XM_015885843.1 163
R: ACGTTGCCCTTGACCTTCAG
F: ATGGGAGCAACAAGAAGACA
RPL32 Ribosomal protein L32 XM_015875135.1 139
R: TTGGAAGACACGTTGTGAGC
F: TGTGGTGTTCATTGCTCAGAGA
RPS7 Ribosomal protein S7 XM_015859359.1 179
R: TGCCATCCAGTTTTACGCGG
F: GCTGACACCTGAGGAAGAAGA
RPS8 Ribosomal protein S8 XM_015870342.1 196
R: CTTGCCTTCCAACACGTAGC
Succinate dehydrogenase complex, F: TACGGGAAGGAAGGGGTTGT
SDHA XM_015854268.1 167
subunit A R: CACAGTAGGCAGAACGGGAA
F: CCGGAATCATGGATCAGAAC
TBP TATA box binding protein XM_015857924.1 85
R: GGAATTCCAGGAGTCATTGC
Tyrosine 3-monooxygenase/tryptophan F: CGAACAAAAGACGGAAGGCG
YWHAZ XM_015856086.1 154
5-monooxygenase activation protein zeta R: AACTTTGCTTTCTGCTTGCGA
The analysis of standard curves revealed that a 200-fold dilution of RT was suitable for the gene
expression analysis of all primer pairs. qPCR reactions for gene expression evaluation were performed
in the same conditions as those previously described (including the presence of a no-template sample).
Reactions were performed on three technical replicates. The Cq (quantification cycle) was determined
as the average of the three technical replicates [17]. As recommended [17], no Cq >40 was included in
the analysis. Gene expression evaluation was considered as correct when the Cq identified for each
sample was included in the linear dynamic range determined for each primer pairs, in each consideredGenes 2019, 10, 197 4 of 12
tissue. A pooled sample (i.e., a pool of all samples in a given tissue) at the same dilution of cDNA
samples (i.e., 200-fold diluted) was used to calculate gene expression with the comparative Cq (∆Cq)
method: 2(Cq pool-Cq sample) .
2.4. Gene Stability Analyses
A gene was considered stable if its expression was equivalent in all the studied
samples [17–19,21,22]. The gene stability was investigated with three different algorithms: geNorm [22],
NormFinder [19] and BestKeeper [18]. The analyses with geNorm (version 3.5) and NormFinder
(version 0.953) were performed on ∆Cq and the analysis with BestKeeper (version 1.0) was performed
on raw Cq as input. As recommended, a gene was considered stable when its stability value wasGenes 2019, 10, 197 5 of 12
3.2. Impact of Sex on the Expression of Putative Reference Genes
The impact of the sex on reference genes was analyzed in each tissue separately. The expression
of each putative reference gene was calculated with the ∆Cq method using a pool of all cDNA samples
relative to one specific tissue as a reference. In liver and brain, no impact of the sex was observed for all
genes tested (Table 3). RPL19, RPL32 and RPS8 were significantly impacted by the sex in the pectoral
muscle (with respective p-values of 0.032, 0.05 and 0.017) and RPS7 showed a tendency to be affected
by the sex (p-value = 0.057). These four genes were removed from the analysis for muscle tissue.
Table 3. p-values from t-test investigation of the impact of sex on reference gene expression.
Gene Liver Brain Muscle
ACTB 0.099 0.213 0.751
GAPDH 0.363 0.254 0.800
PGK1 0.461 0.177 0.575
RPL19 0.780 0.726 0.032
RPL32 0.242 0.805 0.050
RPS7 0.775 0.635 0.057
RPS8 0.524 0.636 0.017
SDHA 0.829 0.401 0.258
TBP 0.916 0.322 0.155
YWHAZ 0.893 0.631 0.182
3.3. Definition of the Most Stable Gene
Gene stability was studied using three different algorithms: geNorm, NormFinder and BestKeeper.
In liver, all genes tested were defined as stable because the stability values were below the
recommendations (i.e., 1.5 for geNorm and 0.25 for NormFinder). Furthermore, the stability ranks
defined by the three algorithms were very close and indicated ACTB as the least stable gene (Figure 1).
RPS8 and RPL19 were the most stable genes according to geNorm and NormFinder. In brain, all genes
passed the stability criteria (Figure 1). GAPDH was identified as the most stable gene by geNorm
and BestKeeper, whereas SDHA was the most stable for NormFinder (Figure 1). In pectoral muscle,
the analysis performed with NormFinder revealed that the GAPDH stability value was higher than
the recommended value of 0.25, leading to its exclusion as a reference gene (Figure 1). The analysis
performed with geNorm also indicated GAPDH as the least stable gene whereas the analysis based on
BestKeeper revealed ACTB as the least stable gene. Nevertheless, all algorithms indicated YWHAZ as
the most stable gene for this tissue (Figure 1).
3.4. Identification of the Combination of the Most Stable Genes
Whereas the BestKeeper algorithm is used to define the best reference gene, NormFinder can
define the combination of the two most stable reference genes in terms of geometric mean. In contrast,
geNorm can be used to define the most stable combination of two or more reference genes. To gain
insight into the similarities between NormFinder and geNorm, the most stable combinations of
two reference genes defined by each algorithm were compared.
NormFinder revealed that the most stable pair of reference genes was GAPDH and RPS8 for
liver samples, PGK1 and RPL32 for brain samples and PGK1 and ACTB for muscle samples (Table 4).
Among all suitable genes, geNorm identified RPL19 and RPS8 as having the lowest stability values for
liver samples, PGK1 and GAPDH for brain samples and SDHA and TBP for muscle samples (Figure 2).Genes 2019, 10, 197 6 of 12
Figure
Figure 1. 1. Stability
Stability values
values of of reference
the putative the putative reference
genes defined genes defined
by three algorithms by three and
(geNorm, NormFinder algorithms (geNorm,
BestKeeper) for each tissue.
NormFinder and BestKeeper) for each tissue.Genes 2019, 10, 197 7 of 12
Table 4. Reference gene combination defined by NormFinder.
Liver Brain Muscle
Gene combination GAPDH and RPS8 PGK1 and RPL32 PGK1 and ACTB
Stability value 0.026 0.022 0.047
The geNorm algorithm allows the definition of the optimal combination of genes required for
normalization. Therefore, we searched the optimal number of genes that was necessary for accurate
normalization (Figure 2, green boxes, and Figure 3). The analysis revealed that the pairwise variation
was the smallest with a combination of nine genes for the liver (all but ACTB) and all genes for the brain.
For muscle tissue, five genes (SDHA, TBP, PGK1, YWHAZ and ACTB) were usable for normalization
(Figure
Genes 2019,3).
10, x FOR PEER REVIEW 2 of 3
Figure 2. Reference gene combinations suitable for normalization defined by geNorm. The two most
stable genes defined by geNorm are shown with one below the other at the right side of the graph.
The green boxes indicate the combination of reference genes suitable for normalization as defined by
geNorm. The blue boxes correspond to the genes defined as the most stable combination by NormFinder
software. The yellow boxes correspond to the best reference genes selected by BestKeeper algorithm.Genes 2019, 10, 197 8 of 12
Genes 2019, 10, x FOR PEER REVIEW 3 of 3
Figure 3. Analysis of the optimal number of reference genes for RT-qPCR normalization obtained by
geNorm software. Pairwise variation (Vn/n+1) analysis was performed between the normalization
factors (NF) NF n and NF n + 1. Each tissue was analyzed independently.
3.5. Validation of Reference Genes
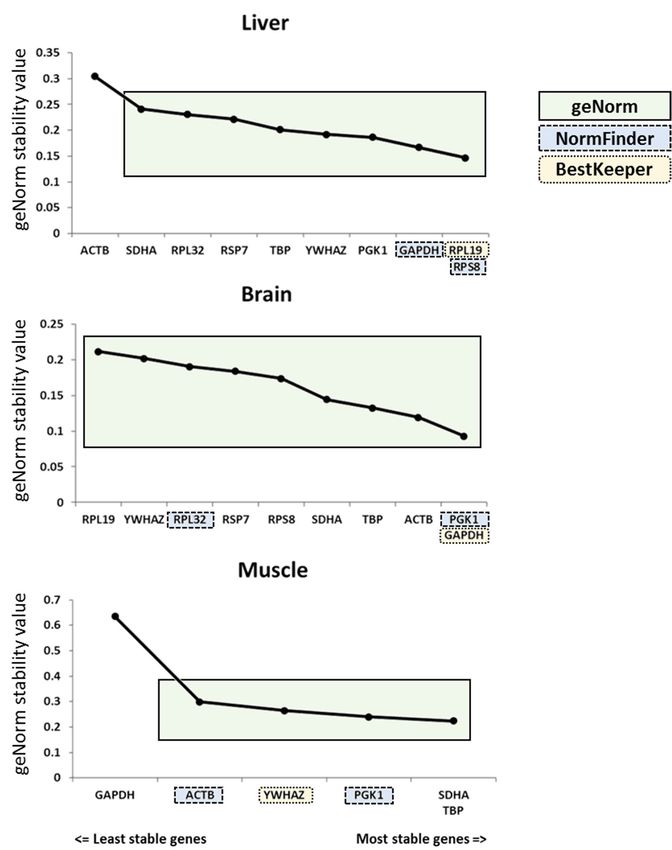
To validate the reference gene groups defined by the three methods, we analyzed the expression
of genes known to be differentially expressed between females and males (Figure 4). Two genes were
selected, one for the brain based on the literature [2] (CCNH) and one for the muscle based on our
previous analysis (RPL19; Table 3). Each gene was normalized with the reference gene group defined
by each algorithm (Figure 2). We found that the expression of CCNH was significantly higher in female
brains compared to male brains with all reference gene sets, with a fold-change >2 (Figure 4). In muscle,
RPL19 expression was significantly lower in males when using reference genes defined by geNorm
and NormFinder with a fold-change of ~0.80 but not by that suggested by BestKeeper (Figure 4).Genes 2019, 10, 197 9 of 12
Figure 4. Expression of candidate genes normalized by each algorithm (geNorm, NormFinder and
BestKeeper) in female (F) and male (M) quails. The expression of CCNH and RPL19 was investigated in
brain and in pectoral muscle, respectively. The reference genes defined by BestKeeper were GAPDH
and YWHAZ in brain and in muscle, respectively. The combination of two reference genes identified by
NormFinder was PGK1 and RPL32 in brain and PGK1 and ACTB in muscle. The geNorm normalization
factor was used, based on GAPDH, ACTB, PGK1, TBP, SDHA, RPS8, RPS7, RPL32, YWHAZ and RPL19
in brain and YWHAZ, TBP, PGK1, SDHA and ACTB in muscle. * p value ≤ 0.05, **** p-value ≤ 0.0001.
4. Discussion
The analysis of gene expression is a common measurement in molecular studies and the current
gold standard protocol is RT-qPCR [10–14]. However, the reliability of the results depends of the
normalization. The choice of suitable reference genes is essential to allow the comparison of multiple
samples [17]. Here, we defined and analyzed the stability of 10 putative reference genes in female and
male Japanese quails in three different tissues (liver, brain and pectoral muscle).
Based on the reference genes described in other animal model species [21,23–25,27–31,34], a set of
10 putative reference genes was defined (ACTB, GAPDH, PGK1, RPS7, RPS8, RPL19, RPL32, SDHA,
TBP, YWHAZ; Table 1). The accuracy and efficiency of each primer couple were verified using serial RT
dilutions (Table 2), melting curves (Supplementary Figures S1–S3) and Sanger sequencing for each
tested tissue. All primers were suitable to analyze the transcript accumulation of their associated genes
in all tissues (Table 2).
The definition of reference genes has to take into account the effects studied such as sex
(present study), aging, chemical treatment, disease or nutrition, among other factors [19,21,22].
Since we aimed to validate the reference genes by comparing the expression of candidate genes
affected by the sex, we investigated the impact of sex on the raw expression of our putative reference
genes. Whereas no effect of sex was observed for all genes tested in liver and brain, RPL19, RPL32 and
RPS8 were significantly impacted in muscle and RPS7 showed a tendency to be affected by the sex
(p = 0.057; Table 3). Therefore, RPL19, RPL32, RPS7 and RPS8 genes may be considered only if the sex
is unvarying. For instance, in another avian species, RPL32 was reported as a suitable reference gene
for breast muscle tissue of hens [29]. However, our analysis led to its exclusion as a reference gene.
To assess reference gene stability, various algorithms are available. In this study, we used
three different approaches based on the most cited algorithms in the literature [24,28]: geNorm [22],
NormFinder [19] and BestKeeper [18]. In liver and brain, all candidate reference genes were identified
as stable by all algorithms. However, in pectoral muscle, GAPDH was the least stable reference geneGenes 2019, 10, 197 10 of 12
despite being described as a popular reference gene [12], leading to its exclusion as a reference gene
in our study. Interestingly, our analysis showed that the most stable genes differed across tissues,
confirming that a characterization of reference genes should be performed for each tissue of interest.
Interestingly, no gene defined as the most stable was shared among all tissues, thus confirming the
importance of the validation requirement for each experimental model [21]. Furthermore, the analysis
of the stability ranks obtained with all three algorithms revealed that the rankings obtained with
geNorm and NormFinder were closer in liver and pectoral muscle than that obtained with BestKeeper
(Figure 1). This can be explained by the fact that both geNorm and NormFinder use ∆Cq, in contrast
to BestKeeper based on raw Cq [18]. This difference is in agreement with the previously reported
similarity between geNorm and NormFinder in chicken [29]. Interestingly, this similarity is less clear
for brain tissue, where the stability ranking of candidate reference genes differed between the three
algorithms (Figure 1). This is likely due to the small variations of stability values obtained for each
candidate reference gene.
We validated the defined sets of genes by investigating their impact on the gene expression
analysis of genes known to be differential between female and male quails. We analyzed CCNH,
reported in the literature as sex-differential in adult quail brain samples [2], and RPL19, for which the
analysis of the raw Cq revealed an impact of the sex in our experimental model in pectoral muscle
(Table 3). The expression of CCNH was higher in male brains (more than 2-fold) compared to female
brains regardless of the normalization method. Interestingly, the RPL19 mRNA level was significantly
lower in male muscles when geNorm and NormFinder methods were used (about ~0.8-fold), but not
when BestKeeper normalization was performed. Given that the most gene stable gene was the same
(YWHAZ) for all three algorithms in this tissue, this suggests that this difference is likely due to the
number of genes used in the normalization. This is consistent with previous findings showing that at
least two genes are advised when the differential studied is expected to be subtle [22]. Thus, our data
supports the fact that multiple reference genes should be used to reveal low variations of candidate
gene expression.
Based on stability values, our analysis showed that all 10 reference genes revealed by geNorm
could be used to normalize gene expression in liver and brain in our biological context. For muscle
tissue, five genes were shown to be suitable for normalization according to stability values.
Our analysis also confirmed the similarity of results between NormFinder and geNorm, leading
to the recommendation to use at least two reference genes to calculate the normalization factor.
Thus, in our biological context, our data revealed that GAPDH and RPS8 can be considered as good
reference genes for liver samples, PGK1 and RPL32 for brain samples and PGK1 and ACTB for pectoral
muscle samples. The geNorm algorithm led to the identification of combinations of more reference
genes in the three tissues that might of interest to reveal subtler gene expression changes, or that could
be used in more complex biological setups. Nevertheless, we recommend performing a comprehensive
reference gene analysis such as the one presented here each time a new experimental setup is used.
5. Conclusions
Our study is the first attempt to identify reference genes in three tissues (liver, brain and muscle) of
Japanese quail. As previously described in other species, our data revealed that the choice of reference
genes highly depends on the experimental design as well as the algorithms used, and this requires
fine-tuning. Nevertheless, our data describe suitable reference genes for brain, liver and pectoral
muscle analyses in adult quails, leading to the recommendation to use NormFinder or geNorm as
identification methods of reference genes and confirming the use of at least two reference genes to
reveal subtle changes of candidate gene expression. This report could therefore be used as a guideline
for the identification of reference gene sets in order to reinforce the reliability of RT-qPCR results.
Supplementary Materials: The following are available online at http://www.mdpi.com/2073-4425/10/3/197/s1,
Figure S1: Specificity of primers tested by qRT-PCR in liver; Figure S2: Specificity of primers tested by qRT-PCR in
pectoral muscle (Pectoralis major); Figure S3: Specificity of primers tested by qRT-PCR in brain.Genes 2019, 10, 197 11 of 12
Author Contributions: A.V.C., N.C. and V.C. designed the experiments; N.C. and S.C. performed the experiments;
A.V.C., N.C. and V.C. analyzed the results; A.V.C., N.C. and V.C. wrote the manuscript. All authors read and
approved the final manuscript.
Funding: This study was supported by the ANR JCJC “QuailHeatE” Research Program (ANR-15-CE02-0009-01).
Acknowledgments: The authors are grateful to all the members of the MOQA team at INRA for assistance with
sample collection and to the staff of the Poultry Experimental Unit of Tours (PEAT, INRA, Nouzilly, France) for
animal care and management.
Conflicts of Interest: The authors declare no conflict of interest.
References
1. Abd El-Gawad, A.E.A.; El-Wardany, I.; El-Daly, E.F.; Abd El-Azeem, N.A.; Hemid, A.H. Alleviating the Effect
of Some Environmental Stress Factors on Productive Performance in Japanese Quail 1. Growth Performance.
World J. Agric. Sci. 2008, 4, 605–611.
2. Caetano-Anolles, K.; Seo, M.; Rodriguez-zas, S.; Oh, J.; Han, J.Y.; Lee, K.; Park, T.S.; Shin, S.; Jiao, Z.J.;
Ghosh, M.; et al. Comprehensive Identification of Sexual Dimorphism-Associated Differentially Expressed
Genes in Two-Way Factorial Designed RNA-Seq Data on Japanese Quail (Coturnix coturnix japonica).
PLoS ONE 2015, 10, e0139324.
3. Le Douarin, N. A biological cell labeling technique and its use in experimental embryology. Dev. Biol. 1973,
30, 217–222. [CrossRef]
4. Huss, D.; Poynter, G.; Lansford, R. Japanese quail (Coturnix japonica) as a laboratory animal model. Lab Anim.
2008, 37, 513–519. [CrossRef] [PubMed]
5. Pusch, E.A.; Bentz, A.B.; Becker, D.J.; Navara, K.J. Behavioral phenotype predicts physiological responses to
chronic stress in proactive and reactive birds. Gen. Comp. Endocrinol. 2018, 255, 71–77. [CrossRef] [PubMed]
6. Recoquillay, J.; Pitel, F.; Arnould, C.; Leroux, S.; Dehais, P.; Moreno, C.; Calandreau, L.; Bertin, A.;
Gourichon, D.; Bouchez, O.; et al. A medium density genetic map and QTL for behavioral and production
traits in Japanese quail. BMC Genom. 2015, 16, 10. [CrossRef] [PubMed]
7. Kawahara-Miki, R.; Sano, S.; Nunome, M.; Shimmura, T.; Kuwayama, T.; Takahashi, S.; Kawashima, T.;
Matsuda, Y.; Yoshimura, T.; Kono, T. Next-generation sequencing reveals genomic features in the
Japanese quail. Genomics 2013, 101, 345–353. [CrossRef] [PubMed]
8. Alkan, S.; Karsli, T.; Karabag, K.; Galic, A.; Balcioglu, M.S. The effects of thermal manipulation during
early and late embryogenesis on hatchability, hatching weight and body weight in Japanese quails
(Coturnix coturnix japonica). Arch. Tierzucht 2013, 56, 789–796. [CrossRef]
9. Ozcelik, M.; Ozbey, O. The effect of the high environmental temperature on some blood parameters and the
laying performance of Japanese quails with different body weights* (short communication). Arch. Anim. Breed.
2004, 47, 93–98. [CrossRef]
10. Higuchi, R.; Dollinger, G.; Sean Walsh, P.; Griffith, R. Simultaneous amplification and detection of specific
DNA sequences. Bio/Technology 1992, 10, 413–417. [CrossRef] [PubMed]
11. Wittwer, C.T.; Herrmann, M.G.; Moss, A.A.; Rasmussen, R.P. Continuous Fluorescence Monitoring of Rapid
Cycle DNA Amplification. Biotechniques 2013, 54, 314–320. [CrossRef] [PubMed]
12. Bustin, S.A. Absolute quantification of mrna using real-time reverse transcription polymerase chain reaction
assays. J. Mol. Endocrinol. 2000, 25, 169–193. [CrossRef] [PubMed]
13. Kubista, M.; Andrade, J.M.; Bengtsson, M.; Forootan, A.; Jonák, J.; Lind, K.; Sindelka, R.; Sjöback, R.;
Sjögreen, B.; Strömbom, L.; et al. The real-time polymerase chain reaction. Mol. Aspects Med. 2006, 27, 95–125.
[CrossRef] [PubMed]
14. Higuchi, R.; Fockler, C.; Dollinger, G.; Watson, R. Kinetic PCR analysis: Real-time monitoring of DNA
amplification reactions. Nat. Biotechnol. 1993, 11, 1026–1030. [CrossRef]
15. David, S.-A.; Mersch, M.; Foissac, S.; Collin, A.; Pitel, F.; Coustham, V. Genome-Wide Epigenetic Studies in
Chicken: A Review. Epigenomes 2017, 1, 20. [CrossRef]
16. Git, A.; Dvinge, H.; Salmon-Divon, M.; Osborne, M.; Kutter, C.; Hadfield, J.; Bertone, P.; Caldas, C.
Systematic comparison of microarray profiling, real-time PCR, and next-generation sequencing technologies
for measuring differential microRNA expression. RNA 2010, 16, 991–1006. [CrossRef] [PubMed]Genes 2019, 10, 197 12 of 12
17. Bustin, S.A.; Benes, V.; Garson, J.A.; Hellemans, J.; Huggett, J.; Kubista, M.; Mueller, R.; Nolan, T.; Pfaffl, M.W.;
Shipley, G.L.; et al. The {MIQE} Guidelines: Minimum Information for Publication of Quantitative {Real-Time}
{PCR} Experiments. Clin. Chem. 2009, 55, 611–622. [CrossRef] [PubMed]
18. Pfaffl, M.W.; Tichopad, A.; Prgomet, C.; Neuvians, T.P. Determination of stable housekeeping genes,
differentially regulated target genes and sample integrity: BestKeeper–Excel-based tool using pair-wise
correlations. Biotechnol. Lett. 2004, 26, 509–515. [CrossRef] [PubMed]
19. Andersen, C.L.; Jensen, J.L.; Ørntoft, T.F. Normalization of real-time quantitative reverse transcription-PCR
data: A model-based variance estimation approach to identify genes suited for normalization, applied to
bladder and colon cancer data sets. Cancer Res. 2004, 64, 5245–5250. [CrossRef] [PubMed]
20. Perkins, J.R.; Dawes, J.M.; McMahon, S.B.; Bennett, D.L.H.; Orengo, C.; Kohl, M. ReadqPCR and NormqPCR:
R packages for the reading, quality checking and normalisation of RT-qPCR quantification cycle (Cq) data.
BMC Genom. 2012, 13, 296. [CrossRef] [PubMed]
21. De Spiegelaere, W.; Dern-Wieloch, J.; Weigel, R.; Schumacher, V.; Schorle, H.; Nettersheim, D.; Bergmann, M.;
Brehm, R.; Kliesch, S.; Vandekerckhove, L.; et al. Reference gene validation for RT-qPCR, a note on different
available software packages. PLoS ONE 2015, 10, e0122515. [CrossRef] [PubMed]
22. Vandesompele, J.; De Preter, K.; Pattyn, F.; Poppe, B.; Van Roy, N.; Van Roy, A.; Speleman, F. Accurate
normalization of real-time quantitative RT-PCR data by geometric averaging of multiple internal control
genes. Genome Biol. 2002, 3. [CrossRef]
23. McBryan, J.; Hamill, R.M.; Davey, G.; Lawlor, P.; Mullen, A.M. Identification of suitable reference genes for
gene expression analysis of pork meat quality and analysis of candidate genes associated with the trait drip
loss. Meat Sci. 2010, 86, 436–439. [CrossRef] [PubMed]
24. Robinson, T.L.; Sutherland, I.A.; Sutherland, J. Validation of candidate bovine reference genes for use with
real-time PCR. Vet. Immunol. Immunopathol. 2007, 115, 160–165. [CrossRef] [PubMed]
25. Bonnet, M.; Bernard, L.; Bes, S.; Leroux, C. Selection of reference genes for quantitative real-time PCR
normalisation in adipose tissue, muscle, liver and mammary gland from ruminants. Animal 2013, 7,
1344–1353. [CrossRef] [PubMed]
26. Walker, C.G.; Meier, S.; Mitchell, M.D.; Roche, J.R.; Littlejohn, M. Evaluation of real-time PCR endogenous
control genes for analysis of gene expression in bovine endometrium. BMC Mol. Biol. 2009, 10, 100. [CrossRef]
[PubMed]
27. Brinkhof, B.; Spee, B.; Rothuizen, J.; Penning, L.C. Development and evaluation of canine reference genes for
accurate quantification of gene expression. Anal. Biochem. 2006, 356, 36–43. [CrossRef] [PubMed]
28. Olias, P.; Adam, I.; Meyer, A.; Scharff, C.; Gruber, A.D. Reference genes for quantitative gene expression
studies in multiple avian species. PLoS ONE 2014, 9, e99678. [CrossRef] [PubMed]
29. Bages, S.; Estany, J.; Tor, M.; Pena, R.N. Investigating reference genes for quantitative real-time PCR analysis
across four chicken tissues. Gene 2015, 561, 82–87. [CrossRef] [PubMed]
30. De Boever, S.; Vangestel, C.; De Backer, P.; Croubels, S.; Sys, S.U. Identification and validation of housekeeping
genes as internal control for gene expression in an intravenous LPS inflammation model in chickens.
Vet. Immunol. Immunopathol. 2008, 122, 312–317. [CrossRef] [PubMed]
31. Yue, H.; Lei, X.W.; Yang, F.L.; Li, M.Y.; Tang, C. Reference gene selection for normalization of PCR analysis in
chicken embryo fibroblast infected with H5N1 AIV. Virol. Sin. 2010, 25, 425–431. [CrossRef] [PubMed]
32. De Winter, P.; Sugden, D.; Baggott, G.K. Effect of egg turning and incubation time on carbonic anhydrase
gene expression in the blastoderm of the Japanese quail (Coturnix c. japonica). Br. Poult. Sci. 2008, 49, 566–573.
[CrossRef] [PubMed]
33. RStudio. RStudio: Integrated development environment for R (Version 0.97.311). J. Wildl. Manag. 2011, 75,
1753–1766.
34. Liu, L.L.; Zhao, H.; Ma, T.F.; Ge, F.; Chen, C.S.; Zhang, Y.P. Identification of valid reference genes for the
normalization of RT-qPCR expression studies in human breast cancer cell lines treated with and without
transient transfection. PLoS ONE 2015, 10, e0117058. [CrossRef] [PubMed]
© 2019 by the authors. Licensee MDPI, Basel, Switzerland. This article is an open access
article distributed under the terms and conditions of the Creative Commons Attribution
(CC BY) license (http://creativecommons.org/licenses/by/4.0/).You can also read