Access to railway stations and its potential in increasing rail use
←
→
Page content transcription
If your browser does not render page correctly, please read the page content below
Access to railway stations and its potential in increasing rail use
                                              Martijn Brons
                                              Moshe Givoni*
                                              Piet Rietveld

                   The Department of Spatial Economics, The Free University
                          De Boelelaan 1105, 1081 HV, Amsterdam
                                      The Netherlands

Abstract
The propensity to travel by rail, and not for example by car, can be considered to be a factor of the rail
service offered, the access to it and the characteristics of the population served. Efforts to increase rail use
usually focus on the rail service itself while the accessibility of the rail network receives less attention. In
this context, the paper has two broad aims. First, to evaluate how important the ‘access-to-the-station’ part
of a rail journey is to passengers in their overall satisfaction with the rail journey and second, to investigate
the balance between characteristics of the service, the access to it and the population served in determining
rail use in different parts of the rail network. The analysis is carried out for the Netherlands. To achieve the
first aim, we use the Dutch Railways customer satisfaction survey and apply principal component analysis
and derived importance techniques to assess the relative importance of accessibility in determining the
overall satisfaction with the rail journey. For the second aim, we use regression analysis to explain, at the
Dutch postcode level, the propensity to use rail. We find that satisfaction with the level and quality of the
access to the station is an important dimension of the rail journey which influences the overall satisfaction
from that journey and that the quality and level of accessibility is an important element in explaining rail
use. The conclusion reached is that in many parts of the rail network improving and expanding access
services to the railway station can substitute for improving and expanding the services provided on the rail
network and that it is probably more cost efficient when the aim is to increase rail use. These parts of the
network are mainly in the periphery where the current level of rail service is relatively low.

1. Introduction
Rail transport experienced a rapid decline at the second half of the 20th century, mainly
due to developments in road and air transport, and policy makers aim to reverse this
trend. At the same time, as privatization of rail operation gains pace, commercial
considerations also act to promote the use of rail. From a policy perspective, the aim is
not necessarily to increase travel by rail, but to change the choice mode of travellers from
to rail once they have decided to travel. The EU Transport White Paper explicitly stated
that “rail transport is literally the strategic sector, on which the success of the efforts to
shift the balance [from private to public modes] will depend” (CEC, 2001: 13).

To achieve this objective, efforts are made to improve the level of rail service offered
mainly in terms of wider network coverage, lower travel times and higher service
reliability. Such efforts focus on the actual rail journey. Another option to increase rail
use is to make rail services more accessible, using similar means: wider geographical

*
 Corresponding author: Phone: +44-1865-285545; Fax: +44-1865-275885; Email:
moshe.givoni@ouce.ox.ac.uk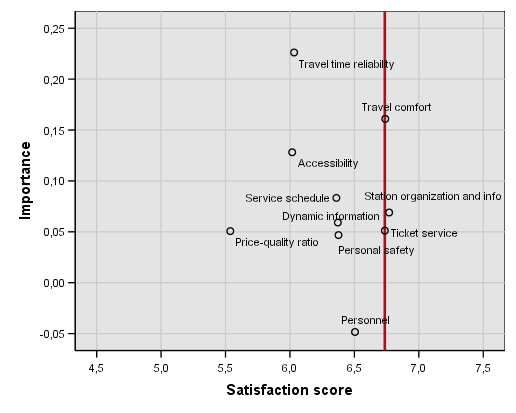
2
coverage of access services, lower travel times to the railway station and better quality of
service on travel to and from the station and at the interchange point between the modes
used to get to/from the station and the rail mode.
Findings from past research on access to railway stations, multimodal public transport
and on the inconvenience associated with the need to change vehicles during a journey
(transfer) all indicate that the accessibility of the railway station can be a factor in
determining if rail is chosen as a travel alternative (Hine and Scott, 2000; Krygsman et
al., 2004; Wardman and Hine, 2000; and Wardman and Tyler, 2000). Keijer and Rietveld
(2000), Rietveld (2000) and Givoni and Rietveld (2007) investigated the access journey
of rail travelers to the railway stations, focusing on the choice of travel mode for this
journey and how it changes, for example with distance to the station. This paper
continues the line of research on access journeys to railway stations and it has two aims.
First, to establish how important passengers perceive the access to the railway station to
be in their overall satisfaction with the rail journey. Second, to investigate the role of the
railway station accessibility in the propensity to use rail (and not for example the car) by
estimating the balance between the rail service offered, the access to railway stations and
the characteristics of the population served in affecting rail use. The Dutch rail network is
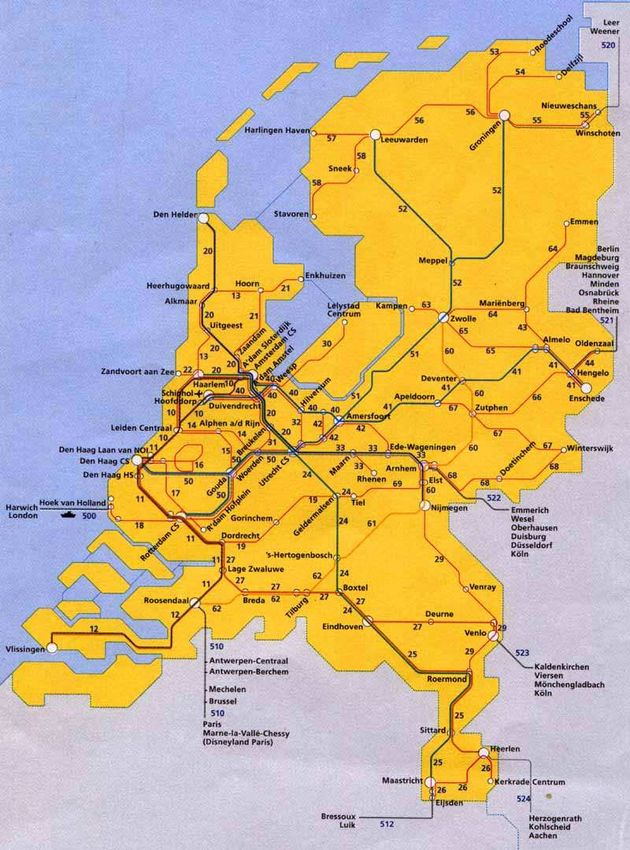
used as a case study and a short description of this network is provided below.
Figure 1 about here
The Dutch rail network consists of over 350 stations covering most of the country as can
be seen in Figure 1. This network consists of 2812 km of lines in 2003, almost the same
as in 1990 - 2798 km, up from 1980 – 2760 km and down from 1970 – 3148 km. In terms
of density, it has 68 meters of lines for every square-km. This is higher than the EU15
and EU25 average of 50 and 47 m/km2 respectively, but lower than countries like, for
example, the Czech Republic (122) and Belgium (115) (EC, 2005). The wide coverage of
the Dutch rail network is represented by the fact that the mean distance of residents to the
nearest railway station is about 4.5 km and the mode of the distribution is about 1.3 km
only. Just 8.4% of the population lives further away from the nearest railway station than
10.0 km (Keijer and Rietveld, 2000). Despite these qualities of the rail network, only
8.2% of the passenger-km traveled in the Netherlands by passenger car, rail, bus & coach
and tram & metro are carried by rail, still better than the EU25 and EU15 average of
6.5% and 6.3% respectively (EC, 2005). Rail share in the modal split of land transport
varies depending on the modes included and the area considered, an analysis at the Dutch
municipality level is shown in Table 1. Rail is usually considered as an option for long
distance travel and for journeys between cities and therefore, for the purposes of this
research, the share of rail is considered as its share of the journeys made by rail and car1.
On average 3.08 trips per day are made by each person in the Netherlands, of these 0.06
trips are made by rail, compared to 1.51 which are made by car (Table 1).
Table 1 about here
1
Intercity bus and coach services play only a minor role in this transport market in the Netherlands.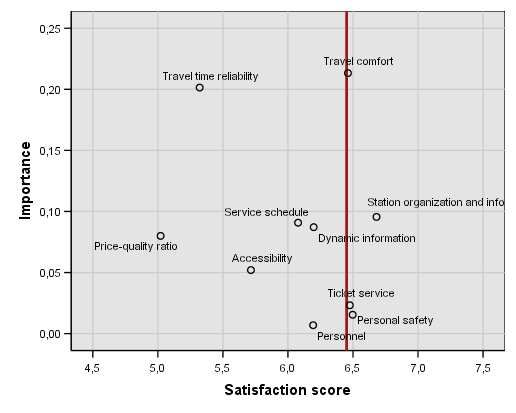
3

The remainder of the paper consists of three parts. In Section 2, the importance of the
satisfaction with the access facilities in determining passengers' satisfaction with the rail
journey is analyzed. In section 3, the potential to increase rail use through improvements
to the accessibility of the railway station is investigated. The paper concludes, in section
4, with discussion on the implications of the findings for the development of the (Dutch)
rail network.

2. The perceived importance of the access to the railway station in the
overall satisfaction with the rail journey
In order to analyze how important passenger perceive the access to the railway station to
be, in their overall satisfaction with the rail journey, we use a customer satisfaction
survey which is conducted on a regular basis by the Dutch rail operator NS2. The survey
contains inter alia 37 questions on the satisfaction with different elements of the journey,
including four questions concerning the access facilities (“connections between the rail
and public transport”, “the capacity of car parks” and the “quality of guarded bicycle
parking” and “unguarded bicycle parking”). The satisfaction scale used is from 1 –
“cannot be worse” to 10 – “excellent”, 5 stands for “insufficient” and a score of 6 for
“sufficient”.

2.1 The importance of access to the railway station in determining passengers'
satisfaction with the rail journey
To assess the importance of accessibility in relation to other dimensions of the rail
journey, we use the so-called derived importance method (see for example Gustafsson
and Johnson, 2004). This method is based on a regression of the overall satisfaction score
for a product on the satisfaction scores of different dimensions of that product. The
estimated beta-coefficients following from the regression can be interpreted as weights
that represent the importance of each dimension.

In order to identify the different underlying dimensions of a rail journey we apply
Principal Component Analysis (PCA) (see Hair et al., 1998) to the satisfaction variables
(questions) in the customer satisfaction survey. We exclude the variables (questions on)
travel time reliability and price-quality ratio from the analysis and treat “travel time
reliability” and “price-quality ratio” as individual dimensions of the rail journey, each
consisting of only one element. The reasons for this are that in most transport demand
models these two variables are seen as important determinant variables on their own and
there is no theoretical basis to group these two variables together with any of the other
satisfaction variables.

The PCA results indicate, based on the statistical correlation pattern between the
satisfaction variables, that eight factors (or dimensions) can be extracted from the data,
which summarize or account, together with the two other dimensions, for the original set
of observed satisfaction scores for each of the questions in the survey. The results provide
us with the factor loadings and factor score weights of each of the 35 satisfaction

2
    For reasons of commercial confidentiality, we cannot provide the full survey questionnaire.
4
variables with respect to each of the eight factors extracted. The factor loadings and
factor score weights are shown in Appendix A (Tables A1 and A2 respectively). The
squared factor loadings indicate what percentage of the variance in a satisfaction variable
is explained by a factor. The factor score weights represent the weight each satisfaction
variable should get in order to compute the factor score, i.e., the standardized composite
measure created for each observation on each factor.
Based on the PCA results we proceed as follows. First, variables for which the
satisfaction scores have a factor loading higher than 0.43 on the same factor are grouped
together.4 As such, the 35 questions (variables) are grouped into eight dimensions (two
more dimensions are formed by the satisfaction variables “travel time reliability” and
“price-quality ratio”). Second, for each dimension a satisfaction score is calculated as a
weighted average of the satisfaction scores for the questions it contains. The weights are
equal to the standardized factor score weights. The resulting classification of all 37
quality aspects (questions) in the Dutch Railways survey into a total of ten dimensions of
the rail journey is displayed in Appendix A (Table A3).
Figure 2 (about here)
Figure 2 shows the different dimensions and the mean satisfaction score they received by
the surveyed passengers and the score for the overall satisfaction with rail journey.
Passengers are most satisfied with the “station organization and information” but only to
the extent of seeing it as slightly better than sufficient. In general, passengers are more
satisfied with the dimensions that represent elements pertaining to information or ‘soft’
elements such as comfort and personal safety while dimensions that represent ‘hard’
elements such as accessibility, service schedule, travel time reliability and price-quality
ratio are on average rated lower and less than 'sufficient'.
Next, we apply the derived importance analysis to the results of the PCA. The derived
importance analysis in this study is based on regression of the overall satisfaction with
the rail journey on the ten dimensions shown in Figure 2. The estimated regression is as
follows:
S = β 0 + β1S1...β10 S10 + Xγ + ε (1)
Where S represents overall satisfaction, Si represents satisfaction with dimension i, and
the coefficient βi represents the weight or relative importance of dimension i. The matrix
X represents a set of dummy-variables we use to account for individual characteristics
3
In the literature, 0.4 is the most frequently used cut-off point.
4
In the spirit of PCA, we draw mainly on the analysis results, but leave some room for theoretical
considerations, in order to ensure a classification structure that makes sense from a statistical as well as a
theoretical point of view. In the present analysis, the assignment procedure leads to a theoretically plausible
and transparent classification. In only three cases, when factor loadings were just above or below the cut-
off point of 0.40, we used theoretical considerations to overrule the assignment procedure. After all
elements are assigned to one or more factors, the factors are labeled such that the factor label is
representative for the elements assigned to it.5 and γ is the vector of associated coefficients. The estimation results for the complete sample of passengers and for the subsample of infrequent rail passengers (those who use the train less than 5 times per year) are given in Table 2.5 Table 2 about here The estimation results for the complete sample of passengers show that the weights are significant for all dimensions, except for “Personnel”. The accessibility dimension ranks 7th in terms of importance. Other dimensions of the rail journey, which are more important in affecting the overall satisfaction, include (in order of importance) the level of comfort, the level of service punctuality, the station organization and information, the dynamic information and the service schedule. Interestingly, for the subsample of infrequent rail passengers, the accessibility dimension has a higher weight, and is ranked 3rd, after travel time reliability and the level of comfort. In order to investigate the importance of individual accessibility facilities, we re-estimate (1), after replacing the satisfaction variable of the “accessibility” dimension with the satisfaction variables of each the four underlying access facilities (i.e. guarded bicycle parking, unguarded bicycle parking, connections with public transport- car parking capacity). The results, given in Table 3, show that the satisfaction with each of the access facilities has a significant effect on the overall satisfaction with the rail journey, except for the satisfaction with the unguarded bicycle parking facilities. Connections between the train and public transport (bus/tram/metro) are the most important accessibility feature in this respect, followed by car park capacity and unguarded bicycle parking facilities. Givoni and Rietveld (2007) obtained similar results6 and found that the satisfaction with the rail journey for those who accessed the station by public transport (bus/tram/metro) and car was influenced by the satisfaction with the associated access facility (connections with public transport and car parking facilities, respectively). However, the satisfaction with the rail journey for those who used the bicycle to access the station was not influenced by the bicycle parking facilities, it appears that most travelers that use the bicycle as an access mode do not incorporate this in their overall valuation of the railway journey. Table 3: Regression results for the relative importance of each dimension of the rail journey and four accessibility variables (about here) 2.2 Satisfaction with and importance of different dimensions of the rail journey - implications for rail operators 5 The results for set of dummy variables that account for general individual characteristics such as gender, age and residential location as well as for domain-specific individual characteristics such as trip purpose, travel frequency, car ownership and ticket type are not reported here since our focus is on the results for the ten rail journey dimensions. 6 In Givoni and Rietveld (2007) the same survey was used but the analysis was based on a smaller dataset, covering one working week instead of a full year (including weekends).
6

Based on the above analysis, rail operators aiming at increasing rail use must consider
three aspects when considering how to improve the rail service: the importance of each
dimension for the passengers; their current satisfaction with its level; and the likely cost
of improving the quality (and thus the satisfaction) of each dimension. It is only when
accounting for these three aspects that the scope for increasing rail use through
improvements to the accessibility becomes apparent.

This paper does not assess the costs involved in improving the quality of the different
dimensions. Nevertheless, it is clear that improvements in some dimensions will be more
costly, and in various respects more difficult, to achieve. Compared to travel time
reliability (which might require increasing the network capacity or reducing the number
of services), the quality of the station and the service schedule it is probably more
feasible and cost-efficient to achieve improvements in the quality of the access-to-station
facilities – especially for the smaller stations on the network.

As the overall satisfaction can be expressed as a weighted average of the satisfaction with
each of the dimensions of the rail trip, the impact of each dimension on the overall
satisfaction score does not depend only on its weight but can be seen as a function of the
weight and the satisfaction score of the dimension. The impact of dimension i can then be
computed as follows:

                                      Ii = ( Si − S ) wi                                 (2)

where S represents the overall satisfaction score of the rail journey while Si and wi
represent the satisfaction score and the estimated weight of dimension i, respectively. The
impact of a dimension is positive when the associated satisfaction score is higher than the
overall satisfaction score and negative when it is lower. Furthermore, the impact (be it
positive or negative) of a dimension is stronger when its weight is higher.

Figure 3 illustrates, for all travelers, the impact of each dimension by plotting its
satisfaction score and weight against each other. The thick vertical line represents the
overall satisfaction score for the rail journey. Graphically, the value of the impact
indicator for the accessibility dimension corresponds to the surface of the grey rectangle
to the left of the vertical line in Figure 3. For comparison purposes, the rectangle to the
right of the vertical line represents the (positive) impact of travel comfort on the overall
satisfaction. The current level of satisfaction with the access infrastructure at railway
stations in the Netherlands has a negative impact on the average overall satisfaction with
the rail journey. In other words, this is one of the dimensions where improvement is most
needed. However, in terms of impact, improving the accessibility might not be the first
priority, as travel time reliability and price-quality ratio have a higher importance, but
when accounting for the costs required to achieve improvements in each dimension,
investments in the accessibility dimension are probably the most cost effective.

Figure 3 about here
7 Figure 4 shows that for infrequent travelers there is much more scope for increasing the satisfaction with traveling by rail, and therefore probably increasing rail use, by improving the accessibility. Although the current level of satisfaction with the access to the station is higher for this group than for all passengers together, the difference with the overall satisfaction score for each group (all travellers and infrequent travellers) is of comparable size. However, for infrequent travelers the accessibility dimension is much more important. Therefore, the current satisfaction level with the accessibility has a higher (negative) impact on the overall satisfaction. For infrequent travelers the accessibility is ranked second in terms of impact behind travel time reliability, while for the complete sample it was ranked third. Figure 4 about here Figure 5 shows the development of the overall satisfaction score and the satisfaction score, weight and impact for the accessibility dimension over the period 2001 to 2005. Although the satisfaction with the accessibility has increased slightly over the period, it has not increased as much as the overall satisfaction. Furthermore, the importance of accessibility has increased over the years, as shown in the graph. The combination of these developments resulted in a steady increase of the negative impact of accessibility on the overall satisfaction with the rail journey between 2001 and 2005. While it is encouraging that the satisfaction with the access facilities is improving over time (the mean satisfaction score for each year is statistically different from that of other years) the higher importance passengers assign to this dimension means continuous improvements are required and at a higher rate. Figure 5 about here 3. The propensity to use rail and the potential to increase it by improving access to railway stations The propensity to use rail can be considered as a factor of three elements: the level and quality of the rail service provided, the level and quality of the access to the rail service and the characteristics of the area and population served. At least in the short term, rail operators have little influence on the characteristics of the population served but they can control for the level of service provided and the access to it. Furthermore, considering the resources required to improve the rail service, rail operators might find it more feasible to change and improve the accessibility of the rail network. In the context of limited resources for investment in rail infrastructure on the one hand, and the aim to increase rail use (mainly by attracting passengers from the private car) on the other, estimating the effect each factor has is a crucial component in planning the development of the rail network. 3.1 Descriptive analysis The propensity to use rail is analyzed here by considering the number of rail trips per person per day in the Netherlands. The analysis is carried out at the 4-digit postcode level. The Netherlands is divided into 3961 postcode areas and, for reasons explained
8

below, 1440 postcodes are included in our database. Data on the number of trips made by
rail were only available at the municipality level (489 in the Dutch case) and therefore it
was assumed that for all postcodes within a municipality (8 on average), the number of
trips per person per day made by rail is equal.7 The mean, median maximum and
minimum values for the number of rail and car trips per person per day and the share of
rail trips are given in Table 4. The highest number and share of trips by rail are in the
municipality of Diemen, south of Amsterdam while in 17 municipalities in the
Netherlands rail is not used at all.

Table 4 about here

Table 4 also provides descriptive statistics of the variables used to describe the level of
rail service (first box), the access to it (middle box) and the postcode characteristics
(lower box).8 Two variables measure the level and quality of the rail service: the Rail
Service Quality Index (RSQI) and the service reliability/punctuality. The RSQI for a
departure station, calculated by Debrezion (2006), is a function of (i) the number of trips
attracted to all other stations on the network, (ii) the generalized travel time from the
departure station to all other stations on the network (accounting for service frequency,
actual travel time and penalties for having to transfer) and (iii) the generalized travel time
to distance ratio, which is used to control for the effect of other modes of transport on the
attractiveness of rail transport.9

To measure the level of accessibility to the rail network at each postcode, the following
variables are used. The average distance between the postcode centroid and the three
most used stations; public transport level of service from the postcode centroid to the
railway stations, measured in travel time (minutes) and frequency of service (services per
hour); and dummy variables indicating whether at least one of the three most used
stations has guarded bicycle-parking facilities (as opposed to only unguarded bicycle-
parking facilities) and Park & Ride facilities (as opposed to car park facilities which are
not designated as Park&Ride).

3.2 The effect of the station accessibility on the number of trips made by rail
To investigate how the number of trips made by rail is determined by the variables
described in Table 4, and especially the accessibility variables, an OLS regression
analysis was carried out. The linear model to be estimated is:

yi = β 0 + Si β s + Ai β A + PCi β PC + ε i                                                        (1)

7
  There is enough variation in the data to merit investigation and analysis.
8
  For each postcode, the rail operator (NS) collects data for the three most used stations by people residing
within that postcode. Only postcodes where these three stations serve more than 98% of the postcode rail
users are included in the analysis. The rail service and accessibility variables at the postcode level are then
calculated as an average across these three most used stations.
9
  The station with the highest RSQI on the Dutch network is Utrecht Centraal (RSQI=2.001) followed by
Duivendrecht (1.832 – in south-east Amsterdam) and Leiden Centraal (1.818). The average RSQI for all
the stations on the Dutch network is 0.44. The RSQI for the main station in Amsterdam - Amsterdam
Centraal – is 1.381 (ranked 8th). The lowest RSQI value for a station in the Dutch network is 0.112
(Debrezion, 2006).
9

Where yi is the number of rail trips in postcode i and Si, Ai and PCi represent rail service
characteristics, accessibility characteristics and postcode characteristics of postcode i,
respectively. The results of the best fitted model are presented in Table 5. The variables
included in the regression explain 36% of the variation in the number of rail trips per
person per day at the Dutch postcode level.

All the variables included in the regression analysis have the expected sign and were
found to be significant at the 95% level, the exception being the dummy variables for
guarded bicycle-parking (significant just under the 90% level) and Park&Ride facilities
(Table 5). The result for the guarded bicycle-parking variable is not surprising given the
findings that satisfaction of rail travelers in the Netherlands with the rail journey is not
influenced by their perception of the quality of the guarded bicycle-parking facilities (see
Table 3). The explanation for the insignificant result for the Park & Ride variable is
probably that these facilities are not perceived to be, or indeed are not, much different
from car parks at railway stations which are not designated as Park&Ride, the latter are
provided in almost all the stations on the Dutch rail network. The punctuality of the rail
service provided, the share of population with higher education in each postcode and the
share of immigrants were not included since they were not found to be significant or were
correlated with other variables. A log-linear model was also estimated but the results
were inferior to the linear model.

Comparing the coefficients in the linear model is difficult, since each is measured in
different units. To better illustrate the regression results, a 1% improvement (in relation
to the current mean level of the variable) is considered for the significant variables. The
change in the daily trips per person per day is then multiplied by the average population
per postcode and the number of days per year to yield the number of additional trips per
year for an average Dutch postcode (Table 5). The results show that the number of rail
trips is most sensitive to the characteristics of the population (share of population over 65
and the income level), but these are difficult, and not necessarily desirable, to change.
What may be possible and important to change is the level of car ownership, a 1%
reduction in the average car ownership would lead to 607 additional rail trips per year for
an average postcode. However, changes in car ownership are mostly outside the control
of rail operators and in the short term also outside the control of policy makers.

Table 5 about here

Rail operators are thus left with two main options to increase the number of trips,
improving the rail service and/or the access to it. A 1% improvement on the current
average RSQI will result in additional 231 trips. To put this figure in context, doubling
the rail service frequency across the whole Dutch rail network will increase the RSQI by
0.18 (Debrezion, 2006). Decreasing the average distance from the postcode centroid to
the station by 1% (the equivalent of about 100 meters) can result in additional 350 rail
trips per year. However, such a change, which requires the opening of new stations on the
rail network, is costly, requires long lead times and might negatively affect the RSQI of
other stations on the network since it will result in increasing travel times for journeys
10

stopping at the new stations.

In comparison, improving public transport services to the station might result in a more
modest increase in the number of rail trips but appears to be less costly and requires
shorter lead time, making it more cost-effective. In some respects, increasing the service
frequency is better than reducing the travel time to the station. First, reducing travel time
might require shortening the route to the railway station which will reduce the catchment
area of the service and possibly the number of rail users. Increasing the frequency of
service would not have this effect. In addition, and second, increasing the frequency of
service will also reduce travel time when including waiting time to the service. If in an
average Dutch postcode the frequency of public transport services to the station would
increase from two to three services per hour (current average is 1.98) an additional 6357
trips per year can be expected, which constitutes an increase in 5.18%; not a minor
increase in rail use.

For the development of the rail network, it is more important to identify to which
postcodes to direct investments and what to invest in. If the criterion for investment is the
number of trips made by rail then investments should be directed to where current level
of service, the access to it and characteristics of the population are favorable. For
example, improving the RSQI by 1% in a postcode within Amsterdam will result in 1537
additional rail trips per year. The maximum a 1% reduction in travel time and a 1%
increase in frequency of service to the railway station could yield in terms of additional
rail trips per year is 911 (postcode in Rotterdam) and 1075 (Amsterdam) respectively.

To decide where investments in accessibility should be preferred over investments in the
actual rail service and vice versa, the ratio of increase in rail trips following a 1%
improvement to the RSQI and the frequency of service to the railway station is a good
criterion10. This ratio is on average, across the postcodes in the database, 0.68. If
increasing the RSQI is at least twice as costly as increasing the frequency of service than
the latter should be considered as a better policy. More important is the variation in the
ratio across the postcodes. The maximum ratio of public transport frequency to RSQI is
4.56 (a postcode within Eemsmond, in the north of the country), investing there in the
access would result in 4 times more rail trips. Furthermore, this increase will be rather
small (43 additional trips per year), which might justify the improvement in the access
journey (perhaps on equity rather than economic basis) but not the improvements in the
level of rail service (which would lead to only 10 additional trips). In contrast, the ratio is
0.116 in a postcode within Schoonhoven, at the centre of the country, and there
improving the RSQI will result in 1025 additional trips and improving the frequency of
service to the station in 119 additional trips – suggesting investments maybe worthwhile
in both. Investments in rail infrastructure, and transport infrastructure in general, are
likely to be characterized by economies of scale. It is therefore less costly to provide
additional rail service per hour, or bus service to the station, where the level of service is
already high, which is at the urban centres or adjacent to them.

10
  The ratio is: [additional rail trips following 1% improvement in the frequency of service to the station /
additional rail trips following 1% improvement in the RSQI]
11

4. Conclusions and discussion
Based on the analysis described above the following conclusions can be drawn. First,
passengers’ satisfaction with the rail journey is partly the result of their satisfaction with
the access facilities provided to them and therefore, improving the quality of the access to
the railway station is likely to increase rail use. The quality of access facilities was found
to be even more important for infrequent rail passengers, indicating that improving the
access to the rail network has the potential to increase their use of rail and can attract new
passengers.

Second, the first conclusion was confirmed in the analysis of factors influencing rail use
in the Netherlands and it provided evidence that rail use can be increased by improving
the access to the railway station. It was found that improving the journey to the station is
more important than facilitating the transfer between the access mode and the rail through
better parking facilities at the station. It might be that this is only the result of the limited
way in which the provision of parking facilities was accounted for in the analysis.

With this in mind, third, in different parts of the rail network improving the access to the
rail service will have a different effect and fourth, this effect depends also on the
characteristics of the population served, which is outside the immediate control of rail
operators. Finally, under budget constraints and assuming that improvements to the
access require fewer resources than improvements to the level of rail service, once a rail
service is provided at a certain area improving that service (e.g. higher frequency of
service) and improving the access to it are substitutes when it comes to increasing rail use
and the latter is probably more cost effective.

A policy to invest in improving the access to the rail service instead of investing in a
better rail service, when accounting also for the likely costs involved, is supported by the
analysis of the satisfaction and importance of different dimensions of the rail journey.
Crockett and Hounsell (2005) reached a similar conclusion, that investments in measures
such as those associated with the convenience or ease of rail travel, including better
access, might provide greater benefits for rail users. Although the perceived reliability of
the rail service is important in determining passengers’ satisfaction with the rail journey
the actual reliability of rail service has no significant effect on the level of rail (and car)
use. Thus improving the reliability of the rail service, which is costly and might require
reduction in other elements of the rail service such as frequency, might not change rail
use or the propensity to use rail. The notion that rail use can be strongly influenced by
changes to the accessibility of the rail network is not apparent in Wardman and Tyler
(2000), the differences with this research can be the different countries examined (the
Netherlands vs. the UK) and the fact that their measurement of access was mainly based
on distance from the station.

The above emphasizes the need to consider a journey by rail as a chain of journeys, or as
a door-to-door journey where rail operators should view the whole chain as part of the
service they provide. From a policy perspective, this emphasizes the importance of
integrated transport to achieve a shift from private car to public transport modes and
specifically on long distance journeys, a shift to rail. It also indicates that other than
12

limited resources, institutional barriers which restrict or limit cooperation in planning and
operating services of different transport modes might constrain improvements which can
make rail a more attractive option to travelers.

In deciding how to improve access to the railway station the analysis clearly indicates the
importance of improving public transport services to the station. Increasing the frequency
of service to the station appears to be superior to reducing travel time to station. This
holds especially if the later results in shorter routes and consequently a smaller catchment
area of the access service. Reducing the distance to the station, while even more
important in terms of the effect on rail use, relates more to changes in the rail network
and not the access to it, and it will most likely require substantial investments and might
not have a positive impact on the level of service across the network. Designating car
parks at railway stations as Park&Ride and investing in supplementing unguarded bicycle
parking facilities with guarded facilities is not likely to increase rail use. In contrast,
investing in better connections between public transport and rail services, higher capacity
car parks and in better unguarded bicycle parking facilities would likely to increase rail
use by making passengers more satisfied with the service provided to them.

Intuition might suggest to carry out investments in the rail network in areas where
currently the level of rail service is relatively low and the access to it relatively poor.
However, at the postcode level, the analysis revealed that when it is the aim to increase
rail use investments should actually be directed towards areas where the level of service
(in terms of the rail service and the access to it) is already relatively high and to the most
populated areas or urban centers (these two qualities, large population and high level of
rail service, are of course highly correlated). The policy implication of this conclusion is
that investment should not be directed towards improving the rail service at the periphery
of the network but (further) improving it at its centre. In other words, investments in rail
infrastructure must be very selective and targeted at the main urban agglomerations.

The other side of the above conclusion is that in those areas which are reached by the rail
network but where the level of rail service is relatively low (generally the peripheral parts
of the network) in order to increase rail use it would be more effective to improve the
access to the station rather than the rail service itself. Considering that the Dutch rail
network already covers most of the country, the analysis suggests that improving the
current level of service might be more important than further expanding the rail network.
This would imply that in the peripheral areas of the Netherlands, transport services may
be supplied by other modes than the rail and to increase accessibility from these areas to
the rest of the country these modes, in part, would be used to provide better access to the
existing railway stations on the network. This is a clear illustration of the well known
conflict between efficiency and equity.

It was noted several times in the paper that rail operators and policy makers have little
influence on the characteristics of the population within each area served by the rail
network. However, in the long term the spatial distribution of the population is also
effected by the supply of rail services. Some people prefer to use the train while others
the car, irrespective of the level of service offered. The former group will choose their
13

residence closer to the railway station (and closer to stations with high level of service)
while the latter will be indifferent for this characteristic of the residence location or might
prefer to reside further away from (large) railway stations. This can also provide part of
the explanation why the distance from the station appears to have such a strong effect on
rail use. Closer to the station people with a high propensity to travel by rail choose to live
(to benefit from shorter access time to the station and the possibility to use bicycle or
walk to the station). This can explain part of the high level of rail use in Transit Oriented
Developments (TOD), what Cervero (2007) found in California and termed the “ridership
bonus” and it provides another justification to direct investments to improving current
"rail centers".

This paper only presents half of the picture, for a full understanding of how the
propensity to travel by rail is influenced by the level and quality of accessibility a similar
analysis should be conducted for destination stations on the Dutch rail network. The
analysis described in this paper demonstrated the kind of effect improvements in the
quality of the access can have on rail use, but the different requirements on access/egress
to home end station vs. activity end station means that a separate analysis is still
necessary. Cervero highlights this aspect by concluding that “concentrating housing near
rail stops will do little to lure commuters to trains and buses unless the other end of the
trip – the workplace – is similarly convenient to and conductive to using transit”
(Cervero, 2006, p. 53).

Acknowledgment
This research is carried out as part of a Marie Curie Intra-European Fellowship and the
TRANSUMO project "reliability of transport chains". We thank the Dutch Railways (NS)
for providing the data.

References
CBS (2007), Verplaatsingen per persoon per dag, 2002/2003 [Trips per person per day,
     2002/2003]. CBS STATLINE: Internet database of the Centraal Bureau voor de
     Statistiek / Statistics Netherlands, Voorburg, [www.statline.cbs.nl (2/04/2007)].
CEC, Commission of the European Communities (2001) ‘White Paper - European
    transport policy for 2010: time to decide’. Commission of the European
    Communities, COM(2001)370, Brussels, September,
    [http://europa.eu.int/comm/off/white/ index_en.htm (15/2/2002)].
Cervero R. (2006), ‘Office development, rail transit, and commuting choices’, Journal of
     Public Transportation, 9, 5, pp. 41-55.
Cervero R. (2007), ‘Transit oriented development’s ridership bonus: a product of self-
     selection and public policies’, Environment and Planning A, 39, 9, pp. 2068-2085.
Crockett J. and Hounsell N. (2005), ‘Role of the travel factor convenience in rail travel
     and a framework for its assessment’, Transport Reviews, 25, 3, pp. 535-555.
14
Debrezion G. (2006) ‘Railway impacts on real estate prices’, PhD Thesis, Vrije
Universiteit, Amsterdam.
EC, European Commission (2005) ‘European Union energy and transport in figures
2005’. European Commission, Directorate-General for Energy and Transport.
Hair J.F., Anderson R.E., Tatham R.L. and Black W.C. (1998), Multivariate Data
Analysis, 5th Edition, Saddle River, NJ: Prentice Hall.
Hine, J., Scott, J. (2000) ‘Seamless, accessible travel: users' views of the public transport
journey and interchange’, Transport Policy, 7, pp. 217-226.
Keijer, M. J. N. and Rietveld, P. (2000) ‘How do people get to the railway station? The
Dutch experience’, Transportation Planning and Technology, 23, pp. 215-235.
Krygsman, S., Dijst, M., Arentze T. (2004), ‘Multimodal public transport: an analysis of
travel time elements and the interconnectivity ratio’, Transport Policy, 11, pp. 265-
275.
Givoni M. and Rietveld P. (2007), ‘The access journey to the railway station and its role
in passengers’ satisfaction with rail travel’, Transport Policy.
Gustafsson, A. and Johnson, M. D. (2004) ‘Determining attribute importance in a service
satisfaction model’, Journal of Service Research, 7, pp. 124-141.
Rietveld, P. (2000) ‘The accessibility of railway stations: the role of the bicycle in The
Netherlands’, Transportation Research Part D, 5, pp. 71-75.
Wardman, M., Hine, J. P. (2000), ‘costs of interchange: a review of the literature’,
Working paper 546, Institute for Transport Studies, University of Leeds.
Wardman, M., Tyler, J. (2000) ‘Rail network accessibility and the demand for inter-urban
rail travel’, Transport Reviews, 20(1), pp. 3-24.15
Appendix A: Results of the Principal Component Analysis on traveller
satisfaction in rail transport 11: factor loadings and factor scores per
element
Table A1: Factor loadings on traveler satisfaction (correlation coefficients between
element-factor pair).
Factors (representing the dimensions of the rail journey)
Elements of the train journey 1 2 3 4 5 6 7 8
‘Approachability’ of train conductor 0.54 0.24 0.05 -0.01 0.19 0.07 0.39 0.15
Friendliness/helpfulness of conductor 0.53 0.20 0.18 0.03 0.07 0.07 0.43 0.17
Seat capacity inside the train 0.62 0.12 0.09 0.11 0.08 0.15 0.10 0.06
Riding and sitting comfort inside the train 0.70 0.16 0.15 0.20 0.13 0.19 0.02 0.05
Heating and ventilation inside the train 0.65 0.15 0.17 0.20 0.15 0.16 -0.02 0.06
Cleanliness of train interior 0.61 0.20 0.11 0.22 0.18 0.16 -0.01 0.14
Station overview 0.21 0.06 0.11 0.77 0.09 0.04 0.08 0.15
Signage at station 0.19 0.10 0.14 0.76 0.10 0.07 0.16 0.11
Travel information at station 0.10 0.23 0.15 0.61 0.09 0.15 0.34 0.03
Cleanliness of station 0.20 0.33 0.08 0.46 0.17 0.13 0.07 0.20
Protection against wind, rain and cold 0.04 0.31 0.05 0.30 0.21 0.21 0.31 0.03
Connections with other trains 0.20 0.21 0.15 0.08 0.19 0.71 0.13 0.09
Service frequency of the trains 0.24 0.15 0.18 0.11 0.18 0.74 0.11 0.11
Information available at home 0.21 0.10 0.16 0.13 0.10 0.60 0.10 0.25
Intelligibility of audio messages at the station 0.03 0.66 0.10 0.32 0.13 0.17 0.10 0.08
Information on delays and platform changes 0.04 0.63 0.13 0.32 0.13 0.25 0.14 0.05
Intelligibility of audio messages inside the train 0.40 0.65 0.12 -0.01 0.11 0.03 0.12 0.15
Information in train at departure/arrival 0.33 0.72 0.15 0.04 0.11 0.06 0.13 0.12
Information in train during delays 0.33 0.69 0.12 0.06 0.16 0.11 0.14 0.06
Guarded bicycle parking 0.16 0.01 0.18 0.10 0.58 0.06 0.13 0.20
Unguarded bicycle parking 0.14 0.14 0.02 0.07 0.75 0.06 0.12 0.17
Connections with public transport 0.14 0.14 0.22 0.08 0.54 0.31 0.07 0.00
Car parking capacity 0.13 0.17 0.14 0.10 0.66 0.10 0.04 0.06
Train taxi 0.08 0.13 0.40 0.12 0.51 0.10 0.10 0.02
Possibilities to buy a ticket 0.15 0.13 0.71 0.16 0.20 0.16 0.04 0.11
Queuing time at ticket vending machine 0.17 0.13 0.73 0.15 0.09 0.17 0.00 0.15
Queuing time at ticket counter 0.13 0.13 0.75 0.07 0.21 0.08 0.17 0.10
Friendliness of personnel at ticket counter 0.14 0.07 0.63 0.05 0.15 0.09 0.33 0.19
Personal safety during daytime at station 0.14 0.09 0.26 0.16 0.09 0.09 0.06 0.77
Personal safety during nighttime at station 0.06 0.13 0.10 0.09 0.27 0.09 0.08 0.78
Personal safety inside the train 0.22 0.13 0.12 0.16 0.06 0.36 0.06 0.61
Approachability' of service personnel 0.06 0.19 0.13 0.28 0.17 0.14 0.74 0.03
Friendliness of service personnel 0.13 0.15 0.20 0.21 0.11 0.12 0.77 0.08
11
The extraction method used is principal component analysis based on the correlation matrix. We use a
rotation method based on varimax with Kaiser Normalization. The number of factors is determined based
on the Kaiser criterion: factors with an eigenvalue greater than one are retained.16
Table A2: Factor score weights of each element of traveler satisfaction with respect to
each factor to be used to calculate a weighted average score per dimension.
Factors (representing the dimensions of the rail journey)
Elements of the rail journey 1 2 3 4 5 6 7 8
‘Approachability’ of train conductor 0.23 -0.03 -0.10 -0.15 0.02 -0.09 0.24 0.03
Friendliness/helpfulness of conductor 0.22 -0.06 -0.01 -0.13 -0.09 -0.09 0.26 0.05
Seat capacity inside the train 0.31 -0.10 -0.04 -0.01 -0.04 0.00 0.00 -0.05
Riding and sitting comfort inside the train 0.34 -0.09 -0.01 0.05 -0.02 0.00 -0.10 -0.10
Heating and ventilation inside the train 0.32 -0.08 0.01 0.06 0.00 -0.02 -0.13 -0.08
Cleanliness of train interior 0.27 -0.05 -0.04 0.06 0.02 -0.03 -0.12 -0.01
Station overview 0.05 -0.11 -0.03 0.45 -0.02 -0.10 -0.10 0.01
Signage at station 0.02 -0.09 -0.02 0.43 -0.03 -0.08 -0.05 -0.03
Travel information at station -0.07 -0.01 -0.01 0.29 -0.05 0.00 0.10 -0.08
Cleanliness of station -0.02 0.08 -0.06 0.21 0.01 -0.04 -0.10 0.05
Protection against wind, rain and cold -0.11 0.08 -0.08 0.08 0.05 0.07 0.12 -0.05
Connections with other trains -0.05 -0.02 -0.05 -0.08 -0.02 0.49 0.00 -0.07
Service frequency of the trains -0.02 -0.06 -0.04 -0.06 -0.04 0.51 -0.02 -0.07
Information available at home -0.02 -0.07 -0.03 -0.03 -0.08 0.39 -0.01 0.06
Intelligibility of audio messages at the station -0.18 0.34 -0.01 0.09 -0.03 0.02 -0.09 -0.02
Information on delays and platform changes -0.18 0.31 -0.01 0.08 -0.04 0.08 -0.06 -0.06
Intelligibility of audio messages inside the train 0.08 0.31 -0.01 -0.14 -0.05 -0.13 -0.03 0.04
Information in train at departure/arrival 0.02 0.35 0.02 -0.11 -0.06 -0.11 -0.04 0.01
Information in train during delays 0.02 0.33 -0.02 -0.10 -0.01 -0.06 -0.04 -0.04
Guarded bicycle parking 0.01 -0.11 -0.04 -0.01 0.33 -0.09 0.01 0.05
Unguarded bicycle parking -0.02 -0.03 -0.16 -0.04 0.47 -0.09 0.00 0.03
Connections with public transport -0.04 -0.03 0.00 -0.03 0.28 0.14 -0.06 -0.13
Car parking capacity -0.03 0.00 -0.06 -0.01 0.39 -0.05 -0.08 -0.06
Train taxi -0.06 -0.01 0.14 0.00 0.25 -0.06 -0.05 -0.10
Possibilities to buy a ticket -0.04 -0.01 0.37 0.02 -0.03 -0.02 -0.11 -0.07
Queuing time at ticket vending machine -0.02 0.01 0.40 0.01 -0.12 -0.01 -0.13 -0.03
Queuing time at ticket counter -0.05 0.00 0.39 -0.06 -0.03 -0.08 0.00 -0.06
Friendliness of personnel at ticket counter -0.03 -0.06 0.30 -0.09 -0.07 -0.07 0.15 0.03
Personal safety during daytime at station -0.04 -0.02 0.03 0.00 -0.08 -0.09 -0.03 0.49
Personal safety during nighttime at station -0.10 0.01 -0.09 -0.05 0.07 -0.09 0.00 0.51
Personal safety inside the train -0.01 -0.03 -0.07 -0.01 -0.11 0.16 -0.03 0.36
Approachability' of service personnel -0.08 -0.05 -0.06 0.01 0.00 0.01 0.47 -0.05
Friendliness of service personnel -0.04 -0.08 -0.01 -0.04 -0.06 -0.02 0.51 -0.0117
Table A3: Classification of the elements of the rail journey into dimensions of traveler
satisfaction
Element of the rail journey Dimension
- ‘Approachability’ of train conductor
- Friendliness/helpfulness of conductor
- Seat capacity inside the train
Travel comfort
- Riding and sitting comfort inside the train
- Heating and ventilation inside the train
- Cleanliness of train interior
-Travel time reliability Travel time reliability
- Station overview
- Signage at station
Station organisation and
- Travel information at station
information
- Cleanliness of station
- Protection against wind, rain and cold
- Connections with other trains
- Service frequency of the trains Service schedule
- Information available at home
- Intelligibility of audio messages at the station
- Information on delays and platform changes
- Intelligibility of audio messages inside the train Dynamic information
- Information in train at departure/arrival
- Information in train during delays
- Price-quality Price-quality ratio
- Guarded bicycle parking
- Unguarded bicycle parking
- Connections with public transport Accessibility
- Car parking capacity
- Train taxi
- Possibilities to buy a ticket
- Queuing time at ticket vending machine
Ticket service
- Queuing time at ticket counter
- Friendliness of personnel at ticket counter
- Personal safety during daytime at station
- Personal safety during nighttime at station Personal safety
- Personal safety inside the train
- Approachability of service personnel
- Friendliness of service personnel
Personnel
- Approachability of train conductor
- Friendliness of train conductor18
Table 1: Number of trips per person per day and the rail’s share in modal choice in the
489 Dutch municipalities (2002/2003) (about here)
Average Weighted SD Max
average*
Trips per person per day
All modes** 3.123 3.080 0.192 3.730
Rail 0.041 0.057 0.032 0.250
Car 1.626 1.507 0.207 2.220
Rail share of the trips by:
All modes 1.32% 1.86% 1.02% 8.14%
Rail + Car 2.54% 3.92% 2.11% 15.24%
* Weighted by the population
** All modes: Car (driver), car (passenger), rail, bus/tram/metro, motorized two-wheelers, bicycle, other.
Source: CBS (2007).
Table 2: Regression results for the relative importance of each dimension of the rail
journey
All passengers Infrequent passengers
Variable Coefficient t-value Coefficient t-value
(Constant) 1.203 18.754 1.545 4.059
Travel time reliability 0.201 35.889 0.226 6.694
Price/quality ratio 0.080 14.955 0.051 1.697
Dimensions of rail trip
Travel comfort 0.213 22.118 0.161 2.884
Dynamic information 0.087 10.446 0.059 1.289
Ticket service 0.023 3.051 0.051 1.178
Station organization and
0.096 10.624 0.069 1.371
information
Service schedule 0.091 10.793 0.083 1.625
Personnel 0.007 1.022 -0.048 -1.255
Personal safety 0.015 2.310 0.047 1.260
Accessibility 0.052 6.941 0.128 2.988
2
Adjusted R 0.482 0.399
N 17033 63319
Table 3: Regression results for the relative importance of each dimension of the rail
journey and four accessibility variables (all passengers).
Regression results
Variable Coefficient t-value
(Constant) 1.20 18.66
Travel time reliability 0.20 35.74
Price/quality ratio 0.08 14.72
Service dimensions
Travel comfort 0.21 22.02
Dynamic information 0.09 10.25
Ticket service 0.02 2.98
Station organization and information 0.10 10.70
Services schedule 0.09 10.29
Personnel 0.01 1.07
Personal safety 0.02 2.47
Guarded bicycle parking facilities 0.00 -0.07
Unguarded bicycle parking facilities 0.01 2.17
Access
Connection train with other public
0.03 6.66
transport
Car park capacity 0.02 3.49
2
Adjusted R 0.48
N 1703320
Table 4: Descriptive statistics of variables considered to estimate number and share of
trips made by rail
Mean Median Min. Max.
Trips by rail (per day per person) 0.052 0.04 0.00 0.25
Trips by car (per day per person) 1.55 1.57 0.88 2.09
Rail modal share (of car and rail trips) 3.51% 2.57% 0.00% 15.24%
Rail Service Quality Index (RSQI) per
0.67 0.64 0.05 1.57
postcode
Rail punctuality (% of trains delayed on
0.15 0.15 0.01 0.50
departure)
Distance from postcode centroid to railway
8.681 7.615 0.543 29.742
stations (km)
Public transport travel time from postcode
25.41 26.11 5.51 50.23
centroid to railway stations (minutes)
Public transport service frequency (per hour) 1.98 1.33 1.00 9.33
Guarded bicycle-parking (in at least one
90.7%
station)
Park & Ride facilities (in at least one station) 59.4%
Postcode land (hectare2) 982 517 15 13606
Postcode population (2003) 6468 6140 170 22850
Population density (people/ km2) 2833 1060 30 41660
Population over 65 13.8% 13.0% 1.1% 53.7%
Share of immigrants 7.5% 3.8% 1.0% 83.0%
Population with higher education 10.0% 8.7% 0.0% 80.2%
Average income per inhabitant (Euro/year) 11067 10781 6667 25531
Number of cars per household 0.97 1.01 0.16 2.60
Valid N (list-wise): 1394
Note: The values for the rail service and access to the railway station variables are the means for the three
most used stations in the postcode (as explained it footnote 8). The means presented in the table are used to
describe the distribution of variables over postcodes in the database (together with the other descriptive
statistics) and are thus not weighted by postcode population. As such, they should not be interpreted as
overall means for the Netherlands but as means over the postcodes in the database.21
Table 5: Regression results for the number of daily trips per person in a postcode area
made by rail and the effect of 1% improvement1 on the total number of rail trips in an
average postcode area
Linear model ∆ rail
∆X2
Variable Coefficient t-value trips3
(Constant) 0.0647 7.41
RSQI per postcode 0.0146 4.97 0.0067 231
Average distance -0.0017 -6.79 -0.0868 350
Public transport travel time -0.0004 -2.43 -0.2541 251
Public transport service frequency 0.0027 3.24 0.0198 125
Guarded bicycle-parking 0.0048 1.63
Park&Ride facilities 0.0013 0.78
Population density (x1000 people/km2) 0.0555 1.98 0.2833 37
Population share over 65 -0.0691 -4.49 -0.0014 225
Average income per inhabitant 0.0024 4.13 0.1107 625
Number of cars per household -0.0265 -6.96 -0.0097 607
Rail trips per person
Dependent variable per day
N 1438
R-square 0.364
1
An improvement means a change in the variable such that the number of rail trips increases. Depending
on the direction of the effect on rail use, this can be an increase or a decrease in the variable.
2
∆X = 1% of mean, calculated for the significant variables only.
3
∆ rail trips = additional trips in postcode per year.22 Figure 1: The Dutch rail network Source: NS
23

Figure 2: Satisfaction scores for the overall and for each dimension of the rail journey

                 Overall satisfaction

             Station organization and
                          information

                     Personal safety

                       Ticket service
 Dimension

                       Travel comfort

                Dynamic information

                            Personnel

                   Service schedule

              Accessibility of station

                 Travel time reliability

                    Price-quality ratio

                                           4,5   5,0   5,5      6,0     6,5   7,0   7,5

                                                             Satisfaction
You can also read