Internet Access Index - Measuring the Availability and Household Adoption of High-speed Internet - Measuring the Availability and Household ...
←
→
Page content transcription
If your browser does not render page correctly, please read the page content below

Internet Access Index
Measuring the Availability and Household Adoption of High-speed
Internet

National Preparedness Analytics Center
Decision and Infrastructure Sciences Division
About Argonne National Laboratory
Argonne is a U.S. Department of Energy laboratory managed by UChicago Argonne, LLC
under contract DE-AC02-06CH11357. The Laboratory’s main facility is outside Chicago, at
9700 South Cass Avenue, Argonne, Illinois 60439. For information about Argonne
and its pioneering science and technology programs, see www.anl.gov.

DOCUMENT AVAILABILITY
 Online Access: U.S. Department of Energy (DOE) reports produced after 1991 and a
 growing number of pre-1991 documents are available free at OSTI.GOV
 (http://www.osti.gov/), a service of the US Dept. of Energy’s Office of Scientific and
 Technical Information.

Reports not in digital format may be purchased by the public from the
National Technical Information Service (NTIS):
 U.S. Department of Commerce
 National Technical Information Service
 5301 Shawnee Rd
 Alexandria, VA 22312
 www.ntis.gov
 Phone: (800) 553-NTIS (6847) or (703) 605-6000
 Fax: (703) 605-6900
 Email: orders@ntis.gov

Reports not in digital format are available to DOE and DOE contractors from the
Office of Scientific and Technical Information (OSTI):
 U.S. Department of Energy
 Office of Scientific and Technical Information
 P.O. Box 62
 Oak Ridge, TN 37831-0062
 www.osti.gov
 Phone: (865) 576-8401
 Fax: (865) 576-5728
 Email: reports@osti.gov

Disclaimer
This report was prepared as an account of work sponsored by an agency of the United States Government. Neither the United States
Government nor any agency thereof, nor UChicago Argonne, LLC, nor any of their employees or officers, makes any warranty, express or
implied, or assumes any legal liability or responsibility for the accuracy, completeness, or usefulness of any information, apparatus,
product, or process disclosed, or represents that its use would not infringe privately owned rights. Reference herein to any specific
commercial product, process, or service by trade name, trademark, manufacturer, or otherwise, does not necessarily constitute or imply its
endorsement, recommendation, or favoring by the United States Government or any agency thereof. The views and opinions of document
authors expressed herein do not necessarily state or reflect those of the United States Government or any agency thereof, Argonne
National Laboratory, or UChicago Argonne, LLC.
Internet Access Index

Measuring the Availability and Household Adoption of High-speed Internet

Prepared by
M. Ross Alexander PhD, Iain Hyde, Carmella Burdi, Braeton Smith PhD, Joshua Bergerson PhD,
Matthew Riddle PhD, Carol Freeman, and John Hutchison

Argonne National Laboratory

May 2021
Internet Access Index
What is the Internet Access Index (IAI)?
The internet is a central driver in how households access information and services, learn, connect with
family and friends, shop, and work. However, almost 14 percent of households in the United States 1
do not have the ability to access high-speed internet. Access to broadband or high-speed internet has
taken on increased importance during the COVID-19 pandemic as many workplaces and schools
shifted to a virtual environment. Argonne National Laboratory (Argonne) developed the IAI to better
understand the challenges many households face in connecting to high-speed internet, whether due to
lack of broadband availability from internet service providers or difficulties in subscribing to a
broadband service.

What Does the IAI Measure?
The IAI is calculated as the product of 3 factors using publicly available data from the Federal
Communications Commission and the U.S. Census Bureau. The first two factors gauge the quality and
availability of high-speed internet and the third factor represents the public’s ability to subscribe to
high-speed internet services. The IAI scores United States’ census tracts on a [0,1] scale, where values
near 0 represent areas with less internet access and values approaching 1 represent more internet
access. The maximum score (1.0) of the IAI would mean that all census blocks within a census tract
have high speed internet available at the highest national speed (currently 1000 mbps), and that all
households within the tract have a fixed broadband subscription of some type. To better visualize the
results, Argonne binned the data into 5 relative bins (darker colored bins means better internet access)
and created maps available at www.anl.gov.

Why is the IAI Important?

The COVID-19 pandemic surfaced deep digital divides across America. A lack of access to high-
speed internet has made it more difficult for households to work from home or access basic services,
including education and healthcare. Understanding where high-speed internet is accessible and
accessed (where households subscribe to broadband services) will continue to play a critical role in
the well-being of individuals, the economy, and communities well into the future. The IAI index and
accompanying map identifies areas that could be considered broadband deserts where communities do
not have quality access to the internet and therefore will find it more difficult to participate in an
increasingly digital world. For example, it highlights locations where it is harder for students to
participate in virtual learning, where individuals cannot access telemedicine services, or work
remotely.

1 American Community Survey Table S2801, 2019 1-Year Estimates.

 4
 May 2021
How to Use the IAI?
The goal of the IAI is to provide an easy-to-understand metric that can be flexibly applied to a wide
variety of research and decision-making purposes that relate to internet access. Researchers and
policymakers can use this index to better understand the current high-speed internet accessibility
landscape and to assess potential impacts of variable internet accessibility on education, healthcare,
economic development, and other critical services through the lens of high-speed internet access. For
example, governments, industry, and non-for-profit organizations could consider how to take
advantage of areas with high levels of internet access as well as make accommodations for those
without internet access. In these communities, individuals may not have an email address or the ability
to easily complete digital forms.

Go to the IAI story map located here to view the results and interact with IAI data. You can also
download the IAI data here.

 5
 May 2021
Introduction
The internet is a central driver in how households access information and services, learn, connect with
family and friends, shop, and work. However, almost 14 percent of households in the United States 2
do not have the ability to access high-speed internet for a variety of reasons including:
 • The availability of internet service or broadband infrastructure in their community,
 • The willingness or financial ability to subscribe to an internet service provider,
 • The capacity of the individual to buy the equipment (i.e. computer, tablet, cell phone)
The Internet Access Index (IAI) described in this paper focuses on the first two factors, as these are
frequently the product of large collective investments.

Access to broadband or high-speed internet has taken on increased importance during the COVID-19
pandemic. In the first quarter of 2020, broadband usage increased by 47% over the first quarter of
2019 3. The pandemic caused the spike in demand as:
 • Many workplaces have shifted to a virtual
 environment. According to the Federal Reserve
 Bank of Dallas, 35.2 percent of workers who
 participated in the Real Time Population Survey The Federal Communication
 (RPS) reported working from home in May 2020, Commission (FCC) indicates that the
 4 term ‘broadband’ commonly refers to
 as compared to 8.2 percent in February 2020.
 high-speed internet access that is
 • Primary and secondary schools and institutions of always on and faster than dial-up
 higher learning across the United States have access. The current definition of high-
 deployed distance-learning programs to protect the speed internet is 25 mbps down/3
 wellbeing of students and teachers. mbps up. This is the minimum
 • Non-emergency healthcare services significantly download speed recommended for
 shifted to telemedicine visits as compared to in activities such as education and
 5
 office visits. telecommuting.
 Federal Communications Commission.
COVID-19 surfaced deep digital divides across America. A Broadband Speed Guide.
lack of access to high-speed internet has made it more https://www.fcc.gov/consumers/guides/broad
difficult for households to access basic services, including band-speed-guide
education and healthcare. Prior to the pandemic, Common
Sense Media estimated that six-in-ten students (58%) said they used the internet at their home to do
homework every day or almost every day. The same study also found that approximately 15-16 million
K-12 public school students lived in homes without either an Internet connection or a device adequate

2 American Community Survey Table S2801, 2019 1-Year Estimates.
3 Weinschenk, C. (2020). Open Vault: Pandemic Drives Almost a Year’s Worth of Broadband Traffic Growth in the Span
 of a Couple of Weeks. https://www.telecompetitor.com/openvault-pandemic-drives-almost-a-years-worth-of-
 broadband-traffic-growth-in-the-span-of-a-couple-of-weeks/
4 Bick, A., Blandin, A. and Mertens, K. (2020) Work From Home After the COVID-19 Outbreak. Federal Reserve Bank
 of Dallas. https://www.dallasfed.org/-/media/documents/research/papers/2020/wp2017r1.pdf
5 Koonin LM, Hoots B, Tsang CA, et al. Trends in the Use of Telehealth During the Emergence of the COVID-19
 Pandemic — United States, January–March 2020. Morbidity and Mortality Weekly Report 2020; 69:1595–1599. DOI:
 http://dx.doi.org/10.15585/mmwr.mm6943a3
 6
 May 2021
for distance learning at home resulting in a homework gap. 6 This “homework gap” has now become
a “learning gap” as the pandemic has led to an increased reliance on virtual learning in K-12 schools
and institutions of higher education across America.

Goals
As the pandemic has served to highlight, understanding where high-speed internet is accessible and
accessed (where households subscribe to broadband services) will continue to play a critical role in
the well-being of individuals, the economy, and communities. Recognizing this need, Argonne
National Laboratory (Argonne) developed the IAI to focus on the connectivity challenge: broadband
availability and broadband adoption or subscription. Later iterations or enhancements may look at
challenges related to device availability, digital skills, and applications, such as for health screenings,
workforce training, and education.

The goal of the IAI is to provide an easy-to-understand metric that can be flexibly applied to a wide
variety of research and decision-making purposes. The IAI uses nationwide, publicly available data
from the FCC and the U.S. Census Bureau American Community Survey (ACS) to measure both
availability (internet infrastructure and speed) and household adoption by combining advertised
internet availability and speed data as reported by internet service providers (ISPs) with household
subscription data.

Researchers and policymakers can use this index to better understand the potential impacts of variable
internet accessibility or as one factor in more complex models looking at broader impacts of disparity
and inequality nationwide. For example, policymakers can assess the implications of COVID-19's
impact on education, healthcare, economic development, and other critical services through the lens
of high-speed internet access.

This publicly available resource will assist government and non-government stakeholders with
analysis related to infrastructure deployment in current broadband deserts, as well as programs to
increase the number of lower income individuals that can afford internet subscription services.
Additionally, this index can identify locations where government and not-for-profit programs and
services should not rely on a household’s internet access to provide services, for example individuals
in households that do not have internet access may not have email addresses or be able to complete
on-line forms.

During the IAI development process, Argonne consulted with staff from the National
Telecommunications and Information Administration (NTIA), Federal Communications Commission
(FCC), Department of Education, and the Federal Emergency Management Agency (FEMA) to solicit
technical input.

6 Chandra, S., Chang, A., Day, L., Fazlullah, A., Liu, J., McBride, L., Mudalige, T., Weiss, D., (2020). Closing the K–12
 Digital Divide in the Age of Distance Learning. San Francisco, CA: Common Sense Media. Boston, Massachusetts,
 Boston Consulting Group.
 7
 May 2021
Data Sources
 Table 1: Data sources used to compute the ANL Internet Accessibility Index.
 Index Data Data Source Reference Period
 Median Download Speed within Federal Communication Dec 31, 2019 data
 a tract; Maximum Download Commission (FCC) Fixed
 speed within a block Broadband Deployment Data
 Form 477
 Percent of blocks within a tract FCC Form Fixed Broadband Dec 31, 2019 data
 with download speeds ≥ 25 Deployment Data Form 477
 mbps

 Percent of households with a Census Bureau American 2015 – 2019
 broadband subscription Community Survey (ACS) Table
 (excluding cellular-only subs) S2801 5-year estimates

To compose the IAI, Argonne relied upon two nation-wide datasets, which are discussed below.

FCC Fixed Broadband Deployment Data (Form 477)
The most extensive publicly available data set detailing available service and internet speeds is
collected by the FCC in their Fixed Broadband Deployment Data Form 477 (FCC Broadband; Table
1) 7. These data are self-reported by the ISPs and list information for both business and
consumer/residential services such as maximum advertised upload and download speeds (megabits •
second-1; mbps) and the technology deployed to achieve those speeds. Because these data are self-
reported there is the potential for broadband coverage to be overstated.

For the IAI, Argonne used all the available FCC speed information for the consumer/mass
market/residential data regardless of technology 8. Argonne derived two variables from the maximum
advertised download speeds reported in the FCC Broadband data.

 • The median of the maximum advertised download speed. These data are reported at the
 census block-level. Argonne scaled the data up to the census tract-level to match the spatial
 scale of other data products used in the analysis. Using the median allows for the retention of
 some of the census block-level characteristics in the data when scaled up to census tract. The
 FCC’s Broadband Speed Guide indicates that the minimum download speed recommended
 for activities such as education and telecommuting is between 5 and 25mbps 9.

7 Federal Communications Commission. Fixed Broadband Deployment Data from FCC Form 477
 https://www.fcc.gov/general/broadband-deployment-data-fcc-form-477
8 Federal Communications Commission. Technology Codes used in Fixed Broadband Deployment Data.
 https://www.fcc.gov/general/technology-codes-used-fixed-broadband-deployment-data
9 Federal Communications Commission. Broadband Speed Guide. https://www.fcc.gov/consumers/guides/broadband-
 speed-guide
 8
 May 2021
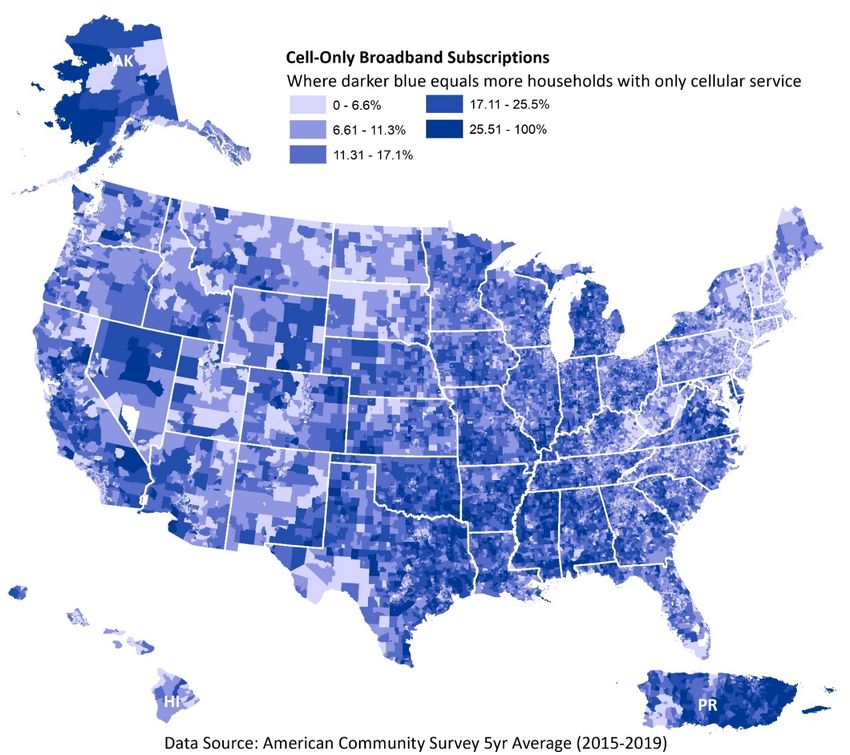
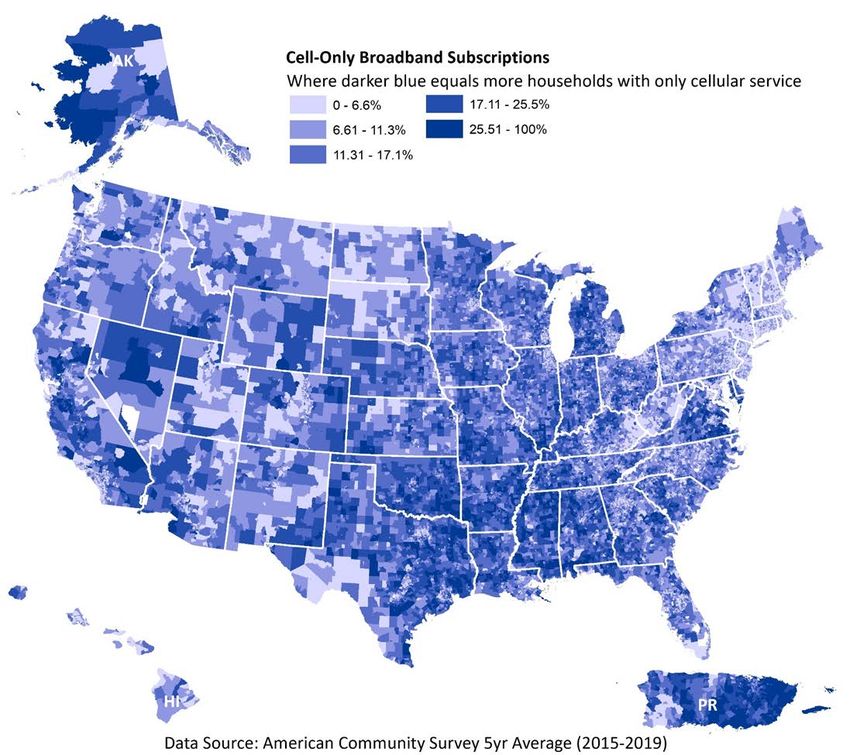
• Percentage of census blocks within a census tract where ISPs advertise speeds greater than
 25mbps. The FCC Broadband Speed Guide also defines the minimum threshold for
 “Advanced” broadband service as 25mbps. As such, Argonne also calculates the percentage of
 blocks within each tract that report maximum advertised download speeds ≥ 25mbps.
ACS 5-yr-estimate broadband subscription data (Table S2801)
To capture on-the-ground household accessibility to broadband infrastructure, Argonne used the
American Community Survey (ACS) Table S2801 5-year estimate (2015-2019) internet subscription
 10
data (ACS Subscription; Table 1) . The primary advantage of using multiyear estimates is the
increased statistical reliability of the data compared with that of single-year estimates, particularly for
small geographic areas and small population subgroups. The inclusion of these survey data with
detailed household adoption metrics helps to reduce potential overstating of maximum download
speeds reported by the ISPs to the FCC. The ACS details broadband internet subscriptions based on
households who said ‘yes’ to at least one of the following types of internet subscription: broadband
such as cable, fiber optic, or DSL; a cellular data plan; satellite; or a fixed wireless subscription. As
the FCC Broadband data refers to in-home broadband speeds only, the cellular-only respondents were
removed from this broadband subscription metric. A map of cellular-only subscription levels can be
found in Appendix A.

Method
The IAI is calculated as the product of 3 factors. The first two factors gauge the quality and availability
of high-speed internet; 1) the ratio of median census tract download speeds to the maximum national
download speed (the Download Speed Ratio) and 2) the percent of census blocks within a census tract
with available Advanced Broadband Speeds (≥ 25 mbps) (Percent Advanced Broadband Speed). The
third factor represents the public’s ability to access the available high-speed internet by calculating the
percent of households with broadband subscriptions per census tract (Percent Broadband
Subscriptions).

Download Speed Ratio
To match the spatial scale among data sources, Argonne scaled the FCC data from the Census block-
level to the tract level by calculating the median of the maximum advertised download speeds for all
services in all blocks within a census tract. To create a scale between zero and one that can then be
combined with the percent values of the other two factors, Argonne divided this census tract median
value with the greatest maximum advertised download speed for blocks at the national level (currently
1000 mbps or 1 gigabit). Scaling download speeds by the national maximum also provides the ability
to easily compare individual census tracts regardless of location (i.e. it is possible to compare a census
tract from California to one in Puerto Rico.

The median download speed data has a distinct right tail to the distribution, because there are many
more instances of middling to poor internet speeds across the country compared to the very few (< 4%

10 ACS Table S2801 5-year averages (2015-2019)
 https://data.census.gov/cedsci/table?q=Computer&t=Telephone,%20Computer,%20and%20Internet%20Access&tid=A
 CSST5Y2018.S2801
 9
 May 2021
of blocks; FCC Data) instances of census tracts with median
speeds close to the maximum advertised speed of 1000 mbps
(Figure 1).

To reduce the influence of this long right tail, we applied a Box-
Cox transformation 11 on both the median download speeds and
the national maximum download speeds. This transformation
makes it easier to integrate the ratio with the ACS data, and
serves to make the data near-normally distributed, which allows
the index to be used with a wider array of analytical methods
such as regression analysis which assumes a normal
distribution to the data. For a full description of the Box-Cox
transformation method, please see Appendix B.
 Figure 1: Example of a distribution with a
Index Calculation distinct right tail. Notice how the mean (orange
All three census-tract scale factors are combined to create the vertical line) is pulled to the right of the apex of
 the distribution curve. This occurs because a
IAI equation; 1) the Download Speed Ratio, 2) Percent few ‘Fast’ values skew the mean towards the
Advanced Speed), and 3) Percent Broadband Subscriptions). upper end.
Argonne transformed the Percent Advanced Speed and Percent
Broadband Subscriptions into proportions (0.0-1.0) to match that of the Download Speed Ratio.

 = × × [eq1]

The calculated index value scores a census tract on a [0,1] scale, where values near 0 represent areas
with less internet access and values approaching 1 represent more internet access. A tract that scores
closer to 1.0 on this index indicates: 1) that most of
the blocks within the tract are listed as having
maximum advertised download speeds that are Download Speed Ratio: ratio of median census-tract
similar to the overall maximum download speed download speeds to the maximum national download speed
available nationally, 2) most of the blocks within the of 1000 mbps.
tract have advertised download speeds that are at or Percent Advanced Speed: Percent of census blocks within
above the broadband threshold of 25 mbps, and 3) a census tract with available Advanced Broadband Speeds
most households within the tract have a broadband (≥ 25 mbps).
internet subscription of some type. An example of Percent Broadband Subscriptions: percent of
how the index is calculated is detailed in eq2, below. households with broadband subscriptions per census tract.

Example:
 - Median download speed for the tract: 25 mbps
 - Maximum download speed, Nationally: 1000 mbps
 - Percent of blocks within the census tract with broadband speeds: 75% (0.75)
 - Percent of households in the census tract with a broadband subscription: 65% (0.65)

11 Box, G.E.P. and D.R. Cox. 1964. An Analysis of Transformations. Journal of the Royal Society. Series B
 (Methodological). 26(2) pp. 211-252.
 10
 May 2021
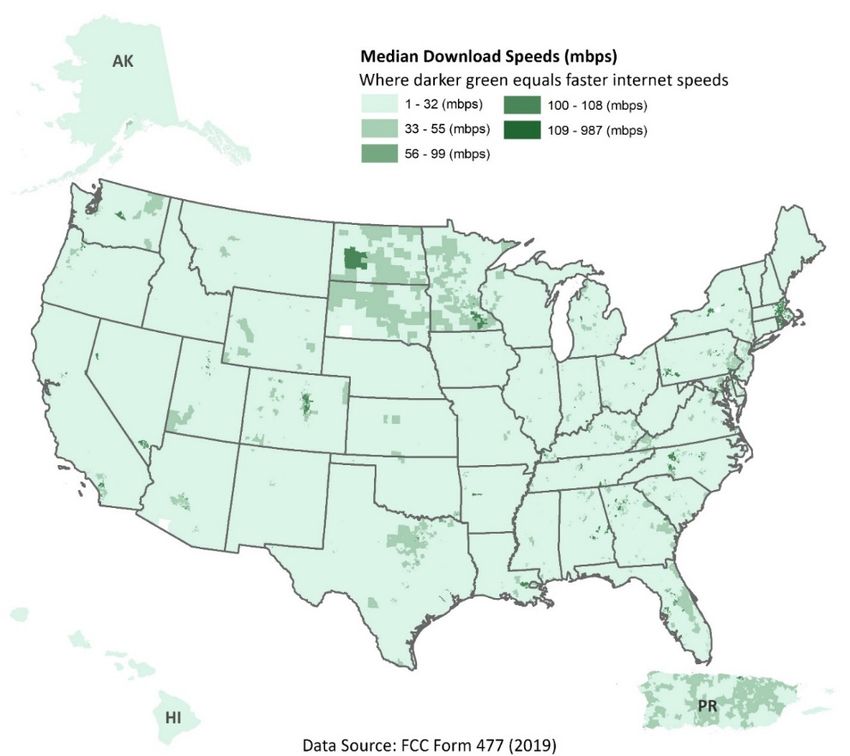
(BoxCox (25)/(BoxCox (1000)) × 0.75 × 0.65 = 0.317 [eq2]

To better analyze the results and to map the three individual factors and the IAI, Argonne sorted each
of the data sets into five bins. Argonne mapped the median of the ISP reported download speed data
rather the Download Speed Ratio to make the actual reported download speeds more accessible for
users (Figure 2). To identify the best binning methodology for the data sets the research team used the
Python Spatial Analysis Library, PySAL, and its Exploratory Spatial Data Analysis sub-package.
Python is an open-source, high-level programming language that is used in social science research.
 12 13 14
The package includes nine potential binning methods. , , Argonne found the best fit for the data
sets was the Jenks-Caspall classification method, which reduces the potential for outliers within each
data class and maximizes variation between data classes.

After binning the datasets into five bins, the research team created choropleth maps using color to
illustrate each of the five bins.

 Figure 2: Census tract median download speeds. Median download speed is used in the
 calculation of the Download Speed Ratio described in the methods section. Darker green
 regions indicate faster median download speeds (mbps). Data from FCC Form 477.

12 The Python Exploratory Spatial Data Analysis Package includes the following nine binning methods: Equal Interval,
 Fisher Jenks, Head Tail Breaks, Jenks Caspall, Maximum Breaks, Natural Breaks (kmeans, stochastic), Quantiles,
 Percentiles, and Standard Mean.
13 Sergio Rey, Wei Kang, Levi John Wolf, mhwang4, jlaura, Philip Stephens, James Gaboardi, Charles Schmidt, Martin
 Fleischmann, and David C. Folch. “Pysal/Mapclassify: Mapclassify 2.3.0.” Zenodo, 2020.
 https://pypi.org/project/mapclassify/
14 Mapclassify source code for classification schemes: https://pysal.org/mapclassify/
 11
 May 2021
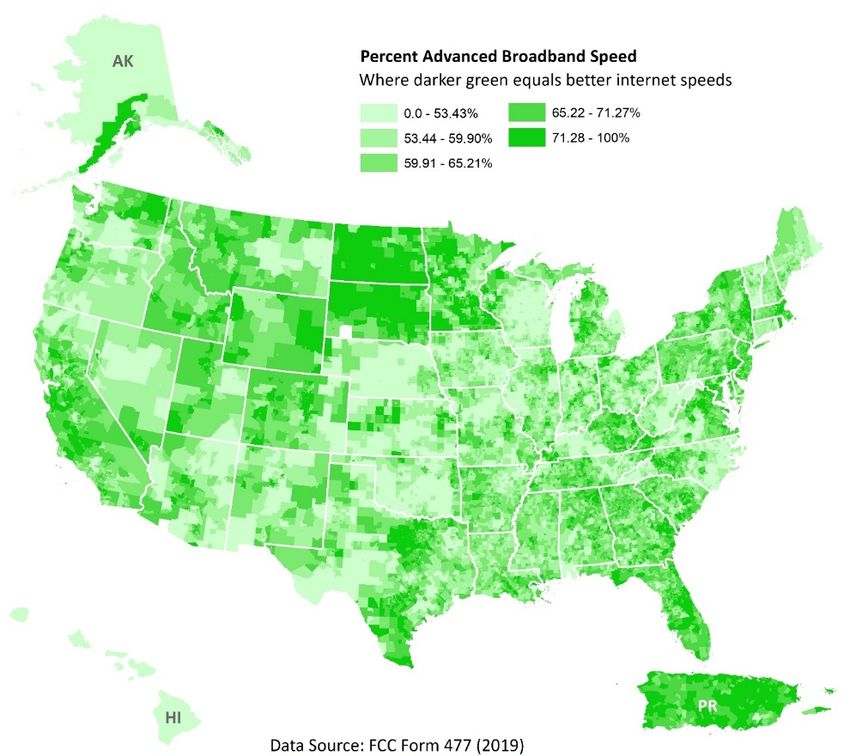
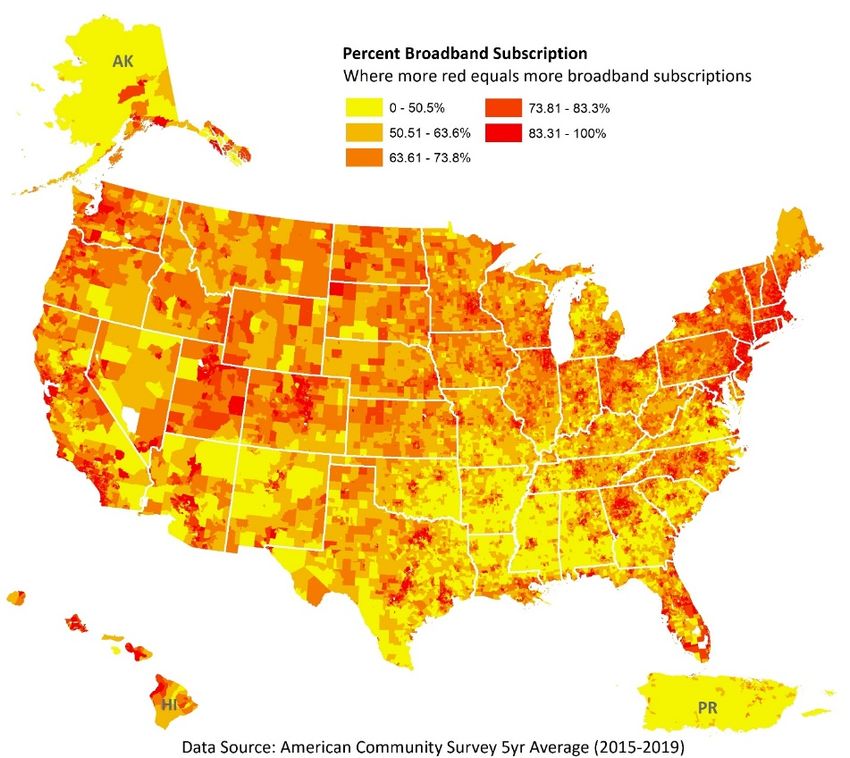
Figure 3: Advanced Broadband Speed for census tracts across the U.S. Darker green
regions indicate more blocks within the tract have access to advertised download speeds
greater than or equal to 25 mbps. Data from FCC Form 477 Data.

 Figure 4: Percent Broadband Subscription for census tracts across the U.S. Note: cell-
 only subscriptions are not included.
 12
 May 2021
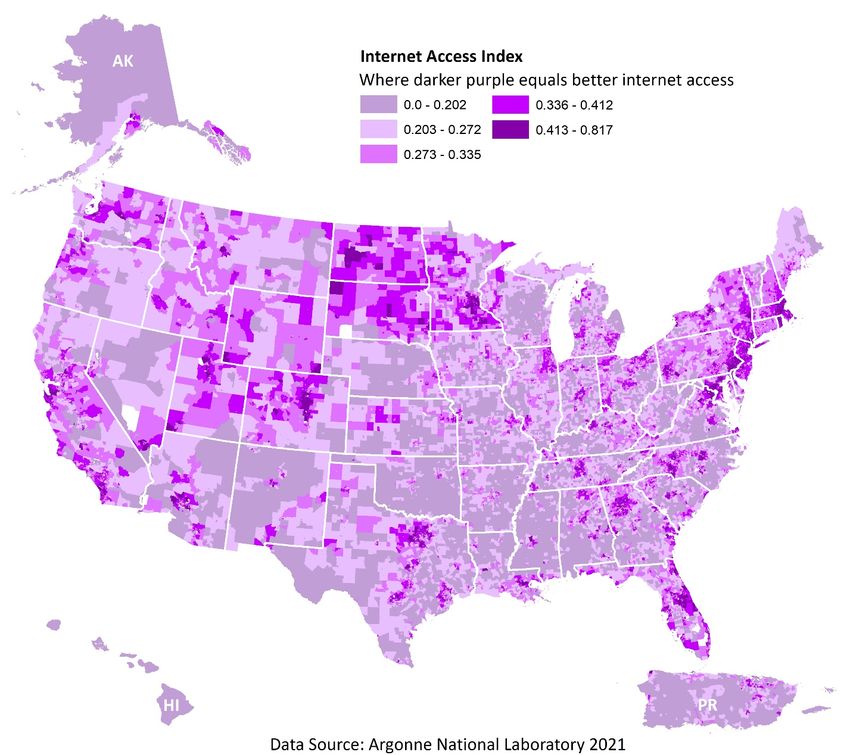
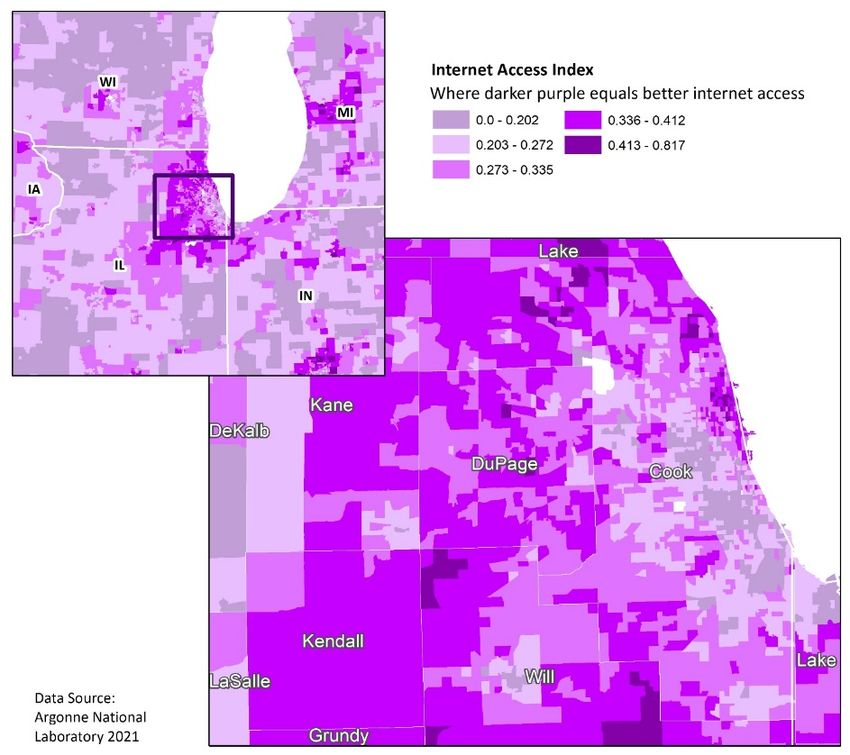
Internet Access Index

Figure 2: Resulting Internet Access Index (IAI) scores for the US. The IAI is the product of the Download Speed
Ratio, Percent Advanced Speed, and Percent Broadband Subscriptions. The index is scaled between 0 (poor access)
and 1 (more access). Darker purple regions indicate higher IAI scores and therefore more internet access.

Limitations
Following are discussions of limitations of this index:

Data quality. As with any index, the quality of the index is determined in large part by the quality and
completeness of the inputs. Data collected by the FCC are self-reported by the ISPs, leading to the
potential for broadband coverage to be overstated. There has been bipartisan agreement in Congress
to improve data collection on broadband service availability, however funding has yet to follow. Most
recently, the FCC opened a Notice of Proposed Rule Making In the Matter of Establishing the Digital
Opportunity Data Collection Modernizing the FCC Form 477 Data Program. This Order recognizes
the need for more granularity and more accuracy in the data collection and requests additional public
 13
 May 2021
comment on the data collection process. 15 As more granular and accurate nationwide data becomes
available in the future, Argonne will update the IAI accordingly.

Missing Data. There are some instances of missing values in the data sets used. Because the ACS data
are based on household survey data, there is always a chance of having tracts that are not sufficiently
populated to be represented (ex. National Parks), or are reported by other means such as Tribal land.
Calculations are available for 98.8% of the census tracts analyzed.

Lack of validation. There is no current dataset available to check the accuracy of the IAI. Argonne did
compare the IAI to an index that has been used to better understand the potential digital divide that
exists in the U.S. The Digital Divide Index (DDI) measures physical access/adoption of internet in
technology across the country at the county level. The DDI uses similar data from the ACS and FCC,
but layers in additional social measures such as: percent of homes without a computing device, percent
of the population over 65, and the individual poverty rate among others 16. To facilitate the comparison
of IAI with the DDI, Argonne aggregated the IAI from the Census tract level to the county level.
Overall, there exists a strong relationship (Pearson’s r = -0.34; p < 0.05) between the IAI and the DDI
for systematically selected states. Higher DDI values indicate greater distress (greater digital divide)
and is inversely scaled to the IAI with the negative relationship expected.

15 FCC, “Establishing the Digital Opportunity Data Collection Establishing the Digital Opportunity Data Collection,”
 FCC-20-94, July 17, 2020, https://www.fcc.gov/document/fcc-improves-broadband-data-and-maps-bridge-digital-
 divide-0.
16 Gallardo, R. (2020). Digital Divide Index. Purdue Center for Regional Development. Retrieved from Digital Divide
 Index (DDI): http://pcrd.purdue.edu/ddi
 14
 May 2021
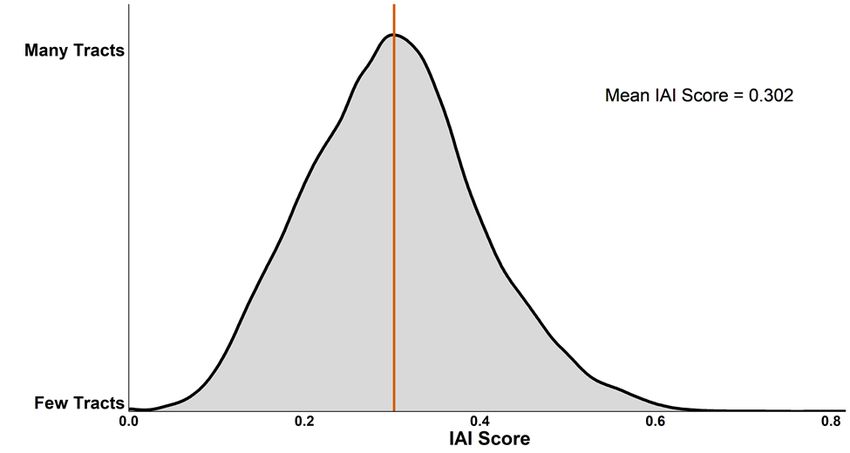
Key Results
The IAI serves as a general measure of
internet accessibility across the United
States. At the national scale, the mean
IAI score is 0.302 (median = 0.300)
with a minimum of 0 and a maximum
of 0.817. This means that the average
census tract within the U.S. scores just
over 30% of the maximum possible
score. The maximum score (1.0) of the
IAI would mean that all blocks within
the tract have access to the Advanced
Broadband Speed at the best speed
available, nationally (currently 1000
mbps), and that all households within Figure 3. Density distribution curve for the resulting IAI scores.
the tract have a fixed broadband
subscription of some type. The IAI’s tract-level results are summarized at the state level and represent
a ‘typical’ tract within each state (Table 2).

It is important to note that state-level
summary does not show the variability of
the census tract data. Argonne
recommends using the IAI at the tract-
level for the most accurate representation
of the results as is shown in this example
of Cook County, Illinois.

Additional findings include:
 • The District of Columbia
 showed the greatest average
 state-level score (0.5) and
 Hawaii the lowest (0.13) using
 the IAI.
 • New York showed the greatest
 difference (0.71) between the
 minimum (0) and maximum
 (0.71) state IAI Scores, whereas
 Hawaii showed the smallest range (0.21) with Figure 7: This view of the seven county region surrounding
 Chicago illustrates the variability of internet access at the
 a minimum IAI score of 0.04 and a maximum census tract level.
 score of 0.25.
 • The highest scoring Census tract can be found in Suffolk County Massachusetts (0.817)
 • 64% of the top 25 tracts are located in the District of Columbia.

 15
 May 2021
• The lowest scoring tracts using this index are generally located in more rural areas. Almost
 60% of the 25 lowest scoring tracts are located in Alaska.
 Table 2. National-scale summary statistics for the Internet Index and variables used in its
 calculation.
 Median Download Perc. Adv. Perc. Broadband Internet Index
 Statistic
 Speeds Speeds Sub. Score
 Min 1.0 0.00 0.0 0.000
 Q1 25.0 57.8 60.7 0.232
 Median 25.0 63.8 72.7 0.300
 Mean 32.0 63.4 70.4 0.302
 Q3 30.0 69.3 82.5 0.365
 Max 987.0 100.0 100.0 0.817
 NA's 33 33 888 913

Median Download Speeds
 • Nationally, Median Download Speed is about 32mbps for an average tract and ranges from 1
 mbps to 987 mbps (Table 2). The lowest median speeds coming from two tracts in rural
 Alaska and the fastest two tracts being located in Huntsville Alabama.
 • The District of Columbia had, on average, the highest (147.74 mbps Median Download
 Speed) median tract level internet speeds, whereas Hawaii had on average the lowest speeds
 (6.92 mbps Median Download Speed).
 • Alabama showed the greatest difference in Median Download speeds (difference = 969
 mbps) from a high of 987mbps to a low of 18 mbps.
Percent Broadband Subscriptions
 • Nationally, a typical tract sees about 70% of households subscribe to some form of fixed
 broadband services (Table 2). Percent Broadband Subscriptions ranged from census tracts
 with 0% (zero) to 100%. There are 26 census tracts that have zero Percent Broadband
 Subscriptions, with eight of those being located in New York and 3 each in Texas and Puerto
 Rico.
 • A total of 109 census tracts have estimates of 100 Percent Broadband Subscriptions, with
 New York and California accounting for 23 and 13 of those, respectively.
 • New Hampshire had the highest mean broadband subscription rate (80.62), and Puerto Rico
 recorded the lowest mean subscription rate (36.57%; Table 3).
 • Variability in broadband subscriptions was greatest in New York, Oklahoma, Tennessee,
 Michigan, North Carolina, Texas, California, Florida, South Carolina, and Connecticut,
 where the range of Precent Broadband Subscriptions were 100. This means that there are
 tracts where all households have a broadband subscription of some type and tracts were zero
 households have a fixed broadband subscription of some type.
 • Vermont saw the smallest difference (41.1%) between minimum (53.6%) and maximum
 (94.7%) Percent Broadband Subscriptions across tracts (Table 3).

 16
 May 2021
Percent Advanced Speed
Having access to advanced broadband speeds will be necessary in an ever increasing remote-access
society.
 • Nationally, the average Percent Advanced Speed value ranged from 0% (zero) to 100%
 within a tract. Approximately 63% of the blocks within a ‘typical’ tract met or exceeded the
 threshold for advanced broadband speeds.
 o Nationally, 14 census tracts do not have access to advanced broadband speeds, with
 10 tracts in Alaska and 4 tracts in Hawaii.
 o In 241 tracts every block has access to advanced internet speeds, with Florida, Puerto
 Rico, and Michigan composing 46, 39and 33 of those tracts, respectively.
 • The District of Columbia, Puerto Rico, and Colorado show the greatest access to Advanced
 Broadband Speed with averages of 84.45%, 74.04% and 73.18%, respectively (Table 3).
 • Hawaii, Oklahoma, and West Virginia showed the lowest levels of access to advanced
 broadband speeds (38.13%, 51.40%, 51.95%, respectively).
 • Alaska showed the greatest range between minimum and maximum Percent Advanced Speed
 (0% and 98.7%, respectively) and Rhode Island showed the smallest range (58.7% and
 77.2%, respectively) with a difference of 69.29% (Table 3).

Conclusion and Future Methodological Enhancements
The IAI index and accompanying map identify regions of the country that score very well where
households have adequate access to broadband infrastructure. However, there are also many areas of
that could be called broadband deserts where communities do not have quality access and therefore
may find it difficult to participate in an increasingly virtual environment. These areas of inequity are
not only realized at broad spatial scales, but can exist within the same city, or even from census tract
to census tract as seen in the Northeastern Illinois (Figure 7). Presenting the IAI with census-tract
granularity provides the means to target needed interventions at these specific areas. The straight-
forward nature of the index also allows for a rapid diagnosis of whether the challenges for an area are
the result of a lack of infrastructure (low Download Speed Ratio/ Percent Advanced Speed) or are a
lack of access (low Percent Broadband Subscriptions).

This initial IAI is intended to serve as a foundational resource that can help to analyze broadband
access related to critical services, such as education and healthcare. Argonne will continue to update
and refine the IAI as new data becomes available and new analytic use cases are identified. Specific
next steps could include:
 • Additional analytic opportunities:
 o Exploration of household access to distance learning, and the identification with
 locations with a potential ‘homework gap’ where students required to attend school
 remotely do not have adequate access to the requisite infrastructure.
 o Analysis of areas where telework may be inhibited due to lack of adequate broadband
 access.
 o Identification of areas where improved internet access may facilitate greater access to
 expansive healthcare services.
 o Identification of areas where programs that rely on email addresses or digital forms
 need to provide accommodations for those without easy internet access.
 17
 May 2021
• Methodology enhancements:
 o Scaling the index to multiple geographic extents (i.e. Census block, school district,
 county) to allow for further analytic flexibility.
 o Further analysis of regions that do not meet the 25mbps threshold of broadband
 internet.
 o Implementation of machine learning approaches to identifying additional
 characteristics that either support or result in higher index values.
 o Analysis of equitability of internet access by demographic and economic
 characteristics.
 o Qualitative analysis of missing data from US territories beyond Puerto Rico.

 18
 May 2021
Table 3. State-level summaries showing mean values [minimum value, maximum value] calculated from tract-level data. Mean
 values can be interpreted as a typical or average tract within each state or territory.
FIPS State/Territory Name State/Territory Abb Perc. Broadband Sub. Median Download Speed (mbps) Perc. Adv. Speeds IAI Value
 01 Alabama AL 58.39 [20.2, 96.6] 30.85 [18, 987] 61.52 [30.05, 83.98] 0.24 [0.04, 0.53]
 02 Alaska AK 68.81 [0, 92.8] 19.19 [1, 35] 52.75 [0, 98.71] 0.24 [0, 0.5]
 04 Arizona AZ 71.65 [6.4, 100] 33.87 [10, 100] 65.62 [33.71, 86.06] 0.33 [0.02, 0.67]
 05 Arkansas AR 54.83 [0, 91.9] 24.67 [5, 100] 59.93 [36.35, 76.33] 0.21 [0, 0.4]
 06 California CA 76.19 [0, 100] 29.83 [9, 100] 62.06 [39.53, 84.75] 0.32 [0, 0.62]
 08 Colorado CO 78.02 [6.4, 100] 56.69 [15, 100] 73.18 [35.29, 86.16] 0.42 [0.03, 0.68]
 09 Connecticut CT 77.47 [0, 100] 25.1 [18, 35] 57.29 [46.49, 72.97] 0.29 [0, 0.41]
 10 Delaware DE 75.86 [35.4, 99.1] 51.18 [25, 100] 67.31 [51.08, 78.46] 0.37 [0.14, 0.6]
 11 District of Columbia DC 73.42 [37.3, 100] 147.74 [25, 330] 84.45 [69.47, 94.36] 0.5 [0.22, 0.81]
 12 Florida FL 72.29 [0, 100] 30.89 [10, 100] 65.6 [41.47, 87.04] 0.32 [0, 0.63]
 13 Georgia GA 67.52 [9.5, 98.9] 36.66 [10, 100] 65.72 [40.05, 83.23] 0.31 [0.03, 0.59]
 15 Hawaii HI 76.68 [34.1, 100] 6.92 [2, 21] 38.13 [28.77, 49.52] 0.13 [0.04, 0.25]
 16 Idaho ID 70.07 [15, 91.9] 25.12 [12, 35] 68.64 [43.26, 84.9] 0.31 [0.06, 0.48]
 17 Illinois IL 70.16 [17.6, 100] 25.57 [4, 100] 59.63 [36.54, 84.03] 0.27 [0.06, 0.53]
 18 Indiana IN 66.12 [15.7, 100] 27.23 [8, 100] 58.2 [32.52, 84.19] 0.25 [0.03, 0.51]
 19 Iowa IA 67.54 [21, 100] 24.35 [5, 80] 57.76 [33.82, 77.56] 0.25 [0.08, 0.42]
 20 Kansas KS 68.89 [24.1, 97.2] 24.18 [5, 87.5] 57.07 [30.81, 78.74] 0.26 [0.08, 0.52]
 21 Kentucky KY 65.34 [23, 100] 29.85 [10, 100] 63.12 [37.49, 82.12] 0.28 [0.08, 0.56]
 22 Louisiana LA 60.35 [7, 100] 26.2 [10, 100] 55.2 [30.19, 76.57] 0.22 [0.02, 0.53]
 23 Maine ME 73.65 [41.1, 93.1] 24.47 [5, 25] 58 [44.04, 69.47] 0.28 [0.11, 0.38]
 24 Maryland MD 76.24 [17.1, 98.6] 40.14 [10, 100] 67.64 [42.04, 81.69] 0.36 [0.08, 0.62]
 25 Massachusetts MA 78.68 [33, 100] 51.91 [20, 200] 67.61 [49.28, 100] 0.39 [0.13, 0.82]
 26 Michigan MI 68.53 [0, 100] 28.81 [6, 100] 60.17 [34.52, 85.09] 0.28 [0, 0.56]
 27 Minnesota MN 73.76 [31.2, 97.4] 44.29 [18, 300] 72.7 [44.31, 86.41] 0.39 [0.13, 0.66]
 28 Mississippi MS 51.87 [17.5, 95.6] 26.33 [12, 100] 61.7 [43.13, 76.63] 0.21 [0.06, 0.48]
 29 Missouri MO 66.18 [22.8, 100] 24.73 [2, 100] 57.9 [29.61, 79.29] 0.25 [0.04, 0.51]

 19
 May 2021
30 Montana MT 68.86 [24.4, 94.9] 26.23 [5, 80] 64.15 [37.68, 82.78] 0.29 [0.09, 0.56]
31 Nebraska NE 71.75 [37.1, 95.6] 24.14 [5, 100] 57.67 [28.61, 73.86] 0.27 [0.07, 0.5]
32 Nevada NV 72.07 [19.8, 97.9] 54.61 [10, 100] 68.38 [42.51, 86.67] 0.36 [0.1, 0.64]
33 New Hampshire NH 80.62 [46.5, 96.2] 24.93 [7, 40] 61.36 [48.11, 80.9] 0.32 [0.19, 0.48]
34 New Jersey NJ 77.58 [18.8, 100] 29.6 [25, 100] 67.33 [53.85, 79.12] 0.35 [0.08, 0.51]
35 New Mexico NM 60.75 [2, 100] 28.42 [9, 80] 64.09 [30.96, 87.69] 0.26 [0.01, 0.51]
36 New York NY 73.62 [0, 100] 36.56 [18, 500] 67.82 [43.74, 86.44] 0.34 [0, 0.71]
37 North Carolina NC 69.78 [0, 100] 32.2 [6, 100] 61.66 [40.56, 82.56] 0.29 [0, 0.6]
38 North Dakota ND 70.08 [39.8, 95.2] 33.74 [25, 100] 71.55 [51.48, 82.66] 0.34 [0.15, 0.53]
39 Ohio OH 69.94 [8.9, 100] 26.12 [10, 100] 60.49 [36.5, 82.3] 0.28 [0.03, 0.5]
40 Oklahoma OK 61.38 [0, 100] 19.65 [3, 100] 51.4 [29.97, 78.61] 0.19 [0, 0.44]
41 Oregon OR 76.01 [39.1, 97.4] 34.01 [2, 100] 61.69 [30.95, 83.17] 0.32 [0.06, 0.58]
42 Pennsylvania PA 72.16 [25.1, 100] 36.75 [3, 500] 66.71 [40.94, 83.25] 0.33 [0.1, 0.7]
44 Rhode Island RI 75.27 [29.9, 93.1] 67.31 [25, 100] 69.29 [58.77, 77.2] 0.39 [0.13, 0.56]
45 South Carolina SC 64.6 [0, 100] 27.5 [10, 100] 64.65 [37.04, 81.46] 0.28 [0, 0.56]
46 South Dakota SD 69.35 [22.4, 93.5] 29.12 [25, 40] 70.71 [50.85, 85.48] 0.33 [0.09, 0.5]
47 Tennessee TN 64.11 [0, 100] 29.12 [3, 100] 62.31 [39.2, 82.08] 0.27 [0, 0.59]
48 Texas TX 65.58 [0, 100] 30.81 [6, 100] 62.98 [25.43, 87.5] 0.28 [0, 0.62]
49 Utah UT 78.12 [9.6, 97.4] 42.18 [2, 100] 72.98 [37.31, 87.76] 0.4 [0.03, 0.64]
50 Vermont VT 74.53 [53.6, 94.7] 21.05 [2, 25] 55.21 [42.88, 74.39] 0.25 [0.04, 0.41]
51 Virginia VA 73.13 [24.5, 100] 30.35 [5, 100] 66.57 [45.41, 81.78] 0.33 [0.08, 0.58]
53 Washington WA 79.23 [21.2, 100] 28.54 [10, 100] 63.72 [31.66, 85.66] 0.34 [0.05, 0.55]
54 West Virginia WV 66.25 [34.8, 89.2] 22.08 [6, 25] 51.95 [36.17, 70.32] 0.22 [0.09, 0.34]
55 Wisconsin WI 70.5 [22, 95.6] 21.9 [2, 45] 52.21 [31.26, 77.7] 0.23 [0.04, 0.43]
56 Wyoming WY 72.08 [40.9, 89.4] 28.81 [18, 50] 65.26 [46.36, 79.91] 0.32 [0.17, 0.48]
72 Puerto Rico PR 36.57 [0, 77.9] 41 [25, 100] 74.04 [52.09, 90] 0.19 [0, 0.46]

 20
 May 2021
Appendix A: Select Index Tables and Figures

 Table 4: List of the 25 highest scoring tracts on the Internet Index.
Rank Census Tract County State IAI Median Download Max. Download Perc. Adv. Max Download Perc.
 Value Speed (mbps) Speed (mbps) Speeds Speed (State) Broadband
 Sub.
 1 Census Suffolk Massachusetts 0.817 100 100 100.00 1000 100.00
 Tract County
 9901.01
 2 Census District District of 0.814 330 1000 94.36 1000 93.40
 Tract 15 of Columbia
 Columbia
 3 Census District District of 0.786 330 1000 92.20 1000 92.30
 Tract 14.01 of Columbia
 Columbia
 4 Census District District of 0.779 330 1000 92.52 1000 91.20
 Tract 12 of Columbia
 Columbia
 5 Census District District of 0.745 330 1000 90.49 1000 89.20
 Tract 10.01 of Columbia
 Columbia
 6 Census District District of 0.732 200 1000 88.54 1000 93.70
 Tract 5.02 of Columbia
 Columbia
 7 Census District District of 0.725 200 1000 89.72 1000 91.60
 Tract 8.01 of Columbia
 Columbia
 8 Census District District of 0.720 200 1000 88.27 1000 92.50
 Tract 7.01 of Columbia
 Columbia

 21
 May 2021
9 Census District District of 0.718 100 987 87.93 1000 100.00
 Tract 68.04 of Columbia
 Columbia
10 Census District District of 0.716 330 1000 90.39 1000 85.80
 Tract 16 of Columbia
 Columbia
11 Census New New York 0.706 200 1000 80.00 1000 100.00
 Tract York
 112.02 County
12 Census District District of 0.705 200 1000 86.69 1000 92.20
 Tract 3 of Columbia
 Columbia
13 Census District District of 0.705 200 1000 88.37 1000 90.40
 Tract 8.02 of Columbia
 Columbia
14 Census Delaware Pennsylvania 0.703 500 1000 81.13 1000 90.80
 Tract County
 4011.01
15 Census New New York 0.696 200 1000 81.32 1000 97.00
 Tract 95 York
 County
16 Census District District of 0.691 200 1000 90.73 1000 86.40
 Tract 6 of Columbia
 Columbia
17 Census District District of 0.691 200 1000 85.36 1000 91.80
 Tract 44 of Columbia
 Columbia
18 Census District District of 0.684 330 1000 86.84 1000 85.30
 Tract 24 of Columbia
 Columbia

 22
 May 2021
19 Census Douglas Colorado 0.683 100 987 86.16 1000 97.10
 Tract County
 140.08
20 Census New New York 0.677 200 1000 81.82 1000 93.80
 Tract 147 York
 County
21 Census Douglas Colorado 0.675 100 987 85.89 1000 96.30
 Tract County
 139.10
22 Census Maricop Arizona 0.673 100 1000 85.74 1000 96.20
 Tract 8141 a County
23 Census District District of 0.671 330 1000 87.17 1000 83.40
 Tract 93.01 of Columbia
 Columbia
24 Census District District of 0.671 200 1000 87.29 1000 87.10
 Tract 4 of Columbia
 Columbia
25 Census New New York 0.665 200 1000 80.95 1000 93.20
 Tract York
 112.01 County

 23
 May 2021
Table 5: List of the 25 lowest, non-zero, scoring tracts on the internet index. Index values of 0.000 in this table are the result of
 rounding. Results are presented in ascending order.

 Rank Census County State IAI Median Max. Download Perc. Adv. Max Download Perc.
 Tract Value Download Speed Speed (mbps) Speed Speed (State) Broadband Sub.
 (mbps)
 1 Census Yukon-Koyukuk Alaska 0.000 2 40 0.30 1000 32.50
 Tract 2 Census Area
 2 Census Southeast Alaska 0.000 2 200 0.25 1000 55.40
 Tract 1 Fairbanks Census
 Area
 3 Census Kodiak Island Alaska 0.000 2 50 0.24 1000 65.70
 Tract 1 Borough
 4 Census Bethel Census Area Alaska 0.001 2 35 1.25 1000 28.70
 Tract 3
 5 Census Fairbanks North Alaska 0.001 2 50 1.01 1000 35.60
 Tract 17 Star Borough
 6 Census Nome Census Area Alaska 0.002 2 35 2.68 1000 32.00
 Tract 1
 7 Census Southeast Alaska 0.005 2 1000 6.19 1000 42.80
 Tract 4 Fairbanks Census
 Area
 8 Census Socorro County New 0.008 25 35 63.97 1000 2.00
 Tract Mexico
 9400
 9 Census Fairbanks North Alaska 0.012 4 1000 6.49 1000 53.30
 Tract 19 Star Borough
 10 Census Oklahoma County Oklaho 0.013 3 1000 46.36 1000 9.90
 Tract ma
 1057
 11 Census Orleans Parish Louisia 0.017 20 1000 39.16 1000 7.00
 Tract 48 na
 24
 May 2021
12 Census Denali Borough Alaska 0.017 2 1000 12.05 1000 77.80
 Tract 1
13 Census Nome Census Area Alaska 0.018 2 25 16.75 1000 60.30
 Tract 2
14 Census El Paso County Texas 0.019 25 940 56.18 1000 5.10
 Tract 18
15 Census Yukon-Koyukuk Alaska 0.019 2 35 29.32 1000 35.10
 Tract 4 Census Area
16 Census Coconino County Arizon 0.023 25 115 54.12 1000 6.40
 Tract a
 9450
17 Census Northwest Arctic Alaska 0.023 2 35 28.81 1000 43.30
 Tract 1 Borough
18 Census Lares Municipio Puerto 0.023 25 100 62.77 1000 5.60
 Tract Rico
 9584
19 Census Apache County Arizon 0.024 25 115 50.91 1000 7.30
 Tract a
 9443
20 Census Caddo Parish Louisia 0.025 25 987 53.62 1000 7.10
 Tract na
 252
21 Census Prince of Wales- Alaska 0.026 2 35 25.66 1000 55.20
 Tract Hyder Census Area
 9401
22 Census Pueblo County Colora 0.027 25 987 64.41 1000 6.40
 Tract do
 9.03
23 Census Matanuska-Susitna Alaska 0.027 2 1000 21.65 1000 69.20
 Tract 2 Borough
24 Census Yukon-Koyukuk Alaska 0.027 2 35 36.28 1000 41.50
 Tract 3 Census Area

 25
 May 2021
25 Census Sandoval County New 0.029 25 100 54.45 1000 8.20
 Tract Mexico
 9409

 26
 May 2021
Figure 4: National map of households with cellular-only broadband subscriptions presented at
the Census tract level (ACS 5-yr average 2015-2019). Darker blue hues represent areas where
 more households have cell-only subscriptions.

 May 2021
Appendix B
To match the spatial scale among data sources, Argonne scaled the FCC Form 477 data up from the
Census block level to the tract level. To do this, the median of the maximum advertised download
speeds for all services in all blocks within a tract is recorded. Additionally, the greatest maximum
advertised download speed for blocks at the national level is used in the ratio calculation.

A Box-Cox transformation 17 (λ= -0.22) was performed on the entire distribution of median download
speeds (n = 74,001). After optimizing for λ, the maximum national download speed (1000mbps) was
transformed using the same equation prior to the calculation of the ratio (eq2). The transformed
numbers are then used to calculate the Download Speed Ratio that is then used in the greater IAI
calculation.

A Box-Cox transformation was performed on these data as the original data have a distinct long right
tail. Without the transformation this tail would persist through the index calculation, leading to less
actionable results for end users. Performing the transformation on these data prior to the ratio
calculation results in a final index distribution scaled between 0 and 1 that approximates a normal
distribution and allows for quantitative differences to be more easily described at lower index values.

17 Box, G.E.P. and D.R. Cox. 1964. An Analysis of Transformations. Journal of the Royal Society. Series B
 (Methodological). 26(2) pp. 211-252.
 May 2021
National Preparedness Analytics Center
Decision and Infrastructure Sciences Division
Argonne National Laboratory
9700 South Cass Avenue, Bldg. #203
Argonne, IL 60439

www.anl.gov

Argonne National Laboratory is a U.S. Department of Energy
laboratory managed by UChicago Argonne, LLC
You can also read


