Application of Machine Learning in Cricket and Predictive Analytics of IPL 2020 - Preprints.org
←
→
Page content transcription
If your browser does not render page correctly, please read the page content below
Preprints (www.preprints.org) | NOT PEER-REVIEWED | Posted: 21 October 2020                doi:10.20944/preprints202010.0436.v1

                  Application of Machine Learning in Cricket and
                                 Predictive Analytics of IPL 2020
                                                       Anurag Sinha
                   Department of computer science and IT, Student, Amity University Jharkhand Ranchi,
             Jharkhand

                                                         (India), 834001

                                                  anuragsinha257@gmail.com

             Abstract: - In cricket, particularly the twenty20 format is most watched and loved by the people, where no
             one can guess who will win the match until the last ball of the last over. In India, The Indian Premier
             League (IPL) started in 2008 and now it is the most popular T20 league in the world. So we decided to
             develop a machine learning model for predicting the outcome of its matches. Winning in a Cricket Match
             depends on many key factors like a home ground advantage, past performances on that ground, records at
             the same venue, the overall experience of the players, record with a particular opposition, and the overall
             current form of the team and also the individual player. This paper briefs about the key factors that affect
             the result of the cricket match and the regression model that best fits this data and gives the best
             predictions. Cricket, the mainstream and widely played sport across India which has the most noteworthy
             fan base. Indian Premier League follows 20-20 format which is very unpredictable. IPL match predictor is
             a ML based prediction approach where the data sets and previous stats are trained in all dimensions
             covering all important factors such as: Toss, Home Ground, Captains, Favorite Players, Opposition
             Battle, Previous Stats etc, with each factor having different strength with the help of KNIME Tool and
             with the added intelligence of Naive Bayes network and Eulers strength calculation formula.

             Keywords: Naïve Bayes Classification, Eulers Strength Formula, Cricket Prediction, Supervised
             Learning, KNIME Tool, Cricket prediction, sports analytics, multivariate regression, neural network

             Applications

             The main objective of sports prediction is to improve team performance and enhance the chances of
             winning the game. The value of a win takes on different forms like trickles down to the fans filling the
             stadium seats, television contracts, fan store merchandise, parking, concessions, sponsorships, enrollment
             and retention   .
             Data

             Real world data is dirty. We can’t expect a nicely formatted and clean data as provided by Kaggle.
             Therefore, data pre-processing is so crucial that I can’t stress enough how important it is. It is the most
             important stage as it could occupy 40%-70% of the whole workflow, just to clean the data to be fed to your
             models.

             I scraped three scripts from Crickbuzz website comprising of rankings of teams as of May 2019, details of
             the fixtures of 2019 world cup and details of each team’s history in previous world cups. I stored the above
             piece of data in three separate csv files. For the fourth file, I grabbed odi data-set for matches played
             between 1975 and 2017 from Kaggle in another csv file. In this file, I removed all the data from 1975 to

            © 2020 by the author(s). Distributed under a Creative Commons CC BY license.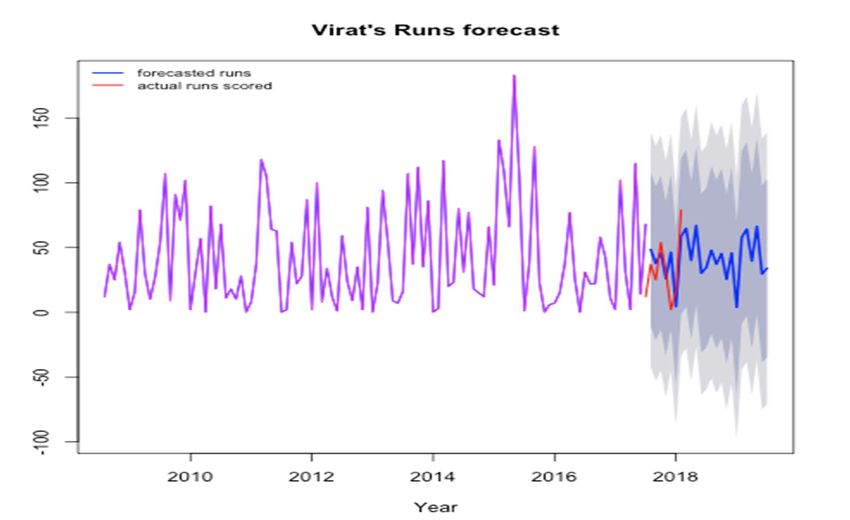
Preprints (www.preprints.org) | NOT PEER-REVIEWED | Posted: 21 October 2020                  doi:10.20944/preprints202010.0436.v1

             2010. This was done as the results of the last few years should only matter for our predictions. Since I
             didn’t get the data for 2018 and 2019 so this model might not be that accurate but still I believe this gives a
             fairly good idea. Then I did manual cleaning of the data as per my needs to make a machine learning model
             out of it.

              INTRODUCTION

             After football, cricket is most loved and watched by many individuals in the world but in India cricket is
             the most loved sport. In the past few years, lots of research papers are published and lots of work is done
             which predicts the result of a cricket match by using the factors that affect the match outcome and they
             are using the supervised machine learning algorithms to predict the outcome of the match like Linear
             regression, support vector machines, logistic regression, decision tree, Bayes network, random forest.
             Cricket is one of the most well-liked sports in the world. Especially the Twenty20 format is very popular
             as it is a fast-paced form of the game that attracts the spectators at the ground and the viewers at home.
             The Indian Premier League (IPL) is a professional Twenty20 cricket league that is governed by the Board
             of Control for Cricket in India (BCCI). The Indian Premier League is conducted every year and
             participating teams represent a city in India. Various natural factors affect the game, the hype has given
             by the media, and a huge market like fantasy 11 and betting on sites has provided a lot of importance to
             the model. The rules of the game, the skill of the players, their form, and various other natural factors are
             very important in the prediction accuracy of the result of a cricket match. As the technology is growing
             and the apps like fantasy 11 and betting sites are getting popular the people going to use the predictions
             given by the machine learning model. The use of machine learning makes life easier in many aspects. To
             predict the outcome of a cricket match we are not going to rely on a single machine learning algorithm we
             are going to use all the machine learning algorithms. In machine learning, there are two types of learning
             supervised learning and unsupervised learning. In Unsupervised learning, the data is not properly labelled
             so the machine has to sort the data according to patterns, combinations without any training given. But in
             supervised learning, the data is labelled with the proper classification so the machine can easily analyze it
             and produce the correct result. For our application, the unsupervised learning models are not of any use
             because the data of cricket matches are properly labelled. So we are going to use the supervised learning
             models. In Supervised learning, there are again two types are classification and regression. Classification
             is used to classify among categories like red or blue and Regression is used when the output is a real
             number like rupees or height. In our model, we are going to use regression because the outcome will be
             the winning percentage and it is of type number. Our main objective is to find the key factors that affect
             the match outcome and select the best machine learning model that best fits this data and gives the best
             results. Some works already have been published in this area of predicting the outcome of a cricket
             match. In some paper, only a few key factors are taken for prediction so the accuracy is less. Whereas in
             some paper the machine learning model is not appropriate. So it is important to take all the key factors
             that can affect the match outcome and as well as to select the best model for training and testing the data.
             This will increase the prediction accuracy drastically.

             LITERATURE REVIEW

             An extensive online search produced very few articles related to players’ performance prediction in the
             game of cricket. A very small number of researchers have studied the performance of cricket players.
             Muthuswamy and Lam [1] predicted the performance of Indian bowlers against seven international teams
             against which the Indian cricket team plays most frequently. They used back propagation network and
             radial basis network function to predict how many runs a bowler is likely to concede and how many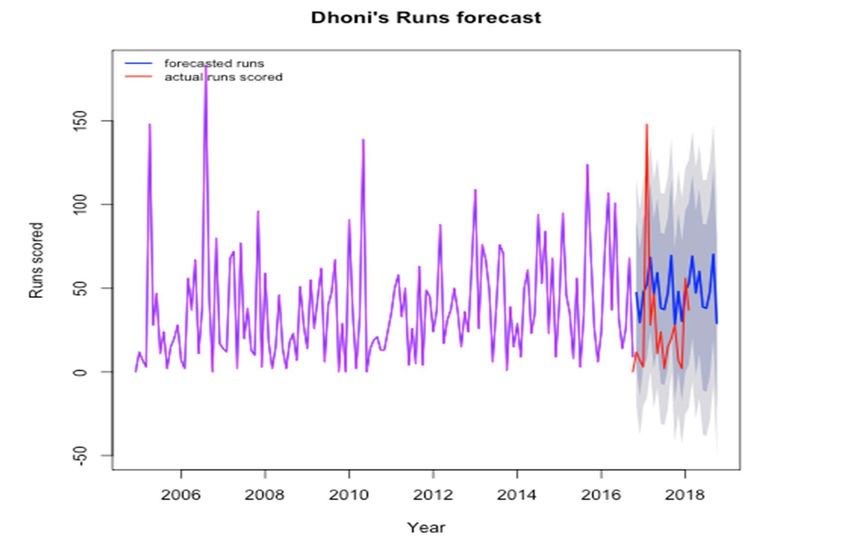
Preprints (www.preprints.org) | NOT PEER-REVIEWED | Posted: 21 October 2020               doi:10.20944/preprints202010.0436.v1

             wickets a bowler is likely to take in a given ODI match. Wikramasinghe [2] predicted the performance of
             batsmen in a test series using a hierarchical linear model. Barr and Kantor [3] defined a criterion for
             comparing and selecting batsmen in limited overs cricket. They defined a new measure P(out) i.e.
             probability of getting out and used a two-dimensional graphical representation with Strike Rate on one
             axis and P(out) on another. Then they define a selection criterion based on P(out), strike rate and batting
             average of the batsmen. Iyer and Sharda [4] used neural networks to predict the performance of players
             where they classify batsmen and bowlers separately in three categories – performer, moderate and failure.
             Based on the number of times a player has received different ratings, they recommend if the player should
             be included in the team to play World Cup 2007. Jhanwar and Paudi [5] predict the outcome of a cricket
             match by comparing the strengths of the two teams. For this, they measured the performances of
             individual players of each team. They developed algorithms to model the performances of batsmen and
             bowlers where they determine the potential of a player by examining his career performance and then his
             recent performances. Lemmer [6] defined a new measure called Combined Bowling Rate to measure the
             performance of bowlers. The combined bowling rate is a combination of three traditional bowling
             measures: bowling average, strike rate and economy. Bhattacharjee and Pahinkar. [7] used this combined
             bowling rate to analyze the performance of bowlers in Indian Premier League (IPL). They also
             determined other factors that affect the performance of bowlers and applied multiple regression model to
             identify the factors that are empirically responsible for the performance of bowlers. Mukharjee. [8]
             applied Social Network Analysis to rate batsmen and bowlers in a team performance. He generated a
             directed and weighted network of batsmen-bowlers using player-vs-player information available for test
             and ODI cricket. He also generated a network of batsmen and bowlers using the dismissal record of
             batsmen in the history of cricket. Shah [9] also defined new measures to measure players’ performance.
             The new measure for batsmen takes into account the quality of each bowler he is facing and the new
             measure for bowlers considers the quality of each batsman he is bowling to. The aggregate of individual
             performance of a batsman against each bowler is the total performance index of the batsman. Similarly,
             the aggregate of individual performance of a bowler against each batsman is the total performance index
             of the bowler. Parker, Burns and Natarajan. [10] defined a model for valuation of players for IPL auction.
             Their model considered factors like previous bidding price of the player, experience of the player, strike
             rate etc. Prakash, Patvardhan. and Lakshmi [11] defined batting index and bowling index to rank players’
             performance for their models to predict outcomes of IPL matches. Ovens and Bukiet [12] applied a
             mathematical approach to suggest optimal batting orders for ODI matches. Our work is probably the first
             generalized approach to predict how many runs will a batsman score and how many wickets will a player
             take on a particular match day. Muthuswamyand Lam [1] carried out a similar study predicting how many
             wickets will a bowler take using neural networks but their work was limited to eight Indian bowlers and is
             difficult to generalize for all the bowlers in the world. We used some supervised machine learning
             algorithms to build prediction models that can be used to predict the performance of any player in a given
             match.

             A. Rabindra Lamsal and Ayesha Choudhary [1] In this paper, they have taken the data of matches from
             the official website of the Indian Premier League. That data had many features so they analyzed the data
             and selected some key features. They had used the scikit-learn machine learning library to pre-process the
             data and applied some selection models. They removed the low variance, univariate and recursive
             features. Byusing these feature selection models they found 5 key features from 15. The features are home
             team, away team, venue, toss winner, toss decision and winner. They had trained the Random Forests and
             Multiple Linear Regression model by 10 seasons of IPL data and trained by the 11th season's data. 41 out
             of 60 matches their model able to classify correctly. So their accuracy is 68.33% which is not so good.
             Limitations of this model are it uses only 5 features and only 2 machine learning models. B. Abhishek
             Naik, Shivanee Pawar, Minakshee Naik, Sahil Mulani [2] This paper processes the data dynamically and
             gives a prediction as the match progresses. Before the match starts their prediction depends on the factors
             like batting, bowling, batting order, captain of both the teams and batting-bowling stats on that ground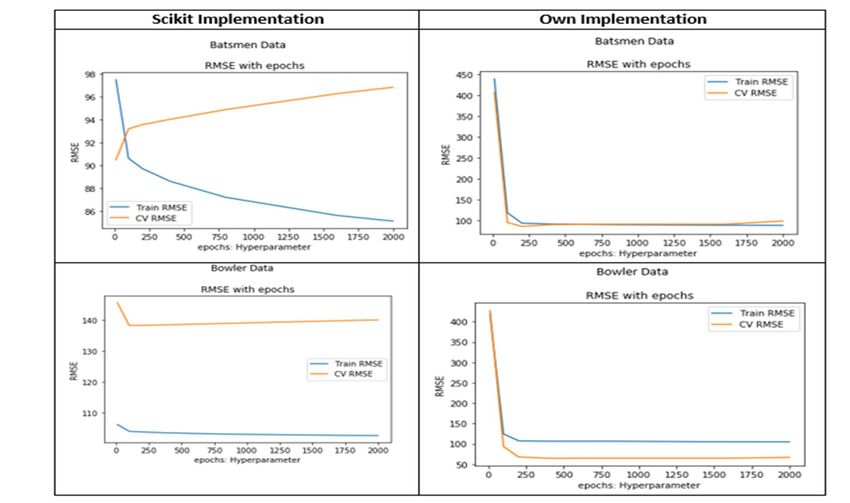
Preprints (www.preprints.org) | NOT PEER-REVIEWED | Posted: 21 October 2020 doi:10.20944/preprints202010.0436.v1
against that opponent and after the match starts their prediction depends on batsman-bowler performance
and battingbowling order of particular player. They are predicting only the one day international (ODI)
matches by using the logistic regression and K-means clustering. In this paper, they had only tested this
model on one match which is India vs Australia happed on 26th March 2015 at Sydney cricket ground
and their prediction was correct. Their predictions can go wrong sometimes because they are fluctuating
on every ball. C. Singhvi, Arjun, Ashish Shenoy, Shruthi Racha and Srinivas Tunuguntla [3] In this
paper, they have taken 16 features to train the model. Features are like average runs scored by a player,
the average number of 4s and 6s hit by a player, average strike rate of a player, number of times the
player is not out, numbers of the 50s and 100s scored by the player, total number of matches played by a
player, current and average batting position, average number of wickets taken in a match by bowler,
average economy and average runs conceded, average number of wide and no-balls bowled and last is
average number of maiden overs bowled. They had taken the data of all T20 matches domestic, league
matches and international. Many machine learning algorithms are used like Randomizes Forest, Naive
Bayes, Decision Trees, Linear SVM, Non-Linear SVM and they are trained by data of 5390 T20 matches.
After testing the model the Support Vector Machine given the best accuracy of prediction which is
63.89%. D. Swetha, Saravanan.KN [4] In This paper only briefs about the key factors that cricket match
depends on. No machine learning model is trained to predict the match result. The factors discussed in
this paper are pitch, toss, and team strength, past records, home ground advantage, current performance,
and weather. Pitch plays a very important role in the match because how the ball will behave is totally
dependent on it. Toss is also important the teams chasing first wins more matches as the target is known
and dew comes in play after evening. By calculating the average of all players and the current form of
players we can easily find out the team strength. Past performances play a vital role in prediction, what is
the performance of a team on the ground against a particular opponent is very important. If a team is
playing on the home ground then crowd support becomes the 12th man of the team also the players are
familiar with the playing conditions. The current form of the team and players is also important to predict
the winner. The weather condition also affects the swing of the ball and the match outcome. These
features can be used to train the model to get better prediction accuracy. E. Geddam Jaishankar Harshit,
Rajkumar S [5] This paper compares various supervised machine learning algorithms that can be used to
predict the match result. A dataset of 5000 one day international matches is taken from Cricinfo and 70%
is used to train the model and 30% is used to test the model. They are using Support Vector Machine,
Logistic Regression, Decision Tree and Bayes Classifier as machine learning algorithms. They got 60%,
65%, 67% and 72% respectively. So as we can see the Bayes classifier has the best accuracy among all.
Analytics in Cricket
Dhoni vs Kohli |Cricket Analytics Part 3 – Drawing Useful Inferences from Machine
Learning
In the final post of the series, we will make use of Machine Learning techniques for complex analysis.
Before explaining how to implement this in R, we would like to emphasize the importance of machine
learning in sports especially cricket.
Machine Learning(ML) has brought about a positive change in most of the fields. It can also be applied in
sports like cricket.ML can improve the performance and accuracy of players and develop better strategies
for the upcoming games. This can be done by predicting the runs scored by a player or the team, the
wickets that can be taken and finally predicting the final result of the match. It is always important to
select the correct variables so that the prediction is accurate. In the post we will focus on applying ML
techniques to the dataset in R. As we are dealing the batting dataset of Virat Kohli and MS Dhoni, we will
be dealing with the following variables:
Runs which indicates the runs scored by the player.
BF which indicates the balls faced by the player.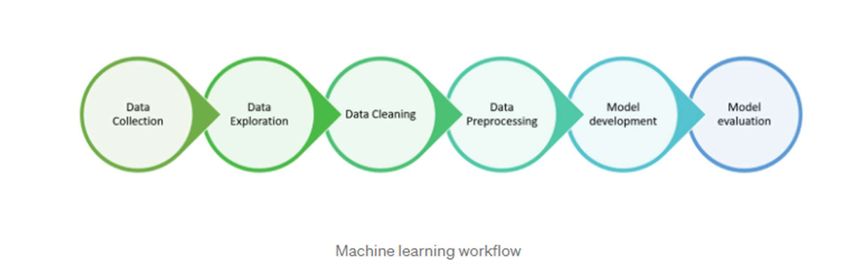
Preprints (www.preprints.org) | NOT PEER-REVIEWED | Posted: 21 October 2020 doi:10.20944/preprints202010.0436.v1
Mins which indicates the minutes spent at the crease by the player.
Before proceeding with the complex analysis it is important that we extract and clean the data.
Holt-Winters Model for predicting the runs that can be scored
The batsmanPerfForecast function is available in cricketr package.This function is used for predicting the
performance of the player in terms of runs. The parameters that need to be passed are:
file which indicates the file name.Here, kohliOd and dhoniOd are the file names of Virat and
Dhoni respectively.
name which indicates the name of the player whose performance needs to be predicted.
The working of the function is explained below :
Based on the total number of rows available in the dataset the training and the testing data are divided in
90:10 ratio. The model used here to fit the training data is Holt-Winters Model. This model is used for
predicting the runs by minimizing the squared error of prediction. It works on the basic principle of time
series forecasting. Time series forecasting makes use of previous month’s or day’s or year’s data to
forecast the value for future. The starting month and the corresponding year and the ending month and the
corresponding year (which is at 0.9 of the length of the rows) is the range for which the runs are taken for
the training dataset. The similar procedure is followed for the rest of the 10% runs for creating a testing
set. Then the Holt-Winters Model is trained using this data and the data forecasted is stored separately.
This model is mostly employed in those situations that show a pattern repeating over some time i.e- a
trend, a season or both. The usual forecasting methods require the weighted average of the data. Whereas
this model forecasts by associating the data with exponential weighted moving average. This method is
also called Triple exponential smoothing because of its three parameters:
1. Alpha parameter: This estimates the level component at the current point of time.
2. Beta parameter: This estimates the trend component at the current point of time. This can be seen
by the slope.
3. Gamma parameter: This estimates the seasonal component at the current point of time.
The above three parameters have a value between 0 and 1. If the values are close to zero then it means
that the recent data points have been given less weight in comparison to the old data points while making
the predictions.
After all the data has been generated it is plotted as seen below. The main features of the plot are :
The training data is plotted as a line in magenta color.
The testing data is plotted as a line in red color.
The forecasted data is plotted as a line in blue color.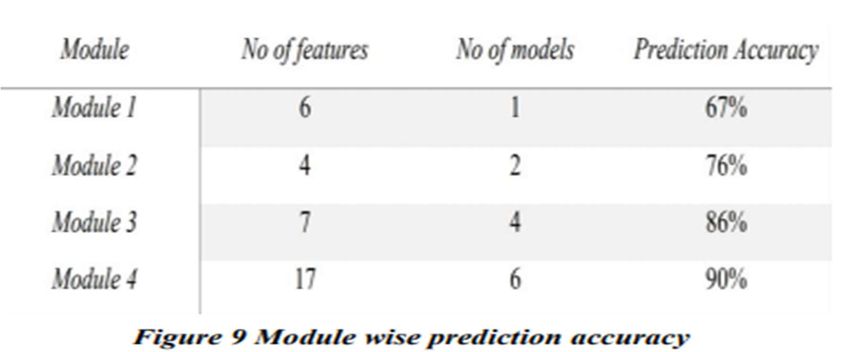
Preprints (www.preprints.org) | NOT PEER-REVIEWED | Posted: 21 October 2020 doi:10.20944/preprints202010.0436.v1
From above we can observe the following:
The value of alpha is 0.06946173 which is very low indicating that value of the level component
at the current point of time relies less on recent and more on the past data.
The value of beta is 0.04646374 which is very low indicating that value of the trend component at
the current point of time relies less on recent and more on the past data. From the plot below you
can observe that slope doesn’t change a lot.
The value of gamma is 0.2026552 which is low indicating that value of the seasonal component
at the current point of time relies less on recent and more on the past data.
The list of coefficients specifies the value of the level, trend and seasonal component for each month.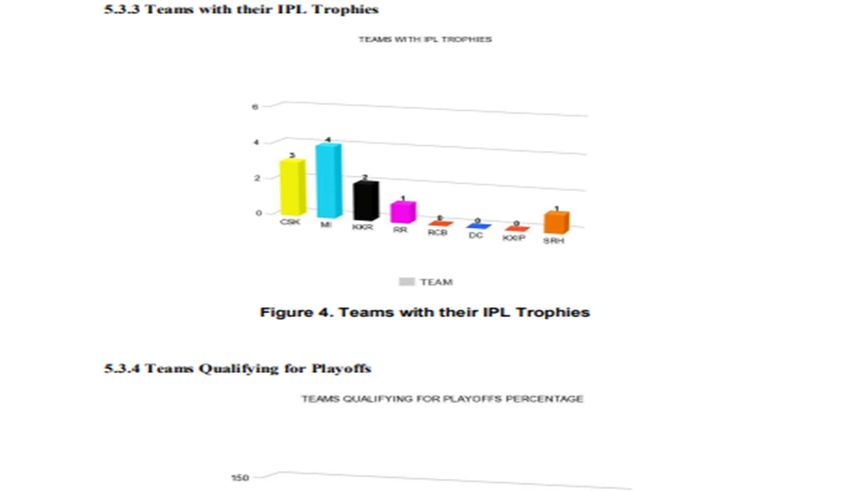
Preprints (www.preprints.org) | NOT PEER-REVIEWED | Posted: 21 October 2020 doi:10.20944/preprints202010.0436.v1
K Means for predicting player’s runs scoring likelihood in %
Next we have used the batsmanRunsLikelihood function available in cricketr package.This function is
used for predicting the runs likelihood in terms of percentage, based on the balls faced and the minutes
spent at the crease of Kohli. The parameters that need to be passed are:
file which indicates the file name.Here, kohliOd and dhoniOd are the file names of Virat and
Dhoni respectively.
name which indicates the name of the player whose performance needs to be predicted.
The working of the function is explained below :
The function makes use of K Means Clustering technique. It is an unsupervised technique used for
grouping similar instances together in a cluster. The number of the clusters to be formed needs to
specified. Here the number of clusters formed is three. The kmeans function is used for getting the three
centroids of the three clusters. The below plot is a 3D scatterplot having the centroid of the clusters
plotted. The three centroids are colored in red, blue and black. The three axes are as follows:
The x-axis indicates the number of balls faced.
The y-axis indicates the minutes spent at the crease.
The z-axis indicates the runs scored by the player.
The significance of three clusters is to emphasize on the three phases of the batsman that is the beginning,
the middle and the end of the innings. The first cluster formed is closer to the origin, the second one
somewhere in the middle and the third cluster is far away from the origin. The percentage likelihood in
the summary is calculated by dividing the sum of the data points in a particular cluster divided by the
number of data points in all the three clusters.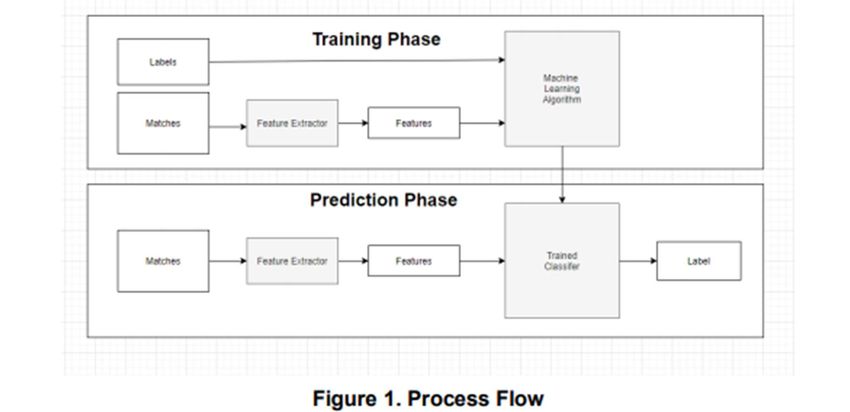
Preprints (www.preprints.org) | NOT PEER-REVIEWED | Posted: 21 October 2020               doi:10.20944/preprints202010.0436.v1

             The above table gives the z,x and y values of the centers (column-wise) of the three clusters(row-wise) for
             Dhoni.

             4. Process Flow The process stream shows how the entire procedure of the project is done and the result is
             seen. The following flow chart shows the procedure: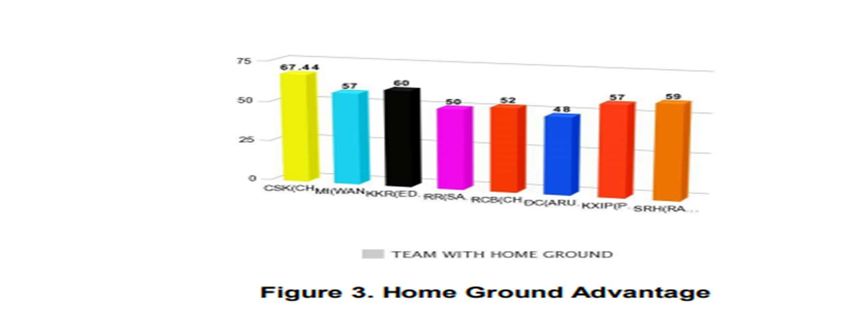
Preprints (www.preprints.org) | NOT PEER-REVIEWED | Posted: 21 October 2020            doi:10.20944/preprints202010.0436.v1

             I followed the general machine learning workflow step-by-step:

                 1. Data cleaning and formatting.

                 2. Exploratory data analysis.

                 3. Feature engineering and selection.

                 4. Compare several machine learning models on a performance metric.

                 5. Perform hyper-parameter tuning on the best model.

                 6. Evaluate the best model on the testing set.

                 7. Interpret the model results.

                 8. Draw conclusions and document work.

             1. Data cleaning and formatting

             Next, let’s display the details of matches played by India.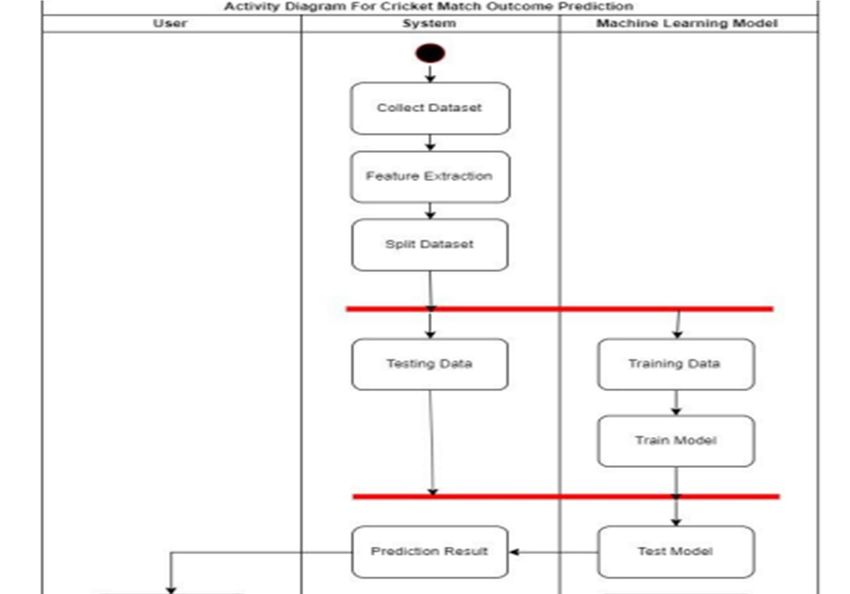
Preprints (www.preprints.org) | NOT PEER-REVIEWED | Posted: 21 October 2020                    doi:10.20944/preprints202010.0436.v1

             2. Exploratory data analysis

             After that, I merged the details of the teams participating this year with their past results.

             I deleted the columns like date of the match, margin of victory, and the ground on which the match was
             played. These features doesn’t look important for our prediction.

             3. Feature engineering and selection

             This is probably the most important part in the machine learning workflow. Since the algorithm is totally
             dependent on how we feed data into it, feature engineering should be given topmost priority for every
             machine learning project.
Preprints (www.preprints.org) | NOT PEER-REVIEWED | Posted: 21 October 2020 doi:10.20944/preprints202010.0436.v1
Perform hyperparameter tuning on the best model
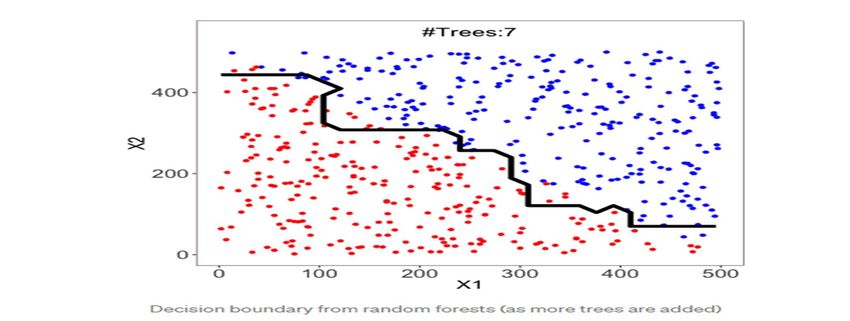
The popularity of the Random Forest model is explained by its various advantages:
Accurate and efficient when running on large databases
Multiple trees reduce the variance and bias of a smaller set or single tree
Resistant to overfitting
Can handle thousands of input variables without variable deletion
Can estimate what variables are important in classification
Provides effective methods for estimating missing data
Maintains accuracy when a large proportion of the data is missing
Evaluate the best model on the testing set
Let’s continue. I added IPL rankings of teams giving priority to higher ranked team to win this year.
Next, I added new columns with ranking position for each team and slicing the dataset for first 45 games
since there are 45 league stage games in total.
Predicting IPL-2020 Winner
Classification and Regression are the two branches of Supervised Learning in the field of Machine
Learning. These are the basic topics that one should learn when starting their journey with Machine
Learning. Doing projects is the only way through which one can learn and master these topics.
In my previous blog, I did a classification project. Having learnt some of the concepts in Classification, the
time has arrived for me to make my hands dirty with Regression.Preprints (www.preprints.org) | NOT PEER-REVIEWED | Posted: 21 October 2020 doi:10.20944/preprints202010.0436.v1
Dataset:
We have scraped the data from ICC’s T20 top 100 players and Cricbuzz websites using Beautiful Soup
module and obtained the data for Batsmen, Bowler and All-Rounder separately.
Features used for Batsmen:
Innings
Runs Scored
Batting Average
Batting Strike Rate
Fifties
Fours
Sixes
Features used for Bowlers:
Innings
Wickets
Economy
Bowling Average
Bowling Strike Rate
Features used for All-Rounders:
Innings as Batsmen
Runs Scored
Batting Average
Batting Strike Rate
Fifties
Fours
Sixes
Innings as Bowler
Wickets
Economy
Bowling AveragePreprints (www.preprints.org) | NOT PEER-REVIEWED | Posted: 21 October 2020 doi:10.20944/preprints202010.0436.v1
Bowling Strike Rate
Now that we have our data, it is time for us to observe and understand the data.
Data Pre-Processing:
We have plotted the histogram of the data and observed that the data is highly right skewed. To overcome
the skewness, we have log-transformed the data, so that the data is now approximately normal and our
models work well.
We have observed that some records have 0 values for some of the features. We have dropped those
records from our datasets. Most probably they are the players who played very less number of matches.
Model Building:
Now that we have processed and cleaned our data, we have to build the machine learning models on this
cleaned data. We have implemented SGDRegressor, KNN-Regressor,Linear Regression using Least-
Square Estimates, Weighted KNN-Regressor and compared our models with the Scikit learn’s model and
we have achieved almost similar results to that of the Scikit Implementation.Preprints (www.preprints.org) | NOT PEER-REVIEWED | Posted: 21 October 2020 doi:10.20944/preprints202010.0436.v1
SGD-Regressor:
We have provided the training data as the input to the models and found the best number of epoch using
Cross Validation Data. AS we can see in the plots, the training error decreases as the epochs increases
which means we are going towards convergence. We can increase the number of epochs to reduce the error
furthermore, but we have stopped at 2000 epochs as the error fall rate is almost steady at this point.
We have got the best number of epochs using cross validation. Now, we can run the model with this best
number of epochs on test data and we can obtain the predicted values. We can then compare our predicted
values with the actual values to get the error.
After running our model on the test data, we get the below results.Preprints (www.preprints.org) | NOT PEER-REVIEWED | Posted: 21 October 2020 doi:10.20944/preprints202010.0436.v1
We can see that Scikit implementation is almost similar to our results.
KNN-Regressor:
We have provided the training data as the input to the models and found the best number of neighbours
using Cross Validation Data. As we can see from the plots, the training error increases as the value of K
increases, which means that smaller values of K leads to overfitting and larger values of K leads to
underfitting.Preprints (www.preprints.org) | NOT PEER-REVIEWED | Posted: 21 October 2020 doi:10.20944/preprints202010.0436.v1
We have got the best number of neighbors using cross validation. Now, we can run the model with this
best number of epochs on test data and we can obtain the predicted values. We can then compare our
predicted values with the actual values to get the error.
After running our model on the test data, we get the below results.Preprints (www.preprints.org) | NOT PEER-REVIEWED | Posted: 21 October 2020 doi:10.20944/preprints202010.0436.v1
Data Visualization: The following is the data depicting the various statistics related to the project which
impacts the outcome of the winning team.Preprints (www.preprints.org) | NOT PEER-REVIEWED | Posted: 21 October 2020 doi:10.20944/preprints202010.0436.v1
Home Ground AdvantagePreprints (www.preprints.org) | NOT PEER-REVIEWED | Posted: 21 October 2020 doi:10.20944/preprints202010.0436.v1
DESIGNPreprints (www.preprints.org) | NOT PEER-REVIEWED | Posted: 21 October 2020 doi:10.20944/preprints202010.0436.v1
In the class diagram, there are 5 classes. The user has new data of match for prediction. The model can be
trained and tested using a dataset. Match dataset contains all the features and labels. Match dataset is split
into training and testing datasets.
Use Case DiagramPreprints (www.preprints.org) | NOT PEER-REVIEWED | Posted: 21 October 2020 doi:10.20944/preprints202010.0436.v1
Activity Diagram
RESULT
After performing the ML algorithms, we obtained the following results based on different factors:Preprints (www.preprints.org) | NOT PEER-REVIEWED | Posted: 21 October 2020 doi:10.20944/preprints202010.0436.v1
CSK vs SRH (with toss)Preprints (www.preprints.org) | NOT PEER-REVIEWED | Posted: 21 October 2020 doi:10.20944/preprints202010.0436.v1
CSK vs SRH (without toss) Tosses are considered important in cricket, as captain makes the decision if
the team wants to bowl or bat on the basis of pitch. from above results we can see how the toss is
influencing the match outcomes.
As the above graph shows the prediction accuracy of each module. We can see each module is giving
more prediction accuracy B. Module wise prediction accuracy.Preprints (www.preprints.org) | NOT PEER-REVIEWED | Posted: 21 October 2020 doi:10.20944/preprints202010.0436.v1
As the above table shows the prediction accuracy of each module and how many features are used to feed
the machine learning model and how much machine learning models are used. We can see each module is
giving more prediction accuracy than the previous module. We have selected 6 main key features for the
first module and only one machine learning algorithm that given a prediction accuracy of 67%. Then for
the second module, we added one by one feature to this 6 features selected for the first module and
compared the prediction accuracy with the first modules prediction accuracy, If we get the prediction
accuracy greater than the first module then we keep the feature for the module 2 else we discard the
feature.
CONCLUSION AND FUTURE WORK
In this paper, we selected 17 key features and 6 machine learning models that give the best possible
prediction accuracy. As we can see in the below table all the papers are using a different number of
features and different machine learning algorithms. Also, they are targeting different cricket formats.
Some papers have only discussed features whereas some papers have discussed which machine learning
algorithm will be best. The lowest accuracy is of [3] which is 63.05% and the highest accuracy is of [8]
which is 85%. So we analyzed every paper and found all the key factors that increased prediction
accuracy and algorithms that predicted with the best accuracy. The highest prediction accuracy is 85%
and in our paper, we are getting an accuracy of nearly 90%. By using this model we are going to predict
the outcome of twenty 20 matches, one-day international matches, and test matches also. This model can
be used for predicting the outcome of other sports also like football, hockey, tennis, baseball, rugby, etc.Preprints (www.preprints.org) | NOT PEER-REVIEWED | Posted: 21 October 2020 doi:10.20944/preprints202010.0436.v1
From the study there are numerous elements which impact result of any IPL match is observed. Main
factors that fundamentally impact any IPL match could be their host group, non-home group, arena,
winner of toss and many more. This relatively helped in the calculation of strength. Different ML
techniques were handed down for IPL data set which contributed to this study. The data set consists of all
the IPL matches that were held from the past 6 years that is from 2014 to 2019. The prepared models
were utilized to foresee the result of IPL matches. The T20 cricket has a scope for changeability, because
even few balls can totally change the game. IPL was started 12 years back, there were very less number of
games played compared to 50-50 and test games. Thus, structuring ML for anticipating game result with a
precession of 75% is exceptionally good at this stage.
References
[1] A. L. Samuel, “Some studies in machine learning using the game of checkers. iirecent progress,” in
Computer Games I, pp. 366–400, Springer, 1988.
[2] A. Bandulasiri, “Predicting the winner in one day international cricket,” Journal of Mathematical
Sciences & Mathematics Education, vol. 3, no. 1, pp. 6–17, 2008.
[3] Indian Premier League Official Website [4] P. Langley, W. Iba, K. Thompson, et al., “An analysis of
bayesian classifiers,” in Aaai, vol. 90, pp. 223–228, 1992.
[5] S. Kampakis and W. Thomas, “Using machine learning to predict the outcome of English county
twenty over cricket matches,” arXiv preprint arXiv:1511.05837, 2015.
[6] L. Passfield and J. G. Hopker, “A mine of information: can sports analytics provide wisdom from
your data?,” International journal of sports physiology and performance, vol. 12, no. 7, pp. 851–855,
2017.
[7] T. H. Davenport, “What businesses can learn from sports analytics,” MIT Sloan Man-agement
Review, vol. 55, no. 4, p. 10, 2014.
[8] Muhammad Yasir, LI CHEN, Sabir Ali Shah, Khalid Akbar, M.Umer Sarwar, “Ongoing Match
Prediction in T20 International”, International Journal of Computer Science and Network Security,
Volume: 17 Number: 11 (November 2017)Preprints (www.preprints.org) | NOT PEER-REVIEWED | Posted: 21 October 2020 doi:10.20944/preprints202010.0436.v1
[9] A.N.Wickramasinghe, Roshan D.Yapa, “Cricket Match Outcome Prediction Using Tweets and
Prediction of the Man of the Match using Social Network Analysis: Case Study Using IPL Data”,
International Conference on Advances in ICT for Emerging Regions, ICTer: 442 (2018)
[10] Ayush Kalla, Nihar Karle, Sushant Wagle, Sandeep Utala, “AutoPlay - Cricket Score Predictor”,
International Journal of Engineering Science and Computing, Volume: 8 Issue: 4 (April 2018)
[11] Kaluarachchi, Amal, and S. Varde Aparna. ”CricAI: A classification based tool to predict the
outcome in ODI cricket.” 2010 Fifth International Conference on Information and Automation for
Sustainability. IEEE, 2010
[12] Pedregosa, Fabian, et al. ”Scikit-learn: Machine learning in Python.” Journal of Machine Learning
Research 12.Oct (2011): 2825-2830.
[13] Sankaranarayanan, Vignesh Veppur, Junaed Sattar, and Laks VS Lakshmanan. ”Auto-play: A Data
Mining Approach to ODI Cricket Simulation and Prediction.” SDM. 2014
[14] "Import.io | Extract data from the web," Import.io, [Online]. Available: https://www.import.io.
[15] T. L. Saaty, "A scaling method for priorities in a hierarchichal structure," Mathematical Psychology,
vol. 15, pp. 234-281, 1977.
[16] T. L. Saaty, The Analytic Hierarchy Process, New York: McGraw-Hill, 1980.
[17] N. V. Chavla, K. W. Bowyer, L. O. Hall and W. P. Kegelmeyer, "SMOTE: Synthetic Minority
Oversampling Technique," Artificial Intelligence Research, vol. 16, p. 321–357, June 2002.
[18] J. Han, M. Kamber and J. Pei, Data Mining: Concepts and Techniques, 3rd Edition ed., Waltham:
Elsevier, 2012.
[19] J. R. Quinlan, "Induction of Decision Trees," Machine learning, vol. 1, no. 1, pp. 81-106, 1986.
[20] J. R. Quinlan, C4.5: Programs for Machine Learning, Elsevier, 2015.
[21] L. Breiman, "Random Forests," Machine Learning, vol. 45, no. 1, pp. 5-32, 2001.
[22] T. K. Ho, "The Random Subspace Method for Constructing Decision Forests," IEEE transactions on
pattern analysis and machine intelligence, vol. 20, no. 8, pp. 832-844, August 1998
[23] L. Breiman, J. Friedman, C. J. Stone and R. A. Olshen, Classification and regression trees, CRC
Press, 1984.
[24] B. E. Boser, I. M. Guyon and V. N. Vapnik, "A Training Algorithm for Optimal Margin Classifiers,"
in Fifth Annual Workshop on Computational Learning Theory, Pittsburgh, 1992.
[25] C.-C. Chang and C.-J. Lin, "LIBSVM: A library for support vector machines," ACM Transactions
on Intelligent Systems and Technology, vol. 2, no. 3, April 2011.You can also read


