HEALTHCARE WORKFORCE Office for - The Dentist Workforce in South Carolina
←
→
Page content transcription
If your browser does not render page correctly, please read the page content below
Office for       The Dentist Workforce
HEALTHCARE                 in South Carolina
WORKFORCE
analysis & planning

                                  April 2012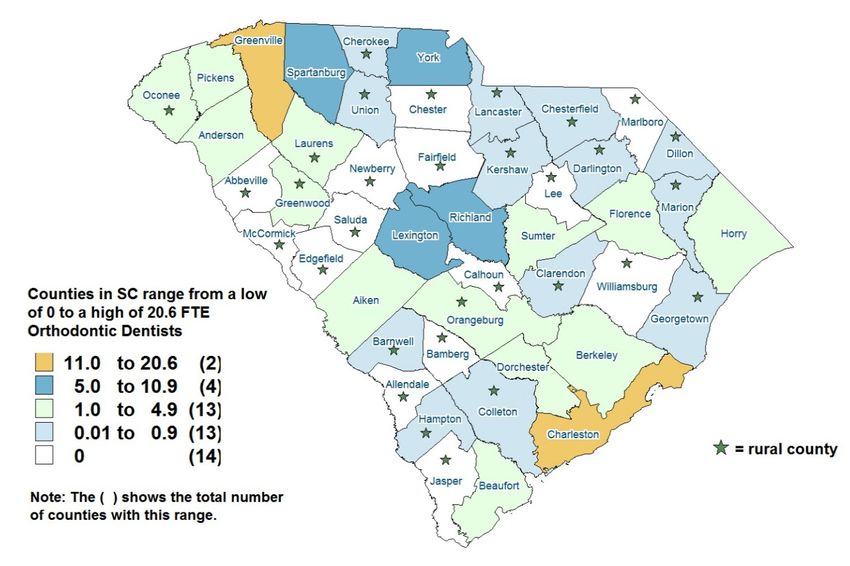
The Office for Healthcare Workforce Analysis and Planning (OHW) is a collaborative partnership of
the South Carolina Area Health Education Consortium (AHEC), the South Carolina Budget and Control
Board Office of Research and Statistics Health and Demographics Section, and the University of South
Carolina College of Nursing Office of Healthcare Workforce Research for Nursing. We are dedicated to
studying supply and demand issues affecting a wide variety of healthcare professions and occupations
in South Carolina. Our primary purpose is the development and analysis of accurate, reliable data on
the supply of healthcare professionals and the demand for health services, in order to support
workforce planning efforts. Those efforts will help to ensure that the citizens of South Carolina will
have the number and types of healthcare providers they will need in the future.

The OHW is housed within the South Carolina AHEC and currently funded through a grant from The
Duke Endowment. The Duke Endowment, located in Charlotte, N.C., seeks to fulfill the legacy of James
B. Duke by improving lives and communities in the Carolinas through higher education, health care,
rural churches and children’s services. Since its inception, the Endowment has awarded $2.8 billion in
grants. The Principal Investigator is David Garr, MD, Executive Director of the South Carolina AHEC.

This report was prepared by: Linda M. Lacey, Director
                             and
                             Melanie Canterberry, Research Associate
                             Office for Healthcare Workforce Analysis and Planning
                             South Carolina Area Health Education Consortium
                             Medical University of South Carolina
                             19 Hagood Ave., Suite 802, Charleston, SC 29425

The full text of this report and others are available online through our website:
www.OfficeforHealthcareWorkforce.org
The Dentist Workforce in South Carolina
Dentists play an increasingly important role in our health care system. The body of evidence linking poor
oral health to a wide range of acute and chronic diseases is growing quickly. Knowing the size and
characteristics of the current Dentist workforce in the state is important baseline information for educators
and policy makers concerned with ensuring an adequate supply of Dentists for South Carolinians. This
report provides information about the number and type of Dentists practicing in the state, their
demographic characteristics, and information about where they practice.

Dentists in South Carolina renew their license to practice every two years through the South Carolina
Department for Labor, Licensing, and Regulation. The majority of information in this report is based on
data gathered during the most recent license renewal period – October through December, 2010 - and
from Dentists applying for an initial license to practice through April 30, 2011. Based on that information,
there were a total of 2,637 Dentists licensed and practicing in the state as of May 1, 2011. Of those, 2,029
were available to the civilian population (see Table 1) and made up the Dentist workforce in the state. That
is an increase of 3.2% over the 2009 dental workforce.

        Table 1. The Dentist Workforce in South Carolina: 2009 - 2011

         Licensed Dentists in South Carolina                                              2009      2011
         # with an active license to practice in SC as of May 1, 2011                     2,554     2,637
         # who are licensed and actively practicing within SC                             1,998     2,068
         Of those who practice in SC:
         # who practice in military facilities AND hold a South Carolina license            32        39
         Total # of Dentists in the South Carolina workforce                              1,966     2,029
         # of Dentists in the workforce and in residency training                           15        8

         Primary specialties within the active Dentist workforce:
                                                        National %   SC 2009    SC 2009   SC 2011   SC 2011
                                                          2009          #          %         #         %
               General Dentistry                          78.8          1,512      76.9   1,563      77.0
               Orthodontics                                5.6          125        6.4     123       6.1
               Oral Surgery                                3.9           96        4.9      94       4.6
               Pediatric Dentistry                         3.3           75        3.8      80       3.9
               Periodontics                                2.8           70        3.6      69       3.4
               Endodontics                                 2.7           49        2.5      55       2.7
               Prosthodontics                              1.8           23        1.2      21       1.0
               Other                                       1.2           16        0.8      18       0.9
               Unknown                                      -            0          0       6        0.03
               Totals                                     100%          1,966   100%      2,029     100%

Office for Healthcare Workforce Analysis and Planning                                                         April 2012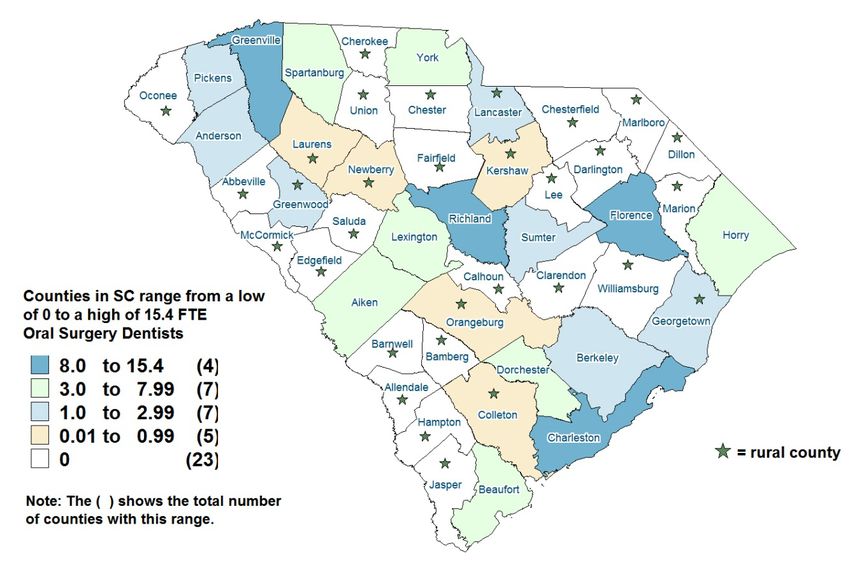
2      The Dentist Workforce in South Carolina

     A small number of Dentists practice in federal or military facilities and provide services only to military
     members and veterans. Because the goal of this report is to provide an overview of the Dentists available
     to treat South Carolinians, we do not include military-based Dentists in the count of the Dentist workforce.
     We do include Dentists who are still engaged in post-graduate training because they are fully licensed and
     available to provide patient care.

     The American Dental Association reports that in 2009 there were 186,084 professionally active Dentists in
     the United States. 1 Based on the 2009 national population, the number of Dentists for each 10,000 people
     in the nation that year was 6.1. In South Carolina the ratio that year was 4.3 Dentists for each 10,000
     persons in the state. In urban areas of the state it was 4.9 and in rural areas it was 2.7. Due to a general
     increase in the state’s population, these ratios did not change much by 2011, despite the increase in the
     total number of Dentists. In 2011 the statewide ratio of Dentists to population was 4.4 per 10,000. In
     urban areas the ratio was 5.0 per 10,000, and in rural areas the ratio remained at 2.7 per 10,000. National
     statistics for 2011 are not yet available for comparison.

     Who are South Carolina's Dentists?

     Gender and Race

     The majority (79.7%) of South Carolina Dentists in the 2011 workforce are male - a level slightly higher
     than the national level of 77.8% male in 2009 – the most recent year national data is available. The racial
     makeup of the Dentist workforce is different from both the national profile, and that of the state's general
     population: the great majority of South Carolina Dentists (91%) are White, 6.1% are Black, 1.3% Asian, 0.3%
     Hispanic, 0.1% American Indian, and 1.3% reported race as “other.” 2 Nationally in 2006, 86.2% of Dentists
     were White, 3.4% Black, 6.9% Asian, 3.4% Hispanic, and 0.1% American Indian. 3 According to the 2010
     Census, 48.6% of the South Carolina population is male and 66.2% of residents are White, 27.9% Black and
     5.1% Hispanic. The two charts in Figure 1 compare the gender and racial makeup of Dentists and the
     general South Carolina population.

    Figure 1. Gender and Racial Diversity in the South Carolina Dentist Workforce and the General Population

     Office for Healthcare Workforce Analysis and Planning                                                     April 2012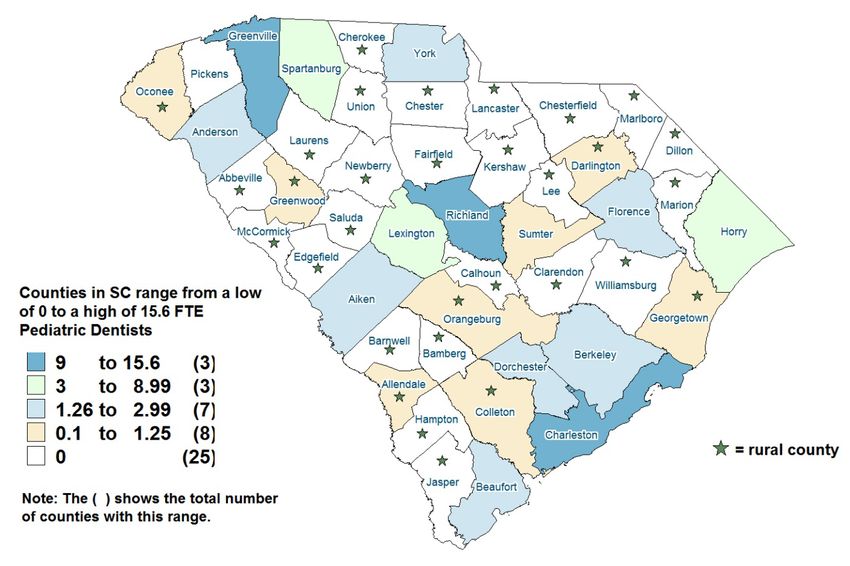
3    The Dentist Workforce in South Carolina

    In addition, while about half of the state’s population is female, only 20% of all Dentists currently practicing
    in the state are women. However, this imbalance between the genders has been changing over the years.
    Among Dentists under the age of 30, 51.5% are women (see Figure 2). If this trend continues, then over
    time the gender gap in the workforce will diminish.

    Age                                                                                                                             439
                                                                          450
                                                                                                                                                  395
                                                                          400                                                                                     Female
    In 2011, the average age of practicing                                350                              333
    Dentists in South Carolina was 49.4,                                                                                                                          Male
                                                     Number of Dentists   300                                          284
    which is almost the same as the
    mean age of Dentists nationally -                                     250
    49.8. A comparison of the age                                         200
                                                                                                     155
    distribution in the Dentist workforce                                 150                                    113                                               107
    between 2009 and 2011 (see Figure
                                                                          100                                                  75
    3) shows that the number of Dentists                                                  53 50
    over the age of 60 has risen in recent                                        50                                                         14
                                                                                                                                                              0
    years and the number of younger                                                0
    Dentists has not increased greatly.                                                    < 30      30 - 39     40 - 49       50 - 59       60 - 69          70 +
    This aging trend may result in a large                                                                               Age
    proportion of Dentists leaving the                                                  Figure 2. Age and Gender Distributions in the SC Dentist Workforce
    workforce within the next decade
    without an adequate number of
    younger Dentists available to replace
                                                                                                                                 535
    them.                                                                         550                                                  514                           2009
                                                                                                       498 489
                                                                                  500
    The aging in the Dentist workforce                                                                                                                               2011
                                                                                  450                                                                   410
                                                             Number of Dentists

    coincides with a similar aging trend in                                                                              397
                                                                                  400                              369                            371
    the general population. Because some
                                                                                  350
    health conditions or treatments which
                                                                                  300
    occur more often in older age groups,
    such as diabetes or chemotherapy, can                                         250
    affect oral health as well, an increase                                       200
    in the number of senior citizens over                                         150                                                                                  107
                                                                                           101 103
                                                                                                                                                                  86
    the next decade may result in                                                 100
    increased demand for dental services                                           50
    at the same time that a sizeable                                                         < 30       30-39       40-49           50-59         60-69            70 +
    number of Dentists will be retiring.
                                                                                                                  Dentist Age Distribution
    The age profile of Dentists also varies
                                                                                   Figure 3. Changes in the Age Distribution of SC Dentists 2009 to 2011
    across the different clinical specialties.

    Office for Healthcare Workforce Analysis and Planning                                                                                                     April 2012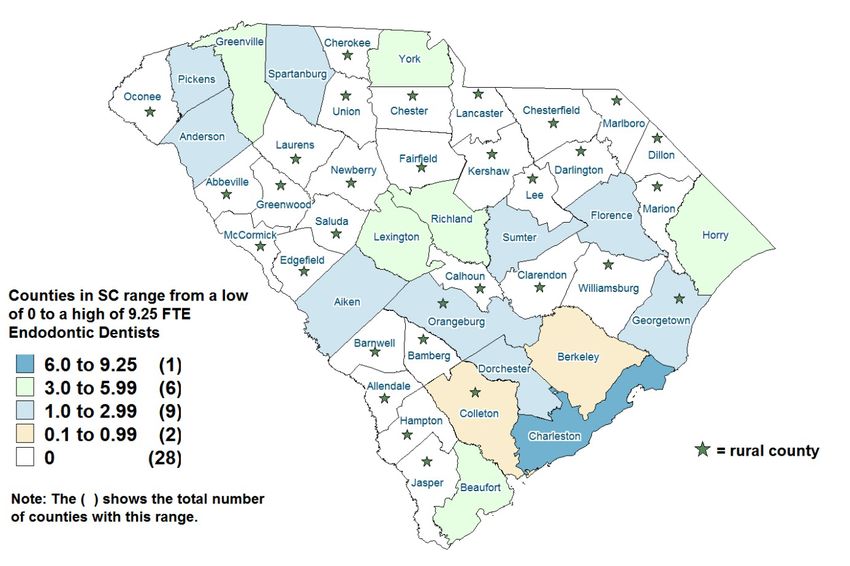
4    The Dentist Workforce in South Carolina

    Figure 4 shows the percent of Dentists in each age group by practice specialty. The largest age group
    among periodontists is age 60 and over which could signal an impending shortage in that field due to
    significant retirement losses in the next decade.

                              50
                              45
                              40
                                                                                                                                   Under 40
       Percent in Age Group

                              35
                              30                                                                                                   40 to 49
                              25
                                                                                                                                   50 to 59
                              20
                              15
                                                                                                                                   60 plus
                              10
                               5
                                     Endo-        General        Ortho-         Oral        Pediatric      Perio-    Prostho-
                                    dontists      Dentists      dontists      Surgeons      Dentists      dontists    dontics

                               Figure 4. Percentage of Dentists by Age Group and Clinical Specialty

    The effect of an aging workforce may have greater impact in rural areas of the state, as Dentists age 60 and
    older make up 24.1% of the workforce in urban areas of the state, but 33.5% in rural areas. Table 2
    illustrates the intersection of age, clinical specialty and geographic location in the Dentist workforce. The
    number of Dentists who have their primary practice located in rural counties is much smaller in general,
    and for most of the specialties the proportion of Dentists age 60 or over is larger in rural areas as a result.

    Table 2. Dentists by primary specialty, age and rural/urban practice location in South Carolina in 2011.

    Specialty                                                    Rural Counties                               Urban Counties

                                                      Total        # age 60        % age 60           Total     # age 60    % age 60
                                                        #         and older        and older            #      and older    and older
    Endodontists                                        3              1            33.3%              52           9        17.3%
    General Dentists                                   288            97            33.7%             1,257       299        23.8%
    Orthodontists                                       9              3            33.3%              114         25        21.9%
    Oral Surgeons                                       5              3            60.0%              89          24        27.0%
    Pediatric Dentists                                  6              0             0.0%              74          18        24.3%
    Periodontists                                       6              2            33.3%              63          24        38.1%
    Prosthodontics                                      5              2            40.0%              16           3        18.8%
    Total Workforce                                    322           108            33.5%             1,665       402        24.1%

    Office for Healthcare Workforce Analysis and Planning                                                                           April 2012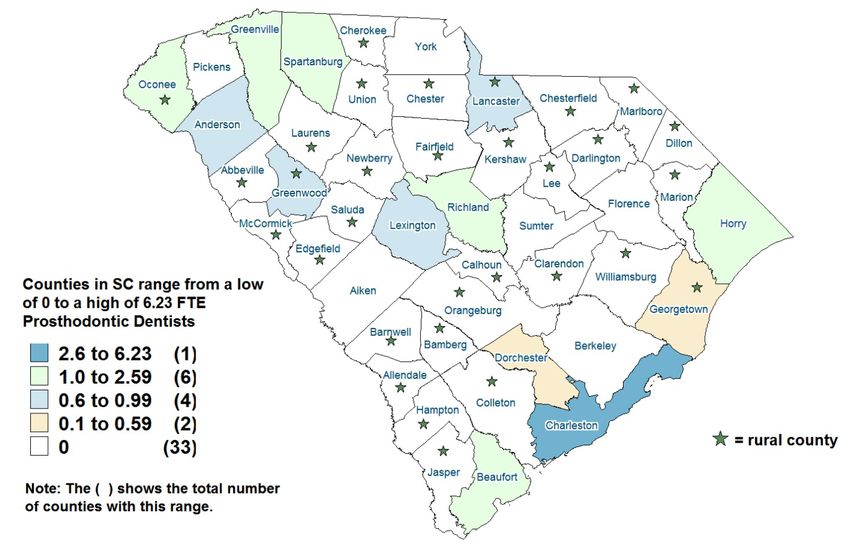
5    The Dentist Workforce in South Carolina

    Education

    As of 2011, most of the active Dentists in South Carolina (n=1,161, 59.1%) were graduates of the state's
    only dental program—the James B. Edwards College of Dental Medicine at the Medical University of South
    Carolina (MUSC). The remainder of Dentists in the state graduated from dental schools outside of South
    Carolina, with the largest contributing states including Georgia (n=122, 6.2%), Virginia and the District of
    Columbia (each with n=73, 3.7%), Kentucky (n=69, 3.5%), and Pennsylvania (n=55, 2.8%). 4

    The dental school at MUSC is a critical resource for South Carolina, and entry into the program is
    competitive. The American Dental Association released a series of reports in April 2011 containing
    information from their annual survey of dental education programs across the country. These reports
    contain information, most recently, about the 2009-10 academic year. 5 For the 2009-10 application cycle,
    MUSC received a total of 792 applications to its dental program for approximately 55 available seats (the
    following year the class size was increased to 70). The applicants were almost equally divided among men
    (395) and women (397). The reported race/ethnicity of the total applicant pool was 64.5% White, 14.4%
    Asian, 6.9% Black, 4.3% Hispanic, less than 1% American Indian, and 9.1% where race was unspecified. Of
    those 792 applicants, 121 were evaluated and considered for admission by the school's admissions
    committee. At the end of the application cycle, 58 students accepted admission into the program, 52 of
    whom were South Carolina residents. The ADA reports that only 8 students from South Carolina enrolled in
    a dental program that year outside of South Carolina. Table 3 summarized the gender and racial
    characteristics of the 2009-10 applicant pool and enrollees.

    Table 3. Gender and Race Percentages in the 2009-10 Academic Year Dental School Applicant Pool : SC and the US

                           Dental                                                                 Under-      Race
                           School                                                   Non-        represented   Not
     2009-2010            Location            Male          Female    White         White         Minority  Specified
     Applicants
                              SC             49.9%          50.1%     64.5%         26.4%           12.0%            9.1%
                              US             55.1%          44.9%     48.0%         42.2%           9.6%             9.7%
     Offered Admission
                              SC             57.9%          42.1%     88.4%         9.1%            5.0%             2.5%
                              US             55.6%          44.4%     48.2%         42.4%           9.4%             9.4%
     Enrolled
                              SC             50.0%          50.0%     87.9%         10.3%           6.9%             1.7%
                              US             54.3%          45.7%     58.5%         37.2%           12.7%            4.3%
    Note: Non-White includes those reporting their race as Black, Hispanic, American Indian, or Asian. The figures in the
    column “Under-represented Minority” group includes Blacks, Hispanics and American Indians. Asians are not
    proportionately underrepresented in the healthcare workforce.

    Office for Healthcare Workforce Analysis and Planning                                                              April 2012
6    The Dentist Workforce in South Carolina

    The ADA also reports statistics for all students enrolled in dental programs the 2009-10 academic year. The
    next two figures show percentages of all enrolled dental students for the 2009-10 academic year in South
    Carolina and the United States, plus two neighboring states: North Carolina and Georgia. Figure 5 displays
    the percentages of males and females enrolled in dental programs in each state and nationally.

                           75%

                           65%           41.0%                                  41.9%
                                                                                                   45.2%
                           55%                                49.4%

                           45%
                                         59.0%                                  58.1%              54.8%
                                                              50.6%
                           35%

                           25%
                                          SC                   NC                  GA               US

                                                                Male      Female
                             Figure 5. Gender distribution among enrolled dental school students by state in 2009-10.

    Figure 6 shows the race/ethnic background of all dental students enrolled during the 2009-10 academic
    year for the three states and nationally. Whites and Asians are grouped together in this figure because,
    while Asians are a minority in general population, they are not proportionately under-represented in the
    dental workforce.

            100%
                              3.5%         0.4%                                 4.7%                     4.2%
                                                       6.9%                                 0.4%
             95%                           0.9%                                                                     0.6%
                              3.1%                                     0.9%     4.3%                     6.3%
             90%                                       3.4%
             85%                                                                8.5%                     5.7%
                                                       11.0%
             80%
             75%
             70%              92.1%
                                                                                82.2%                    83.1%
             65%                                       77.7%
             60%
             55%
             50%
                                 SC                     NC                         GA                      US

                           White/Asian         Black        Hispanic      American Indian      Not Specified

                   Figure 6. Race and ethnicity distribution among enrolled dental school students by state in 2009-10.

    Office for Healthcare Workforce Analysis and Planning                                                                  April 2012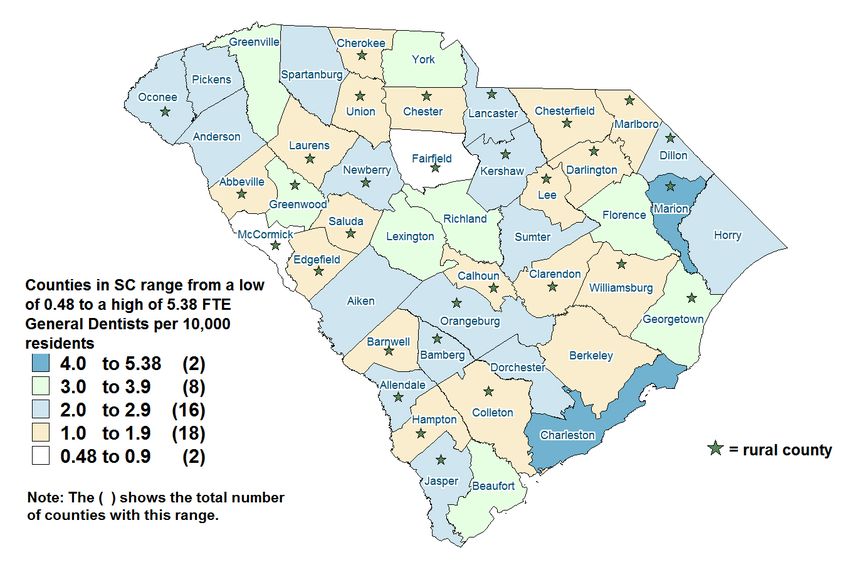
7    The Dentist Workforce in South Carolina

    Research has shown that many patients prefer to seek care from providers who share their racial or ethnic
    background, and that minority providers are more likely to practice in underserved areas. 6 The relative lack
    of minority Dentists in our current workforce may be a contributing factor to low use of preventive dental
    services and reduced access to care experienced within some minority communities. To address the lack of
    minority Dentists in the state, the South Carolina Dental Association has outlined several ways in which
    they support efforts to increase the racial and ethnic diversity of the dental workforce. 7 The Medical
    University of South Carolina established a Diversity Task Force in 2008 to address the challenges of minority
    recruitment. 8 In addition, The George C. McTeer Scholarship Fund has been endowed at MUSC to support
    minority student recruitment, but is not yet fully funded, and thus will not be available to support in-
    coming students for several more years. 9

    What are the work characteristics of South Carolina's Dentists?

    Hours Worked per Week

    The total number of hours worked per week by practicing Dentists in South Carolina is, on average, 36.5
    hours, based on information provided by Dentists during the license renewal process. The average number
    of hours per week did not vary by gender: males worked an average of 36.5 hours per week and women an
    average of 36.4 hours per week. The ADA reports that in 2009, 85.8% of all Dentists in the nation worked a
    full-time schedule (30 hours or more) and 14.3% worked a part-time schedule (less than 30 hours). Dentists
    practicing in South Carolina in 2011 tended to work a bit more: 88.5% reported working full-time, and
    11.5% part-time. Figure 7 shows the distribution of weekly work hours in the South Carolina Dentist
    workforce.

                                      45%                                            41.3%             39.8%
                                      40%
                                      35%
                Percent of Dentists

                                      30%
                                      25%
                                      20%
                                      15%
                                      10%        6.5%                                                                       7.5%
                                                                   5.0%
                                       5%
                                       0%
                                                  < 20            20 to 29          30 to 39          40 to 49             50 plus
                                                                             Hours Worked per Week
                                       Figure 7. Distribution of Weekly Work Hours Among South Carolina Dentists in 2011

    Office for Healthcare Workforce Analysis and Planning                                                                            April 2012
8 The Dentist Workforce in South Carolina
The figure to the right (Figure
8) shows how Dentists’ work
patterns differ based on the 60%
Rural Urban
rural or urban location of 49.0%
50% 43.5%
their primary practice setting.
Percent of Dentists
39.5%
Overall, there is little 40% 33.3%
difference: a slightly larger 30%
proportion of Dentists located
20%
in rural areas work fewer than
40 hours in a normal week 10% 6.6% 6.2% 7.3%
5.0% 3.8% 5.8%
(62.9%), compared to those
0%
who practice in urban areas < 20 20 to 29 30 to 39 40 to 49 50 plus
(54.7%). The average number Hours Worked per Week
of weekly work hours for rural
Figure 8. Distribution of Weekly Work Hours by the Primary Practice Location of
Dentists is 35.5, while for Dentists in Rural or Urban Areas.
urban Dentists it is 36.7. The
great majority of a Dentist’s work week is spent in direct patient care activities regardless of practice
location: 32.1 hours for rural Dentists and 31.9 hours for urban Dentists, on average.
The number of hours worked in a typical week varies more by age. The average length of the work week is
similar for Dentists up to age 50 when it begins to shorten slightly (see Table 4). After age 60 there is a
significant decrease in the average length of the work week. When this relationship between age and work
hours was examined in a multivariate regression with other characteristics of the Dentist such as gender,
specialty (General Dentists compared to Dentists in all other specialties), or the rural/urban nature of the
practice setting, age was the dominant predictor of work hours. Whether this reduction of hours at later
ages is voluntary or the result of a reduction in patient panel size is unknown.
Table 4. Average Work Hours by Dentist Age in 2011
Average Hours This information about how work patterns
Age # of Dentists per Week change with age is important because, as
< 30 103 38.59 noted earlier, the number of Dentists over the
age of 60 has increased over recent years, and
30-39 489 38.38 approximately one-third of Dentists in rural
40-49 397 38.82 areas of the state are currently age 60 or
older. Assuming that work hours are reduced
50-59 514 37.46
voluntarily, this means that even if older
60-69 410 33.14 Dentists remain in practice, we need to take
70 + 107 24.87 changes in work habits into account when
estimating the effective size of the Dentist
All Ages 2,020 36.5 workforce in an area of the state and how that
might change over time as the Dentist
workforce ages.
Note: Nine Dentists did not report either age or work hours.
Office for Healthcare Workforce Analysis and Planning April 20129 The Dentist Workforce in South Carolina
Work patterns also vary by practice specialty. Figure 9 makes clear that the majority of Dentists in each of
the clinical specialty groups work between 30 and 49 hours in a typical week. However, some groups have
larger or smaller percentages in the lowest or highest hours categories. It may be easier to compare the
groups by looking at the average number of hours reported in a week: Endodonists – 38.7 hours; General
Dentists – 35.9 hours; Orthodontists – 36.0 hours; Oral Surgeons – 44.0 hours; Pediatric Dentists – 38.9
hours; Periodontists – 36.7 hours; Prosthodontists – 38.0 hours.
60
Under 30 Hrs
50
Percent Working Hours Weekly
30 to 39
40
40 to 49
30
50 Hrs plus
20
10
0
Endo- General Ortho- Oral Pediatric Perio- Prostho-
dontists Dentists dontists Surgeons Dentists dontists dontists
Figure 9. Distribution of Weekly Work Hours by Specialty among South Carolina Dentists in 2011
Work Settings
As part of the licensing process, each Dentist reports information about their practice, such as the type of
setting in which they work, whether they work in more than one setting, and the type of employment
arrangement they work under.
The great majority of Dentists in South Carolina (94.1%, n=1,909) work in a private dental office. Of those
that do, most (53.7%) are solo practitioners who are self-employed. About one-third (32.9%) are self-
employed within a group practice, and the remainder (13.4%) are employed by either a group practice or
another individual practitioner.
Office for Healthcare Workforce Analysis and Planning April 201210 The Dentist Workforce in South Carolina
The relatively small number of
Dentists who do not practice in private
offices (n=120, 5.9% of the total) are
spread across a variety of settings: see
Figure 10. The largest proportion
2.2% 0.1%
(47.5% of the 120 or 2.8% of the total) 94.1%
0.2% 0.4%
are practicing in a university setting. A 5.9%
0.1%
few are affiliated with junior or
technical colleges (3.3% of 120 or 0.2% 2.8%
of the total). Slightly more than one-
third (37.5% of the 120 or 2.2% of the Private Office
University or College of Medicine
total) practice in community health Junior or Technical Colleges
centers or other types of free-standing community health center or freestanding clinic
clinics. The remainder (11.7% of 120 hospitals
nursing home
or 0.6% of the total) are practicing in
school or treatment center
hospitals, nursing homes, schools, or
other types of institutional settings. Figure 10. Types of Practice Settings Among Active Dentists in South Carolina, 2011
Of the 2,029 Dentists who were actively practicing in South Carolina in 2011, a total of 336 (16.6%) reported
practicing in more than one location. Most of them reported having only a second additional location
beyond their primary practice site, but 61 Dentists reported having 3 or more practice locations. The
number of hours spent in secondary practice locations each week totals to 4,297 hours across the 336
Dentists who reported having a secondary practice location in 2011. The majority (62.2%) of the Dentists
reporting more than one practice location were working in more than one county. A slightly larger
proportion (21%) of younger Dentists (those who graduated after 1992) reported working in multiple
locations compared to their older colleagues (13%).
Full-Time Equivalents in the Dentist Workforce
The fact that the work patterns of Dentists in South Carolina differ by age, clinical specialty, and the rural or
urban location of their primary practice means that simply knowing how many Dentists we have in an area
or practicing in a clinical specialty is not sufficient information for understanding the true size of the
available workforce. One way to do that, and the most common approach in workforce analysis, is to
standardize the count of Dentists by assigning each a measure of full-time equivalency (FTE), based on the
number of hours they work in a typical week. Forty hours per week is the most commonly reported value
(mode value) among South Carolina Dentists, so we are using that as the basis of an FTE measure. A Dentist
reporting a typical work week of 20 hours is assigned an FTE value of 0.5, while one reporting 40 hours per
week is assigned a value of 1.0 FTE. Someone reporting a 60 hour week equates to 1.5 FTEs. Table 6
displays the number of Dentists in South Carolina by their clinical specialties in 2009 and 2011. The table
shows both the total number of Dentists (head count) and the number of full-time equivalents (FTEs) in
each area of dental practice.
Office for Healthcare Workforce Analysis and Planning April 201211 The Dentist Workforce in South Carolina
Table 5. Number of Active Dentists and FTEs in the Workforce in South Carolina by Specialty: 2009 and 2011
Number of Dentist
Active Dentists FTEs
Active Dentists by
Primary Specialty 2009 2011 2009 2011
General Dentistry 1,512 1,563 1364.6 1401.5
Orthodontics 125 123 115.2 110.6
Oral Surgery 96 94 109.4 103.3
Pediatric Dentistry 75 80 70.7 77.7
Periodontics 70 69 62.9 63.3
Endodontics 49 55 48.8 53.2
Prosthodontics 23 21 21.5 19.9
Other 16 18 14.5 15.2
Unknown 0 6 0 6
Totals: 1,966 2,029 1,807.6 1,850.7
In order to gain a more detailed understanding of the workforce in different areas of the state, we
calculated the total number of FTE Dentists in each county, combining time spent in both primary and
secondary practice locations, and standardized it by population size within the region. The results are
displayed in Figure 11.
Rural Areas
Urban Areas
Dental Central
Rurality, SCDA & DHEC Regions
Dental Coastal
Dental Pee Dee
Dental Piedmont
DHEC Region 1
DHEC Region 2
DHEC Region 3
DHEC Region 4
DHEC Region 5
DHEC Region 6
DHEC Region 7
DHEC Region 8
2.0 2.5 3.0 3.5 4.0 4.5 5.0 5.5 6.0
Figure 11. Dentist FTEs per 10,000 persons available within different regions of South Carolina in 2011
Office for Healthcare Workforce Analysis and Planning April 201212 The Dentist Workforce in South Carolina
Table 6. Number of Dentist FTEs practicing in each county in 2011 by specialty and total density per 10,000 population
Endo- General Ortho- Oral Pedia- Perio- Prostho- Total FTEs Per
Count Other
dontics Dentistry dontics Surgery trics dontics dontics FTEs 10,000
Abbeville 0 3.7 0 0 0 0 0 0 3.7 1.45
Aiken 2.3 46.5 4.0 4.4 2.4 1.3 0 0 60.9 3.80
Allendale 0 2.5 0 0 0.8 0 0 0 3.3 3.19
Anderson 2.4 53.0 4.5 2.5 2.0 1.6 0.9 0 66.8 3.57
Bamberg 0 3.6 0 0 0 0 0 0 3.6 2.24
Barnwell 0 4.0 0.4 0 0 0 0 0 4.3 1.91
Beaufort 4.9 63.5 4.2 5.1 2.4 3.2 1.8 0 84.9 5.23
Berkeley 0.3 31.8 1.9 1.2 2.7 0.2 0 0 38.0 2.14
Calhoun 0 2.6 0 0 0 0 0 0 2.6 1.71
Charleston 9.3 188.5 20.6 15.4 15.6 15.6 6.2 3.9 275.1 7.85
Cherokee 0 8.9 0.4 0 0 0 0 0 9.3 1.68
Chester 0 4.8 0 0 0 0 0 0 4.8 1.43
Chesterfield 0 7.1 0.1 0 0 1.0 0 0 8.2 1.74
Clarendon 0 5.6 0.2 0 0 0 0 0 5.8 1.67
Colleton 0.1 6.9 0.6 0.4 0.2 0 0 0 8.2 2.10
Darlington 0 11.1 0.6 0 1.0 0 0 0.2 12.8 1.87
Dillon 0 6.9 0.03 0 0 0 0 0 6.9 2.15
Dorchester 2.0 39.0 3.9 4.9 2.3 2.9 0.3 1.0 56.2 4.12
Edgefield 0 4.8 0 0 0 0 0 0 4.8 1.79
Fairfield 0 2.2 0 0 0 0 0 0 2.2 0.92
Florence 1.9 48.0 3.2 8.1 2.0 1.3 0 1.8 66.3 4.84
Georgetown 1.3 22.9 0.7 1.9 1.0 1.0 0.3 0 29.0 4.81
Greenville 5.8 166.3 17.5 13.8 13.5 7.7 2.5 3.0 230.0 5.10
Greenwood 0.2 20.9 2.3 2.7 1.0 2.0 0.8 0 29.9 4.29
Hampton 0 3.3 0.1 0 0 0 0 0 3.4 1.61
Horry 3.6 72.0 4.0 6.7 3.2 3.3 1.3 0 94.1 3.49
Jasper 0 5.0 0 0 0 0 0 1.0 6.0 2.43
Kershaw 0 16.0 0.5 0.1 0 0.5 0 0 17.0 2.76
Lancaster 0 18.5 0.8 1.4 0 0 0.8 0 21.5 2.80
Laurens 0 12.6 1.1 0.1 0 0 0 0 13.7 2.06
Lee 0 2.7 0 0 0 0 0 0 2.7 1.42
Lexington 3.9 82.6 6.0 5.5 7.9 3.0 1.0 0 111.8 4.26
Marion 0 5.5 0.1 0 0 0 0 0 5.6 1.69
Marlboro 0 5.6 0 0 0 0 0 0 5.6 1.94
McCormick 0 1.4 0 0 0 0 0 0 1.4 1.34
Newberry 0 8.7 0 0.6 0 0 0 0 9.3 2.47
Oconee 0 21.3 1.8 0 1.3 0 2.1 0 26.5 3.57
Orangeburg 1.1 19.8 1.7 0.7 1.0 1.3 0 0 25.5 2.75
Pickens 1.9 28.0 2.8 2.6 0 1.8 0 0 37.2 3.12
Richland 4.7 148.2 10.0 11.2 9.0 7.0 1.0 0.4 191.5 4.98
Saluda 0 3.4 0 0 0 0 0 0 3.4 1.71
Spartanburg 2.7 80.7 6.5 5.4 5.3 3.4 1.1 1.0 106.0 3.73
Sumter 1.1 27.0 1.7 2.5 1.0 1.3 0 0 34.6 3.22
Union 0 5.1 0.2 0 0 0 0 0 5.2 1.80
Williamsburg 0 5.9 0 0 0 0 0 0 5.9 1.71
York 3.8 73.6 8.6 6.3 2.2 4.1 0 1.1 99.7 4.41
Office for Healthcare Workforce Analysis and Planning April 201213 The Dentist Workforce in South Carolina
Looking at the distribution of Dentists across different counties also can shed light on how well our Dentist
workforce is distributed in South Carolina. Table 6 on the previous page reports the number of Dentist FTEs
by specialty who have a primary or secondary practice within each county, and the total number of Dentist
FTEs per 10,000 residents in that county. The figures in the table illustrate how the size of the dental
workforce varies across the state, and how that workforce is distributed across the various specialty areas
of care. The final column in Table 6 standardizes the size of the entire Dentist workforce in a county
relative to the size of the population in that county. Looking at the workforce in this way provides a means
of identifying those areas of the state with an unusually high or low supply of Dentists. (Note: The
information in Table 6 has been translated into geographic maps which can be found in Appendix A. )
There is no standard definition of how many Dentists constitute an adequate supply. However, the South
Carolina Dental Association position paper on Oral Health, published in April, 2011, reports that a ratio of
one Dentist to every 5,000 persons may be adequate, given the efficiency of the modern dental office. 10
The figures in Table 6 illustrate that most of our counties have at least two Dentist FTEs available for each
10,000 persons. However, 18 counties had fewer than 2.0 Dentist FTEs in 2011. When this analysis is
restricted to the supply of general dentistis (see Map 8 in the Appendix A), a total of 20 counties in the
state have fewer than 2 general Dentist FTEs for each 10,000 county residents.
The Rural / Urban Distribution of the Dentist Workforce
The results displayed in Figure 11, Table 6 and the maps in Appendix A make clear two points: General
Dentists can be found in every county in the state, although they tend to be concentrated in urban areas;
and Dentists that have pursued a specialty focus almost all practice in the urban areas of the state. Table 7
summarizes the number and percentage of Dentist FTEs by their practice locations (rural or urban counties)
and by specialty area.
Table 7. The FTE Dentist workforce in rural and urban areas of the state in 2011 by specialty
Dentist Specialty FTEs in Rural Counties FTEs in Urban Counties
# % # %
General Dentists 253.0 18.0 1148.5 82.0
Endodontists 2.9 5.4 50.3 94.6
Orthodontists 11.4 10.3 99.3 89.7
Oral Surgeons 7.7 7.5 95.6 92.5
Pediatric Dentists 6.3 8.0 71.5 92.0
Periodontists 5.8 9.1 57.6 90.9
Prosthodontists 4.0 19.9 16.0 80.1
Note: Dentists whose specialty areas fall outside of those named in the table have been omitted from this analysis.
Office for Healthcare Workforce Analysis and Planning April 201214 The Dentist Workforce in South Carolina
The uneven distribution of Dentists in the state means that access to dental care is more difficult in rural
areas. Recent research has demonstrated that among very young children (under age 4) who are Medicaid
beneficiaries, those that reside in rural areas of the state have significantly poorer access to dental services,
as measured by having a dental home and by utilization of preventive care. 11 It is important to note that
the authors concluded that simply increasing the size of the dental workforce in rural areas would not, in
itself, be a sufficient solution for improving dental outcomes for young children in those areas, since
additional factors such as patient race and special health needs also influenced the results. But the
problem of a limited Dentist workforce in the rural areas of our state is one that has been acknowledged
and addressed through a number of programs directed toward children over the past decade.
Beginning in 1999, the South Carolina Department of Education was able to develop a comprehensive
system of oral health services for school-aged children in the state, made possible by funding from the
Centers for Disease Control and Prevention. This was followed by the creation of the Division of Oral Health
in the state Department of Health and Environmental Control (DHEC) in 2000. That office has been
instrumental in developing public-private partnerships between the state’s dental associations, dental
training programs, and child advocacy organizations which have resulted in a significant improvement in
the dental health of children across the state 12, so much so that these partnership programs have been
recognized as models for other states to follow. 13 In addition, a recent grant from the Oral Health 2014
Initiative of the DentaQuest Foundation will establish a statewide dental screening initiative that will
enhance our ability to provide oral health services to underserved children. 14
While the success of these programs is to be celebrated, the maldistribution of Dentists still presents
problems for adults in the rural areas or our state.
Conclusions
The Dentist workforce in South Carolina faces several challenges: lack of racial and ethnic diversity; the
likelihood that a significant portion of the workforce will retire in the next decade; and finding ways to
provide access to dental services in rural communities where Dentists are scarce.
The diversity of South Carolina’s population is not reflected in our current Dentist workforce, either in
terms of gender or race. Much progress has been made in recent years to increase the number of female
Dentists graduating from our single College of Dental Medicine within the Medical University of South
Carolina. In the 2009-10 academic year fully 50% of the first year enrollees were women. But less progress
has been made in increasing the racial diversity among dental school graduates. Because such a large share
of our active workforce is produced by our state dental school, it is important that our education programs
strive to increase the racial diversity of the profession in a way that reflects our citizens
One quarter (25.5%) of the Dentists currently practicing in the state are age 60 or older. In addition,
Dentists in that age group tend to work fewer hours per week than their younger colleagues. It is
Office for Healthcare Workforce Analysis and Planning April 201215 The Dentist Workforce in South Carolina
reasonable to assume that a significant number of them will choose to retire from practice altogether in the
coming decade. Whether or not this will result in a shortage of Dentists is unclear, and will largely depend
on the productivity of our College of Dental Medicine, the number of Dentists moving in from out of state,
the deployment of assistive personnel such as dental hygienists and dental assistants, and changes in
technology which affect efficiency in the delivery of oral health care. Some clinical specialties may be more
affected than others by the aging of the workforce: periodontists and oral surgeons are the clinical
specialties in which more than 25% of active practitioners are currently age 60 or older. It also anticipated
that the aging of the Dentist workforce will have a greater impact in rural counties where Dentists over the
age of 60 make up a larger proportion of the workforce compared to urban areas.
Not only are more Dentists approaching retirement age in our rural counties, but there are fewer of them
in those areas to begin with. People living in the urban areas of our state have much greater access to all
types of dental care. Rural areas are especially affected by the low number of specialist Dentists practicing
in rural counties. Solutions to that problem are beyond the scope of this report, but it is hoped that having
the detailed description of the Dentist workforce presented here will help to inform policy makers in our
state as they seek solutions.
Office for Healthcare Workforce Analysis and Planning April 201216 The Dentist Workforce in South Carolina
End Notes
1
Distribution of Dentists in the United States by Region and State, 2009. A report by the American Dental Association,
April 2011.
2
Note that about 5% of SC Dentists did not report race in 2011. The percentages reported here are based on all those
that did report race information.
3
American Dental Association, 2008, as cited in “Current Demographics and Future Trends of the Dentist Workforce”
a presentation to the Institute of Medicine workshop: The U.S. Oral Health Workforce in the Coming Decade.
February 9, 2009 by Richard W. Valachovic, D.M.D., M.P.H. Accessed online April 4, 2012 at:
http://www.iom.edu/~/media/Files/Activity%20Files/Workforce/oralhealthworkforce/2009-Feb-09/1%20-
%20Valachovic.ashx
4
The dental school location was unknown for 66 of the active Dentists in 2011.
5
The American Dental Association (ADA) administers a survey to accredited dental programs each year as part of the
accreditation process. The applicant and admissions data reported here are from the 2009-10 Survey of Dental
Education released in 2011.
6
Missing Persons: Minorities in the Health Professions. A Report by the Sullivan Commission on Diversity in the
Healthcare Workforce. 2004. This report can be downloaded from: http://health-equity.pitt.edu/40/
7
South Carolina Dental Association’s Position Paper on Oral Health, April 28, 2011. Downloaded from the SCDA
website: http://scda.org/associations/5602/files/SCDA_Position_Paper%20FINAL%20for%20HOD%204-28-11.doc
8
Ibid.
9
Personal communication with the MUSC Office of Diversity, April 28, 2012.
10
South Carolina Dental Association’s Position Paper on Oral Health, April 28, 2011. Downloaded from the SCDA
website: http://scda.org/associations/5602/files/SCDA_Position_Paper%20FINAL%20for%20HOD%204-28-11.doc
11
Martin, AB; Vyavaharkar, M; Veschusio, C; Kirby, H. (2010). Rural–Urban Differences in Dental Service Utilization
Among an Early Childhood Population Enrolled in South Carolina Medicaid. Maternal and Child Health Journal, Online
First.
12
University of South Carolina Arnold School of Public Health newsletter, March 1, 2012. “HSPM doctoral student
among speakers in D.C. to discuss improving oral, dental health for nation’s children.” Downloaded from:
http://sph.sc.edu/news/dentalhealth.htm
13
Report from the Center for Health Care Strategies and the Robert Wood Johnson Foundation. Catalyzing
Improvements in Oral Health Care: Best Practices from the State Action for Oral Health Access Initiative by Carolyn
Ballard and Nikki Highsmith. August 2006.
14
University of South Carolina Arnold School of Public Health newsletter, March 1, 2012. “HSPM doctoral student
among speakers in D.C. to discuss improving oral, dental health for nation’s children.” Downloaded from:
http://sph.sc.edu/news/dentalhealth.htm
Office for Healthcare Workforce Analysis and Planning April 2012Appendix A Office for Healthcare Workforce Analysis and Planning April 2012
1 The Dentist Workforce in South Carolina Appendix A
Appendix A
Maps Showing the Size of the Dentist Workforce by Specialty
and County Location
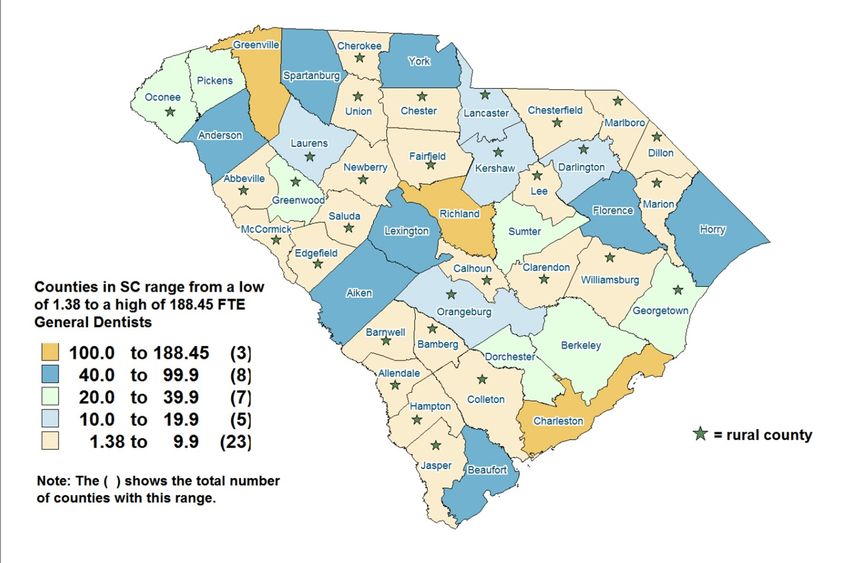
These maps are based on information provided by Dentists during the license renewal process about the
number of hours they work in a typical week and in what locations. We have summed the total hours
worked by Dentists within a specific specialty and within a specific county, and divided that total by 40 to
arrive at an estimate of the total number of full time equivalent Dentists in that specialty in that county. An
FTE estimate of the workforce is a more accurate estimate than a head count, since many dentists work
fewer than 40 hours a week within a single practice location. Among Dentists who reported having a
secondary practice location this is especially true.
Counties marked as rural in these maps are counties in which the population density was 155 persons or
fewer per square mile in 2009.
Map 1. General Dentist Full Time Equivalent (FTE) Workforce Distribution in South Carolina
Office for Healthcare Workforce Analysis and Planning April 20122 The Dentist Workforce in South Carolina Appendix A
Map 2. Oral Surgeon Full Time Equivalent (FTE) Workforce Distribution in South Carolina
Map 3. Endodontic Dentist Full Time Equivalent (FTE) Workforce Distribution in South Carolina
Office for Healthcare Workforce Analysis and Planning April 20123 The Dentist Workforce in South Carolina Appendix A
Map 4. Orthodontic Dentist Full Time Equivalent (FTE) Workforce Distribution in South Carolina
Map 5. Pediatric Dentist Full Time Equivalent (FTE) Workforce Distribution in South Carolina
Office for Healthcare Workforce Analysis and Planning April 20124 The Dentist Workforce in South Carolina Appendix A
Map 6. Periodontic Dentist Full Time Equivalent (FTE) Workforce Distribution in South Carolina
Map 7. Prosthodontic Dentist Full Time Equivalent (FTE) Workforce Distribution in South Carolina
Office for Healthcare Workforce Analysis and Planning April 20125 The Dentist Workforce in South Carolina Appendix A
Map 8. General Dentist Full Time Equivalent (FTE) Workforce per County Adjusted for
County Population Size: Number per 10,000 County Residents
Office for Healthcare Workforce Analysis and Planning April 2012Appendix B Office for Healthcare Workforce Analysis and Planning April 2012
1    The Dentist Workforce in South Carolina                                                        Appendix B

                                                            Appendix B

                                  Definitions of Recognized Dental Specialties
    Dental Public Health: Dental public health is the science and art of preventing and controlling dental
    diseases and promoting dental health through organized community efforts. It is that form of dental practice
    which serves the community as a patient rather than the individual. It is concerned with the dental health
    education of the public, with applied dental research, and with the administration of group dental care
    programs as well as the prevention and control of dental diseases on a community basis.

    Endodontics: Endodontics is the branch of dentistry which is concerned with the morphology, physiology
    and pathology of the human dental pulp and periradicular tissues. Its study and practice encompass the basic
    and clinical sciences including biology of the normal pulp, the etiology, diagnosis, prevention and treatment
    of diseases and injuries of the pulp and associated periradicular conditions.

    Oral and Maxillofacial Pathology: Oral pathology is the specialty of dentistry and discipline of pathology
    that deals with the nature, identification, and management of diseases affecting the oral and maxillofacial
    regions. It is a science that investigates the causes, processes, and effects of these diseases. The practice of
    oral pathology includes research and diagnosis of diseases using clinical, radiographic, microscopic,
    biochemical, or other examinations.

    Oral and Maxillofacial Radiology: Oral and maxillofacial radiology is the specialty of dentistry and
    discipline of radiology concerned with the production and interpretation of images and data produced by all
    modalities of radiant energy that are used for the diagnosis and management of diseases, disorders and
    conditions of the oral and maxillofacial region.

    Oral and Maxillofacial Surgery: Oral and maxillofacial surgery is the specialty of dentistry which includes
    the diagnosis, surgical and adjunctive treatment of diseases, injuries and defects involving both the functional
    and esthetic aspects of the hard and soft tissues of the oral and maxillofacial region.

    Orthodontics and Dentofacial Orthopedics: Orthodontics and dentofacial orthopedics is the dental specialty
    that includes the diagnosis, prevention, interception, and correction of malocclusion, as well as
    neuromuscular and skeletal abnormalities of the developing or mature orofacial structures.

    Pediatric Dentistry: Pediatric Dentistry is an age-defined specialty that provides both primary and
    comprehensive preventive and therapeutic oral health care for infants and children through adolescence,
    including those with special health care needs.

    Periodontics: Periodontics is that specialty of dentistry which encompasses the prevention, diagnosis and
    treatment of diseases of the supporting and surrounding tissues of the teeth or their substitutes and the
    maintenance of the health, function and esthetics of these structures and tissues.

    Prosthodontics: Prosthodontics is the dental specialty pertaining to the diagnosis, treatment planning,
    rehabilitation and maintenance of the oral function, comfort, appearance and health of patients with clinical
    conditions associated with missing or deficient teeth and/or oral and maxillofacial tissues using
    biocompatible substitutes.

    These definitions were downloaded from the American Dental Association website: http://www.ada.org/495.aspx on
    April 10, 2012.

    Office for Healthcare Workforce Analysis and Planning                                                     April 2012
officeforhealthcareworkforce.org
Office for
HEALTHCARE
WORKFORCE
analysis & planningYou can also read