The star cluster age function in the Galactic disc with Gaia DR2
←
→
Page content transcription
If your browser does not render page correctly, please read the page content below
Astronomy & Astrophysics manuscript no. clusteragefunction_letter                                                                    ©ESO 2020
                                               July 24, 2020

                                                                                                           Letter to the Editor

                                                   The star cluster age function in the Galactic disc with Gaia DR2
                                                                     Fewer old clusters and a low cluster formation efficiency
                                                                            Friedrich Anders1 , Tristan Cantat-Gaudin1 , Irene Quadrino-Lodoso1 ,
                                                                         Mark Gieles1, 2 , Carme Jordi1 , Alfred Castro-Ginard1 , Lola Balaguer-Núñez1

                                                     1
                                                         Institut de Ciències del Cosmos, Universitat de Barcelona (IEEC-UB), Martí i Franquès 1, E-08028 Barcelona, Spain
                                                     2
                                                         ICREA, Passeig Lluis Companys 23, E-08010 Barcelona, Spain

                                                     Received July 24, 2020; accepted ???, ???
arXiv:2006.01690v2 [astro-ph.GA] 23 Jul 2020

                                                                                                                  ABSTRACT

                                                     We perform a systematic reanalysis of the age distribution of Galactic open star clusters. Using a catalogue of homogeneously
                                                     determined ages for 834 open clusters contained in a 2 kpc cylinder around the Sun and characterised with astrometric and photometric
                                                     data from the Gaia satellite, we find that it is necessary to revise earlier works that relied on data from the Milky Way Star Cluster
                                                     survey. After establishing age-dependent completeness limits for our sample, we find that the cluster age function in the range 6.5 <
                                                     log t < 10 is compatible with a Schechter-type or broken power-law function, whose parameters we determine by MCMC fitting.
                                                     Our best-fit values indicate an earlier drop of the age function (by a factor of 2 − 3) with respect to the results obtained in the last
                                                     five years, and are instead more compatible with results obtained in the early 2000s and radio observations of inner-disc clusters.
                                                     Furthermore, we find a typical destruction time-scale of ∼ 1.5 Gyr for a 104 M cluster and a present-day cluster-formation rate of
                                                     0.55+0.19     −1    −2                           +11
                                                          −0.15 Myr kpc , suggesting that only 16−8 % of all stars born in the solar neighbourhood form in bound clusters. Accurate
                                                     cluster-mass measurements are now needed to place more precise constraints on open-cluster formation and evolution models.
                                                     Key words. Galaxy: open clusters, Galaxy: evolution, Galaxy: solar neighbourhood, methods: data analysis, statistical

                                               1. Introduction                                                            2018; Cantat-Gaudin & Anders 2020). The impact of Gaia on
                                                                                                                          the field of Galactic cluster studies can thus hardly be overesti-
                                               It is becoming increasingly difficult to understand the formation          mated.
                                               of galaxies without taking into account several levels of baryonic             The main remaining challenges for obtaining a clean and un-
                                               hierarchical structure formation. To unravel the formation his-            biased CAF for the Milky Way (or at least for the local solar
                                               tory of the Milky Way disc, however, it is often useful to study           neighbourhood of a few kpc) are a) the irregular dust distri-
                                               open star clusters (OCs): groups of stars of the same age and              bution in the Galactic disc; b) the intrinsically patchy distribu-
                                               abundance pattern, held together by mutual gravitation.                    tion of star clusters and other young disc tracers (Becker 1963;
                                                    The physical processes governing the formation and evolu-             Becker & Fenkart 1970; Efremov 2010; Moitinho 2010; Cantat-
                                               tion of OCs are encoded in the distribution of their properties:           Gaudin et al. 2018; Reid et al. 2019; Skowron et al. 2019), ren-
                                               mass, age, size, etc. (for a recent review, see Krumholz et al.            dering completeness estimates difficult; c) the smooth transition
                                               2019). Since it is relatively easy to estimate at least differential       between moving groups, associations, and physically bound OCs
                                               ages for OCs, one of the key observables of the local OC pop-              (Krumholz et al. 2019; Kounkel & Covey 2019; Cantat-Gaudin
                                               ulation is the completeness-corrected age function (e.g. Wielen            & Anders 2020; Kounkel et al. 2020); and d) the availability of
                                               1971; Janes et al. 1988; Battinelli & Capuzzo-Dolcetta 1991;               homogeneously derived cluster parameters.
                                               Lamers et al. 2005; Piskunov et al. 2006; Morales et al. 2013;                 The last problem has recently been adressed by Cantat-
                                               Piskunov et al. 2018; Krumholz et al. 2019). This cluster age              Gaudin et al. (2020, hereafter CGa20) who published a catalogue
                                               function (CAF) can be thought of as an integral of the clus-               of homogeneous age estimates for 1,867 Galactic OCs confirmed
                                               ter distribution function over several other parameters that are           by Gaia DR2. In this Letter we use this catalogue to reevaluate
                                               much more difficult to determine (such as present-day mass, ini-           the Milky Way’s CAF. Our figures (including the completeness
                                               tial mass, internal rotation, binary fraction, etc.).                      analysis) are reproducible via the python code provided here:
                                                    In the Milky Way, the census of OCs is highly incomplete,             https://github.com/fjaellet/gaidr2-caf.
                                               at least beyond a local volume of ∼ 1 − 2 kpc (Kharchenko
                                               et al. 2013). Thanks to the unprecedented quality of the astro-
                                               metric and photometric data released with Gaia’s second data               2. The Gaia DR2 open-cluster census
                                               release (DR2; Gaia Collaboration et al. 2018), hundreds of new
                                               clusters have recently been detected even at smaller distances             The precise Gaia DR2 astrometry (positions, proper motions and
                                               (e.g. Cantat-Gaudin et al. 2018, 2019; Castro-Ginard et al. 2019,          parallaxes) allows for detections of OC members (including their
                                               2020; Liu & Pang 2019; Sim et al. 2019). In addition, some anal-           tidal tails; Röser et al. 2019; Röser & Schilbach 2019) and the
                                               yses have shown that previous catalogues also contained large              discovery of thousands of new clusters and moving groups al-
                                               numbers of false positives and asterisms (Cantat-Gaudin et al.             most entirely from the proper-motion measurements (e.g. Gaia
                                                                                                                                                                       Article number, page 1 of 6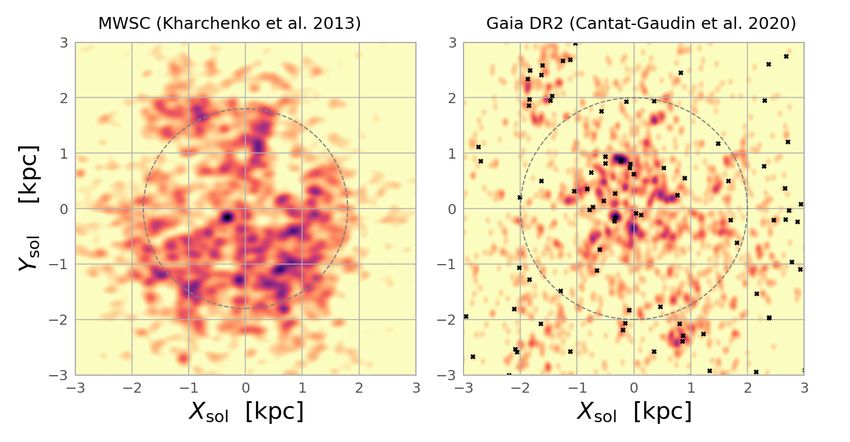
A&A proofs: manuscript no. clusteragefunction_letter
Collaboration et al. 2018; Cantat-Gaudin et al. 2018; Kounkel &
Covey 2019; Meingast et al. 2019). The Gaia photometry (Evans
et al. 2018) allows to characterise these objects in detail through
their colour-magnitude diagrams.
Here we use the homogeneously derived parameters for
1 867 Gaia-detected clusters recently published by CGa20. For
that catalogue, the main cluster parameters age, distance modu-
lus, and extinction were computed from the observed Gaia DR2
parallaxes and G vs. (G BP − GRP ) colour-magnitude diagrams
by a multi-layer-perceptron neural network trained on a set of
347 OCs with well-determined parameters (mostly taken from
Bossini et al. 2019). The cluster membership lists were mostly
taken from Cantat-Gaudin & Anders (2020) and Castro-Ginard
et al. (2020). The typical log t uncertainties derived by the neu-
ral network amount to 0.15-0.25 for clusters younger than 300
Myr, and 0.1-0.15 for clusters older than that. For details of the
method, we refer to CGa20.
Recent studies of the CAF (Joshi et al. 2016; Piskunov et al.
2018; Krumholz et al. 2019) have relied on the cluster data com-
piled in the latest version of the Milky Way Star Cluster survey
(Kharchenko et al. 2016). A substantial fraction of objects con-
tained in this catalogue (among them all the putatively old, high-
latitude inner-galaxy OC candidates, as well as many dubious
NGC objects and about 50% of the old nearby FSR cluster candi-
dates of Froebrich et al. 2007), however, could not be confirmed
with Gaia DR2 (Cantat-Gaudin et al. 2018; Cantat-Gaudin &
Anders 2020). In the following analysis, we therefore compare
both to the Kharchenko et al. (2013) version of the MWSC as
well as to its latest version.
To illustrate the transformative power of Gaia DR2 on the
field, Fig. 1 compares the distribution of OCs in heliocen-
tric Cartesian coordinates derived from the MWSC catalogue
with the distribution obtained from the new catalogue of Gaia-
detected OCs of CGa20. For a deeper discussion of the structures
emerging from this figure, we refer to the latter paper. Here our
main objective is to estimate the (age-dependent) completeness
of the new catalogue in order to determine the CAF.
In order to correct for our incomplete view of the Galactic
OC population, we need to quantify how selection biases af-
fect our samples. The different aspect of the OC distributions
in the right column of Fig. 1 already suggests that the present
Gaia DR2 census is unlikely to be complete to a fixed limit, as
was frequently assumed for the MWSC catalogue (the dashed
grey circle in the left-column panels denotes the 1.8 kpc com-
pleness limit used by Kharchenko et al. 2016; Joshi et al. 2016,
and Piskunov et al. 2018).
In this work, we estimate the age-dependent completeness of
the Gaia DR2 cluster census within a cylinder of radius d xy = 2
kpc (right column of Fig. 1). The analysis can be retraced in
more detail in Appendix ??. In a nutshell, we take into account
two effects: 1. Undetected clusters: we use the OC recovery ex-
periment performed for the latest Galactic-plane OC search of
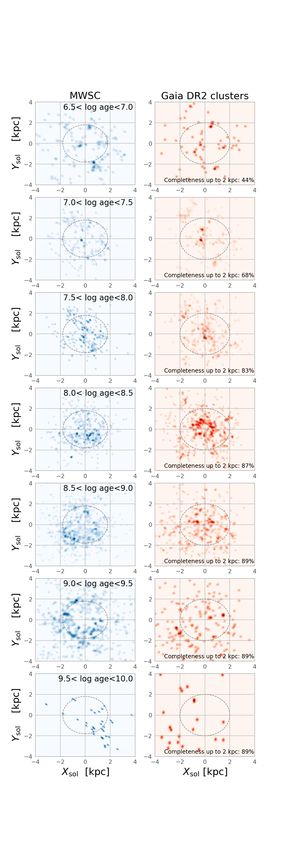
Fig. 1. Galactic distribution of the OC samples studied in this Letter, Castro-Ginard et al. (2020) to estimate the detection efficiency of
sliced into logarithmic age bins. Left: pre-Gaia census using the MWSC their conservative method as a function of distance, sky region,
catalogue (Kharchenko et al. 2013). Right: Post-Gaia DR2 census, us- and age. 2. Uncharacterised clusters: Not for all Gaia-detected
ing the catalogue of Cantat-Gaudin et al. (2020). In each panel we show OCs it was possible to infer physical parameters in CGa20.
a 2D kernel density estimate with a fixed bandwidth of 0.05 kpc. For Within the 2 kpc cylinder, however, this effect is minor: only
the MWSC, the dashed circle corresponds to the completeness limit of
1.8 kpc used in the literature (e.g. Piskunov et al. 2018), while for the
32 non-characterised clusters have Bayesian parallax distances
Gaia DR2 census we use a sample limit of 2 kpc, together with age- smaller than 2 kpc. Estimating their age distribution using the
dependent completeness fractions indicated in each panel (see Sect. 2, values of Kharchenko et al. (2013), we find that they are mostly
last paragraph). younger than log t = 7.5. The combined completeness fractions
for each age bin are given in Fig. 1.
Article number, page 2 of 6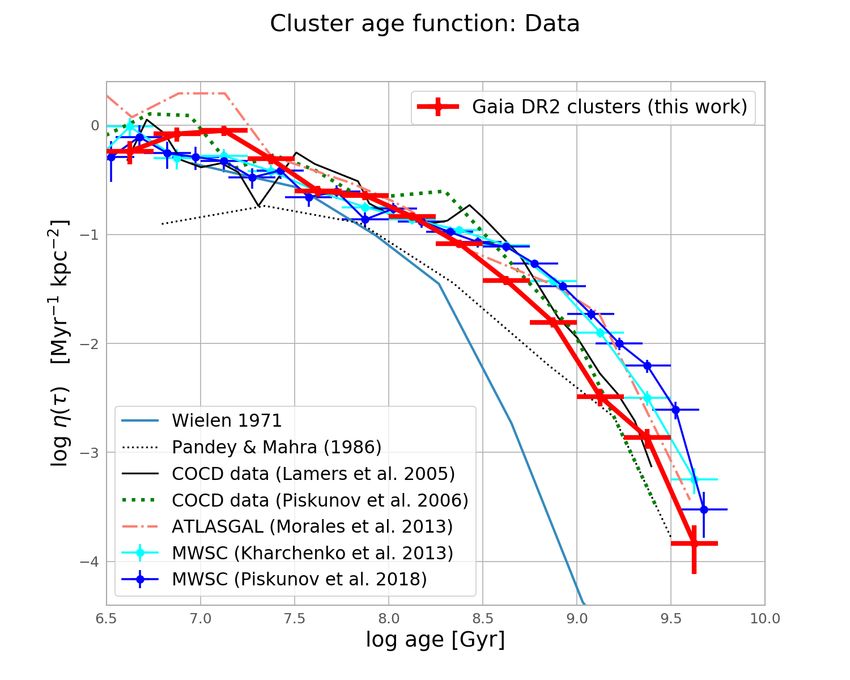
Anders, Cantat, Quadrino, et al.: The cluster age function of the Milky Way
3. The post-Gaia DR2 cluster age function
Having established the completeness limits of the Gaia DR2
cluster sample, we can now determine the age distribution and
the CAF. The top panel of Fig. 2 shows the histogram and a
kernel-density estimate of the logarithmic age distribution for
the Gaia DR2 census within a 2 kpc cylinder around the Sun. For
comparison we also show the results obtained with the original
MWSC catalogue (Kharchenko et al. 2013) and the latest version
used by Piskunov et al. (2018) and Krumholz et al. (2019). From
Fig. 2 we can already appreciate some important differences with
respect to these pre-Gaia works: the peak of the distribution lies
around log t ∼ 8.2, and despite the fact that the Gaia census is
much more complete for old OCs, we see a lot less of those ob-
jects.
The typical metric for the cluster age distribution, used both
by the Galactic and the extragalactic community, is the cluster
age function (CAF): the number of clusters per unit of age, in
logarithmic age bins. Following the method of Piskunov et al.
(2018), we derived the CAF for the MWSC and the Gaia sam-
ples. Our results are shown in the middle panel of Fig. 2. In this
panel, we also show some of the literature results compiled by
Piskunov et al. (2018), namely Wielen (1971); Pandey & Mahra
(1986); Lamers et al. (2005); Piskunov et al. (2006), and Morales
et al. (2013).
In the bottom panel of Fig. 2, we compare our data to a num-
ber of models. In particular, these are two of the cluster destruc-
tion models presented by Lamers et al. (2005), a fit to the Lamers
& Gieles (2006) model, and the results of our fits to two sim-
ple analytical functions, all performed with the Markov-chain
Monte-Carlo sampler emcee (Foreman-Mackey et al. 2013).
We confirm the conclusion of Krumholz et al. (2019) that
the Milky Way CAF is well fitted by a Schechter function or,
slightly worse, by a broken power law. The fit parameters for
those functions, however, have to be revised. In particular, we
obtain best-fit values of αT = −0.65+0.10 +0.07
−0.10 , log t = 9.30−0.06 for
∗
the Schechter case (Krumholz et al. 2019: αT = −0.55, log t∗ =
+0.29
9.59), and α1 = −0.56+0.16
−0.11 , α2 = −2.34−0.36 , log t
break
= 8.49+0.21
−0.21
for the case of a broken power law (Krumholz et al. 2019: α1 =
−0.61, α2 = −1.67, log tbreak = 8.89). Our basic conclusion is
that the downturn in the CAF occurs at lower ages (by a factor
2 − 3) and the slope beyond the break is steeper.
4. Discussion
The CAF is the marginalised probability distribution of the full
Galactic OC distribution function. Until the first mass estimates
for Gaia clusters become available, it is our best tool to study the
physics of OC formation and destruction. The new homogeneous
age catalogue of Gaia DR2-detected OCs of CGa20 allows us to
probe this observable with better precision and accuracy than
ever before.
Our measurements, summarised in Fig. 2, rule out the old-
age-heavy CAF obtained in the last years from the MWSC cata-
logue, which contains a significant number of allegedly old false
positives. Instead, our new CAF determination is in line with
earlier measurements (e.g. Lamers et al. 2005; Piskunov et al.
Fig. 2. Age distribution for Galactic open clusters in the solar vicin- 2006; Morales et al. 2013; for a detailed discussion of the his-
ity. Top panel: normalised histograms and kernel-density estimates. The tory of Milky Way CAF measurements, we refer to Sect 3.3 of
cyan and blue distributions show the results from the MWSC survey Piskunov et al. 2018).
(Kharchenko et al. 2013 and Piskunov et al. 2018, respectively); the This also implies that some cluster formation and destruction
red distribution shows our Gaia DR2-derived results. Middle and bot- models from the pre-MWSC era are still compatible with our
tom panels: Observational CAF determinations for the extended so- measurements. In particular, this is the case for the model of
lar neighbourhood, from Wielen (1971) to our completeness-corrected
Gaia DR2-based census (red). Errorbars include Poissonian uncertain-
Lamers et al. (2005) with a typical destruction time-scale for a
ties in the number of clusters per bin and systematic uncertainties from
Article number, page 3 of 6
the completeness correction (see Appendix A). Bottom panel: CAF
comparison to models, as indicated in the legend.
A&A proofs: manuscript no. clusteragefunction_letter

104 M OC of t4 ∼ 1.5 Gyr, which we show in Fig. 2 (dashed                            Astropy Collaboration, Price-Whelan, A. M., Sipőcz, B. M., et al. 2018, AJ, 156,
black line). Those authors modelled the cluster destruction as                          123
                                                                                     Battinelli, P. & Capuzzo-Dolcetta, R. 1991, MNRAS, 249, 76
tdis ∝ t4 · (Mini /104 M )γ , with γ ≈ 0.62 and a star-formation rate                Becker, W. 1963, ZAp, 57, 117
in clusters of ∼ 500 M Myr−1 kpc−2 . Surprisingly, almost all of                     Becker, W. & Fenkart, R. B. 1970, in IAU Symposium, Vol. 38, The Spiral Struc-
our CAF data points (except for the lowest age bin) are consistent                      ture of our Galaxy, ed. W. Becker & G. I. Kontopoulos, 205
                                                                                     Bossini, D., Vallenari, A., Bragaglia, A., et al. 2019, A&A, 623, A108
with the Lamers et al. (2005) model within 1σ. In addition, we                       Cantat-Gaudin, T. & Anders, F. 2020, A&A, 633, A99
find - in accordance with Morales et al. (2013) - a hint of a short                  Cantat-Gaudin, T., Anders, F., Castro-Ginard, A., et al. 2020, A&A, in press,
bump in the cluster-formation rate at very young ages, around 6−                        arXiv:2004.07274
                                                                                     Cantat-Gaudin, T., Jordi, C., Vallenari, A., et al. 2018, A&A, 618, A93
20 Myr (dash-dotted curve in Fig. 2). The proximity of our data                      Cantat-Gaudin, T., Krone-Martins, A., Sedaghat, N., et al. 2019, A&A, 624,
to the CAF obtained by Morales et al. (2013) from ATLASGAL                              A126
radio data (Schuller et al. 2009) of mostly embedded clusters                        Castro-Ginard, A., Jordi, C., Luri, X., et al. 2020, A&A, 635, A45
                                                                                     Castro-Ginard, A., Jordi, C., Luri, X., Cantat-Gaudin, T., & Balaguer-Núñez, L.
towards the inner Galaxy also suggests little change in the cluster                     2019, A&A, 627, A35
destruction rate within a few kpc from the Sun.                                      Efremov, Y. N. 2010, MNRAS, 405, 1531
     Lamers & Gieles (2006) parameterised the destruction time                       Evans, D. W., Riello, M., De Angeli, F., et al. 2018, A&A, 616, A4
                                                                                     Foreman-Mackey, D., Hogg, D. W., Lang, D., & Goodman, J. 2013, PASP, 125,
of initially bound OCs in the solar neighbourhood, taking into                          306
account four processes in the life of OCs: stellar evolution, tidal                  Froebrich, D., Scholz, A., & Raftery, C. L. 2007, MNRAS, 374, 399
disruption by the Galactic gravitational field, shocking by spiral                   Gaia Collaboration, Brown, A. G. A., Vallenari, A., et al. 2018, A&A, 616, A1
                                                                                     Gieles, M., Lamers, H. J. G. L. M., & Portegies Zwart, S. F. 2007, ApJ, 668, 268
arms, and (most importantly) encounters with giant molecular                         Hunter, J. D. 2007, Computing in Science and Engineering, 9, 90
clouds. They showed that the observed CAF depends on the the                         Janes, K. A., Tilley, C., & Lynga, G. 1988, AJ, 95, 771
                                                                                     Joshi, Y. C., Dambis, A. K., Pandey, A. K., & Joshi, S. 2016, A&A, 593, A116
destruction time-scale, the cluster-formation rate, and the cluster                  Kharchenko, N. V., Piskunov, A. E., Schilbach, E., Röser, S., & Scholz, R. D.
initial-mass function. In the absence of cluster masses, however,                       2013, A&A, 558, A53
we find that these parameters are still degenerate and thus refrain                  Kharchenko, N. V., Piskunov, A. E., Schilbach, E., Röser, S., & Scholz, R. D.
from reporting fit values for such a model. The current cluster-                        2016, A&A, 585, A101
                                                                                     Kounkel, M. & Covey, K. 2019, AJ, 158, 122
formation rate, however, can in principle be read off the lowest                     Kounkel, M., Covey, K., & Stassun, K. G. 2020, AJ, submitted,
age bin (which is the one most affected by our completeness cor-                        arXiv:2004.07261
rections and should be treated cautiously): 0.55+0.19        −1
                                                   −0.15 Myr kpc .
                                                                   −2                Krumholz, M. R., McKee, C. F., & Bland -Hawthorn, J. 2019, ARA&A, 57, 227
                                                                                     Lamers, H. J. G. L. M. & Gieles, M. 2006, A&A, 455, L17
     Assuming a typical initial mass of ∼ 300 − 600 M (the exact                     Lamers, H. J. G. L. M., Gieles, M., Bastian, N., et al. 2005, A&A, 441, 117
value depends of the cluster initial-mass function and the typical                   Liu, L. & Pang, X. 2019, ApJS, 245, 32
                                                                                     Meingast, S., Alves, J., & Fürnkranz, V. 2019, A&A, 622, L13
lower-mass limit of our sample), we obtain a star-formation rate                     Moitinho, A. 2010, in IAU Symposium, Vol. 266, Star Clusters: Basic Galac-
in clusters of 250+190              −1   −2
                     −130 M Myr kpc , which, when compared                              tic Building Blocks Throughout Time and Space, ed. R. de Grijs & J. R. D.
to the total star-formation rate in the solar vicinity (1600+700
                                                             −400 M
                                                                                        Lépine, 106–116
                                                                                     Mor, R., Robin, A. C., Figueras, F., Roca-Fàbrega, S., & Luri, X. 2019, A&A,
Myr−1 kpc−2 ; Mor et al. 2019), suggests that only 16+11  −8 %  of the                  624, L1
stars in the solar vicinity form in bound clusters (see also Adamo                   Morales, E. F. E., Wyrowski, F., Schuller, F., & Menten, K. M. 2013, A&A, 560,
                                                                                        A76
et al. 2020; Ward et al. 2020).                                                      Pandey, A. K. & Mahra, H. S. 1986, Ap&SS, 126, 167
     Krumholz et al. (2019, Sect. 2.3) reviewed determinations of                    Piskunov, A. E., Just, A., Kharchenko, N. V., et al. 2018, A&A, 614, A22
the CAF for external galaxies (based on unresolved cluster ob-                       Piskunov, A. E., Kharchenko, N. V., Röser, S., Schilbach, E., & Scholz, R. D.
                                                                                        2006, A&A, 445, 545
servations) and compared them to the local CAF obtained from                         Reid, M. J., Menten, K. M., Brunthaler, A., et al. 2019, ApJ, 885, 131
the Piskunov et al. (2018) data. They note that the typical power-                   Röser, S. & Schilbach, E. 2019, A&A, 627, A4
law index αT for the Milky Way seemed to steepen quickly                             Röser, S., Schilbach, E., & Goldman, B. 2019, A&A, 621, L2
                                                                                     Schuller, F., Menten, K. M., Contreras, Y., et al. 2009, A&A, 504, 415
around ages of ∼ 109 Gyr, in stark contrast to other galaxies                        Sim, G., Lee, S. H., Ann, H. B., & Kim, S. 2019, Journal of Korean Astronomical
(their Fig. 6). Our revised OC census based on Gaia DR2 seems                           Society, 52, 145
to bring the Milky Way back in line with most other spiral galax-                    Skowron, D. M., Skowron, J., Mróz, P., et al. 2019, Science, 365, 478
                                                                                     Taylor, M. B. 2005, Astronomical Society of the Pacific Conference Series, Vol.
ies, including M31, for the age range 7.5 < log t < 9.5.                                347, TOPCAT & STIL: Starlink Table/VOTable Processing Software,
     The comparison to extragalactic samples, however, is still                         ed. P. Shopbell, M. Britton, & R. Ebert, 29
biased in two other ways (Krumholz et al. 2019): 1. our Milky                        van der Walt, S., Colbert, S. C., & Varoquaux, G. 2011, Computing in Science
Way sample is still limited to ∼ 2 − 3 kpc from the Sun and                             and Engineering, 13, 22
                                                                                     Virtanen, P., Gommers, R., Oliphant, T. E., et al. 2020, Nature Methods, 17, 261
consists entirely of low-mass clusters (M . 103 M ), while ex-                       Ward, J. L., Kruijssen, J. M. D., & Rix, H.-W. 2020, MNRAS, 495, 663
tragalactic samples are dominated by the most massive clusters                       Wielen, R. 1971, A&A, 13, 309
(usually M > 103.5 M ); and 2. ages for extragalactic clusters are                   Acknowledgements. We thank Mercè Romero-Gómez and Cesca Figueras
derived from integrated photometry, whereas ours have been de-                       for their comments. This work has made use of data from the Euro-
rived from high-precision Gaia DR2 colour-magnitude diagrams                         pean Space Agency (ESA) mission Gaia (www.cosmos.esa.int/gaia), pro-
and parallaxes, thus making our measurement a new benchmark                          cessed by the Gaia Data Processing and Analysis Consortium (DPAC,
                                                                                     www.cosmos.esa.int/web/gaia/dpac/consortium). Funding for the DPAC has
for extragalactic studies as well.                                                   been provided by national institutions, in particular the institutions partici-
     We look forward to the next Gaia data releases, which will                      pating in the Gaia Multilateral Agreement. This work was supported by the
enable an even deeper characterisation of thousands of Galac-                        MINECO (Spanish Ministry of Economy) through grant RTI2018-095076-B-
tic open clusters, eventually allowing also for precise determi-                     C21 (MINECO/FEDER, UE). TCG acknowledges support from Juan de la
                                                                                     Cierva - Formación 2015 grant, MINECO (FEDER/UE). FA is grateful for
nations of cluster masses. The joint mass and age distribution of                    funding from the European Union’s Horizon 2020 research and innovation pro-
the Milky Way, as well as variations in the CAF as a function                        gramme under the Marie Skłodowska-Curie grant agreement No. 800502. The
of position in the Galaxy, will then allow us to test the limits of                  preparation of this work has made use of TOPCAT (Taylor 2005), NASA’s Astro-
state-of-the-art cluster-formation and destruction models.                           physics Data System Bibliographic Services, as well as the open-source Python
                                                                                     packages Astropy (Astropy Collaboration et al. 2018), NumPy (van der Walt
                                                                                     et al. 2011), scikit-learn (Virtanen et al. 2020), and emcee (Foreman-Mackey
References                                                                           et al. 2013). The figures in this paper were produced with Matplotlib (Hunter
                                                                                     2007).
Adamo, A., Zeidler, P., Kruijssen, J. M. D., et al. 2020, Space Sci. Rev., 216, 69

Article number, page 4 of 6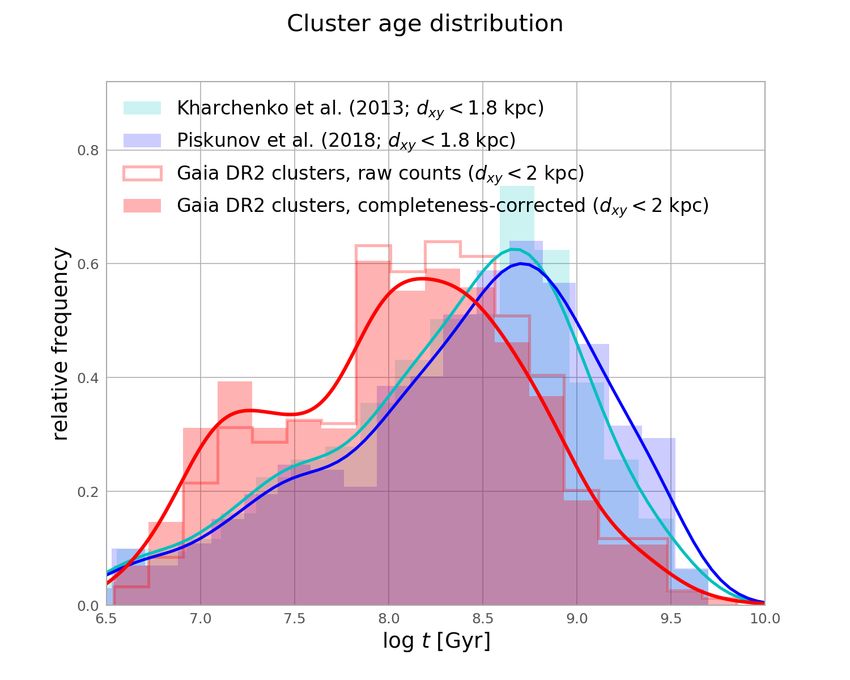
Anders, Cantat, Quadrino, et al.: The cluster age function of the Milky Way

                                                                           Table A.1. Completeness estimates as a function of age for the CGa20
                                                                                             xy = 2 kpc.
                                                                           catalogue out to dlim

                                                                            log t       ANN              Detection         Combined
                                                                            [yr]     completeness      completeness       completeness
                                                                            6.5         0.77             0.52+0.08
                                                                                                             −0.07          0.40+0.08
                                                                                                                                −0.07
                                                                            7           0.88             0.54+0.08
                                                                                                             −0.07          0.48+0.08
                                                                                                                                −0.07
                                                                            7.5         0.99             0.65+0.05
                                                                                                             −0.05          0.64+0.05
                                                                                                                                −0.05
                                                                            8           0.99             0.76+0.05
                                                                                                             −0.04          0.75+0.05
                                                                                                                                −0.04
                                                                            8.5           1              0.81+0.04
                                                                                                             −0.04          0.81+0.04
                                                                                                                                −0.04
                                                                            9             1              0.85+0.05
                                                                                                             −0.04          0.85+0.05
                                                                                                                                −0.04
                                                                            9.5           1              0.88+0.05
                                                                                                             −0.06          0.88+0.05
                                                                                                                                −0.06
                                                                            10            1              0.88+0.05
                                                                                                             −0.06          0.88+0.05
                                                                                                                                −0.06
Fig. A.1. Distribution of Galactic OCs using the MWSC (left) and the
Gaia DR2-derived catalogue (right), respectively. The crosses in the
right panel indicate the positions of the clusters for which no physical
parameters could be obtained in Cantat-Gaudin et al. (2020).               et al. (2018). They categorised these clusters into recovered/half-
                                                                           recovered/non-recovered - see [Fig. 1 of Castro-Ginard et al.
                                                                           2020]. Here we use these weights to determine the OC recovery
                                                                           fraction in wide bins of [l, b, d xy , log t]. We find that the recovery
Appendix A: Completeness of the OC census                                  fraction does not depend significantly on extinction (beyond the
                                                                           intrinsic correlation of this parameter with distance). The results
In this appendix we characterise the completeness of the OC cat- are shown in Fig. A.2. Since the blind search of Castro-Ginard
alogue of Cantat-Gaudin et al. (2020).                                     et al. (2020) was not optimised for nearby clusters, we focus on
     The probability of detecting a resolved Galactic star cluster the distance range d > 1 kpc.
                                                                                                 xy
depends on a number of key parameters, such as its total mass,                 Now we can define a completeness fraction as a function of
age, distance, or extinction. However, one may also invoke an log t out to a limiting distance dmax by numerically integrating
additional dependence on other, slightly more subtle parameters, the selection fraction over the d xy              , l and b dimensions, and linear
such as the contrast in the proper-motion diagram, the number of interpolation between the log t xybins. We also estimate the un-
bright stars, the amount of differential extinction, etc. We are fac- certainty associated to the completeness estimates. In order to
ing the additional challenge that the true underlying spatial dis- do this, we can assume Poissonian distributions of the counts in
tribution of OCs is complex and unknown, and that the transition each age bin (for each group: non-detected, half-detected, and
between bound clusters, associations, and dissolving structures detected). This allows us to determine the completeness uncer-
becomes increasingly unsharp (e.g. Kounkel et al. 2020; Ward tainties numerically.
et al. 2020).                                                                  The implicit assumption behind our approach is that the ex-
     The Gaia DR2-based catalogue of CGa20 is a clean OC cat- periment of Castro-Ginard et al. (2020) is representative for
alogue, limited by the number of stars above a certain magnitude the full CGa20 catalogue. This is debatable, but the best we
threshold (G < 17...18, depending on the provenance of the clus- can do at present: On the one hand, this estimate is pes-
ter detection). In contrast to the case of unresolved extragalactic simistic, because we only estimate the completeness of one
clusters, the number of stars above the magnitude detection limit method (DBSCAN), while the full catalogue of Gaia-detected
only decreases very little with mass as long as the turn-off is OCs was compiled from various different search methods (tra-
above the detection limit (see e.g. Fig. 2 of Gieles et al. 2007). ditional OCs, serendipitous discoveries, blind machine-learning
We therefore opt to parametrise the selection function of our OC searches, etc.). It is also pessimistic in the sense that the blind
catalogue as a function depending primarily on Galactic longi- search of Castro-Ginard et al. (2020) has added more than 500
tude l, latitude b, planar distance d xy , log t, and extinction AV .      new OCs. On the other hand, one may argue that the DB-
     We make the following approximation:                                  SCAN completeness test of Castro-Ginard et al. (2020) may
p(Gaia DR2 cluster has a CGa20 age)                                        have been slightly optimistic since the sample of Cantat-Gaudin
                                                                           et al. (2018) may not be fully representative of the underlying
 = p(ANN converged|cluster detection) · p(cluster detection)               population.
 ≈ p(ANN converged|d xy , log t) · p(cluster detection|l, b, d xy , log t)     The results of our completeness calculations are given in Ta-
                                                                           ble A.1. The second column contains the first factor (physical
                                                                           parameter completeness), the third column contains the second
In other words, the completeness of the age census of Gaia DR2 factor (cluster recovery fraction), and the last column the prod-
OCs depends on 1. our ability to derive OC parameters for de- uct of the two. The associated systematic uncertainties have been
tected clusters, and 2. our detection efficiency.                          propagated into the uncertainties of the cluster age function (e.g.
     For the first factor (completeness of the ANN-derived pa- the errorbars in Fig. 2) and all derived quantities.
rameters), we simply determine the fraction of clusters within
d xy = 2 kpc for which no physical parameters were obtained in
Cantat-Gaudin et al. (2020, see Fig. A.1). This fraction is very
low (. 1%) for log t > 7 and increases to 23 % for the youngest
age bin (using the age estimates of Kharchenko et al. 2013).
     To estimate the second factor, we use the experiment car-
ried out by Castro-Ginard et al. (2020). These authors inves-
tigated the recovery fraction of their catalogue by comparing
the blind-search detections to the OC list of Cantat-Gaudin
                                                                                                                       Article number, page 5 of 6
A&A proofs: manuscript no. clusteragefunction_letter Fig. A.2. Cluster recovery fraction of the Galactic plane search of Castro-Ginard et al. (2020), as a function of Galactic longitude, latitude, planar distance, and age. In each panel, the black, grey, and white symbols denote Cantat-Gaudin et al. (2018) clusters that were recovered, half-recovered, or not recovered, respectively, by the blind search of Castro-Ginard et al. (2020). Article number, page 6 of 6
You can also read