Electrospray ionization mass spectrometry fingerprinting of whisky: immediate proof of origin and authenticity
←
→
Page content transcription
If your browser does not render page correctly, please read the page content below
PAPER                                                                                        www.rsc.org/analyst | The Analyst

Electrospray ionization mass spectrometry fingerprinting of whisky:
immediate proof of origin and authenticity
Jens K. S. Møller,a Rodrigo R. Catharinob and Marcos N. Eberlin*b
Received 5th October 2004, Accepted 14th March 2005
First published as an Advance Article on the web 11th April 2005
DOI: 10.1039/b415422c

Authentic samples of whisky produced in Scotland and USA and counterfeit whisky samples
commercialized in Brazil have been directly submitted to electrospray ionization mass spectrometry
(ESI-MS) analysis in both the negative and positive ion modes to assess the potential of this
technique for simple and rapid quality control and proof of authenticity of whisky samples. ESI in
the negative ion mode yields the most characteristic whisky fingerprinting mass spectra in just a few
seconds by direct infusion of the samples, detecting the most polar or acidic components of each
sample in their deprotonated anionic forms. No pre-treatment of the sample, such as extraction or
derivatization or even dilution, is required. The analysis of the ESI(2)-MS data both by simple
visual inspection but more particularly by chemometric data treatment enables separation of the
whisky samples into three unequivocally distinct groups: Scotch, American and counterfeit whisky,
whereas single malt and blended Scotch whiskies are also distinguished to some extent. As indicated
by ESI-MS/MS analysis, the diagnostic anions are simple sugars, disaccharides and phenolic
compounds. Direct infusion ESI-MS therefore provides immediate chemical fingerprinting of
whisky samples for type, origin and quality control, as demonstrated herein for American, Scottish
and counterfeit samples, whereas ESI-MS/MS analysis of diagnostic ions adds a second dimension
of fingerprinting characterization when improved selectivity is desired.

Introduction                                                         and authenticity. The use of sensory profiling and other organo-
                                                                     leptic testing has been valuable to test authenticity, but such
Scotch whisky is one of the UK’s major export commodities,           methods require a high degree of training.15 Analysis of copper
having a value of US$4 billion in 2003 according to the Scotch       and other trace elements has been suggested as an indicator of
Whisky Association.1 Other variants are manufactured around          authenticity for Scotch whiskies,16 whereas the distribution of
the world, such as in Ireland, USA, Canada and Japan.2,3             methyl-branched alcohols (fusel oils) has been found to distin-
   In general, whisky is considered a luxury ‘‘food product’’ of     guish Irish whiskies from other variants.17 The isotopic ratio of
high quality, partly owing to the traditional way of distillation    13
                                                                       C and 12C,18 and the ratio of furfural and 5-hydroxymethyl-2-
and to the prolonged period of production and maturation.
                                                                     furaldehyde have also been proposed as whisky markers.19
Therefore, whisky belongs to a high value-added segment of
                                                                        Various mass spectrometric (MS) techniques have also been
the market of alcoholic beverages, which is prone to counter-
                                                                     used to analyse and characterize volatiles in whisky.20,21 A MS
feiting and other manipulations aimed at imitating or copying
                                                                     study applied pyrolysis followed by MS to analyse the effect
authentic whiskies. The nature and origins of flavours in
                                                                     and quality of oak casks used for maturation of Scotch
various types of whisky are very complex interactions of
                                                                     whisky.22
several steps in the manufacturing process, and sensory tools
                                                                        ESI-MS with direct infusion of samples has recently been
such as the flavour wheel have been developed to meet the
                                                                     shown to be an efficient, sensitive, and fast ‘‘MS-only’’
demands of the distillers and the product.4
                                                                     technique able to screen the composition of the most polar,
   Over the years the unique character of whiskies and the
                                                                     acidic or basic components of complex mixtures such as beer,23
changes occurring during maturation have been studied.5 The
                                                                     wine,24 and bee propolis.25,26 Herein we present results from
complex chemical composition of whisky has also been
investigated, e.g. organic acids and esters,6,7 mineral content,8    direct infusion ESI-MS analysis of whisky samples and
phenolics9 and lactones10 and characteristic low molecular           demonstrate its suitability for quality control and proof of
weight fusel alcohols and derived compounds.11,12 Various            authenticity of whiskies.
attempts have also been made to develop methods for analysis
and quality control of different types of whisky.13,14               Experimental
   Proof of origin and authenticity are major concerns for the
                                                                     Whisky samples
distillers, dealers and consumers of genuine whiskies around
the world. Attempts have been therefore made to develop              A total of fifteen whisky samples were obtained from reliable
standards or methods for quality control and proof of origin         sources. These include Scotch, American and presumably
                                                                     counterfeit whiskies commercialized in Brazil. Table 1 displays
*eberlin@iqm.unicamp.br                                              an outline of the type and number of each variant used.

890 | Analyst, 2005, 130, 890–897                                            This journal is ß The Royal Society of Chemistry 2005
Table 1 Outline of the types of whisky samples Data handling
Type/origin No. of samples All data obtained from ESI-MS of the various whisky samples
were extracted using MassLynx 3.5 (Waters, Manchester,
Scotch: Blended 7
Single malt 4 UK). Mass spectral data was accumulated over 60 s, centered
American 2 and aligned to generate a final data matrix of 15 samples and
Counterfeita 2 290 mass signals (variables) ranging from m/z 80 to 550 (a
Total 15
a
range that contained all ions of interest as judged by visual
Low-price whisky samples commercialized in Brazil. inspection), while the recorded intensities ranged from 5 000
to 820 000. To classify the whisky samples, a discriminant
partial least squares (D-PLS) regression was performed in
General experimental procedures
Unscrambler v. 8.0 (CAMO Process A/S, Oslo, Norway) using
A Q-TOF mass spectrometer (Micromass, Manchester, UK) MS data as X and a dummy matrix of known classes as Y. As
was used for fingerprinting ESI-MS analysis. The general pretreatment, data in the X-matrix were mean centered and
conditions were: source temperature of 80 uC, capillary voltage normalized prior to analysis.
of 2.1 kV and cone voltage of 40 V. For ESI(+)-MS analysis,
0.5 ml of formic acid was added to the whisky sample (500 ml) Results
to yield 0.1% as the final concentration. Likewise, for
ESI(2)-MS analysis, ammonium hydroxide was added to a Although ESI(+)-MS is also able to distinguish the three types
concentration of 0.1%. ESI-MS was performed by direct of whisky samples unambiguously, ESI(2)-MS produces by
infusion with a flow rate of 10 ml min21 using a syringe pump far the most characteristic mass spectra for whisky fingerprint-
(Harvard Apparatus). Mass spectra were acquired and ing; hence only the ESI(2)-MS data will be presented and
accumulated over 60 s (much shorter accumulation times can discussed.
also be used for high-throughput screening) and spectra were
scanned over the 50 to 3000 m/z range. Mass spectra in the negative ion mode
ESI-MS/MS was performed by mass-selecting the ion Fig. 1 exhibits ESI(2)-MS spectra of three samples of Scotch
of interest using the first quadrupole Q1, which was in whisky. Such spectra are very characteristic and similar owing
turn subjected to 15–55 eV collisions with argon in the to nearly equal composition of the most polar or acidic
second rf-only collision quadrupole (Q2) while scanning components of each sample. Some small and important
the orthogonal TOF mass analyser to acquire its tandem variations are observed, however, which likely result from
mass spectrum. The collision gas pressure was optimized to particular Scotch whisky variants, e.g. single malt vs. blended
produce extensive dissociation with minimal loss of ion or degree of peaty character. Clearly, a number of diagnostic
current. anions, such as those of m/z 143, 171 and 199 are always
Fig. 1 (a)–(c) ESI(2)-MS for three Scotch whisky samples: (a) blended, and (b/c) single malts.
This journal is ß The Royal Society of Chemistry 2005 Analyst, 2005, 130, 890–897 | 891Fig. 2 (a)–(b) ESI(2)-MS of two samples of American whisky.
detected as major ions and this set appears therefore to deprotonated molecules [M 2 H]2 of simple sugars, likely of a
constitute the three most characteristic diagnostic anions for monosaccharide such as glucose (180 Da) and a disaccharide
ESI(2)-MS fingerprinting identification of Scotch whisky. such as sucrose (342 Da), respectively.
Fig. 2 exhibits ESI(2)-MS spectra of two samples of
American whisky. Some anions with relatively higher MS/MS
abundances appear to be diagnostic for American whisky
To improve selectivity by offering an additional MS dimension
such as those of 136, 169, 191, and 267, as well as a great
of whisky fingerprinting and to have, at the same time, an
number of not so abundant but heavier anions of m/z around
indication of their chemical natures, we performed ESI-MS/
300–450. But by far the most characteristic ion for the MS analysis of the most diagnostic anions. Anions of the
American whisky is clearly that of m/z 487. The anion of same m/z values detected in different whisky samples were
m/z 136 indicates a N-containing compound of 137 Da, and selected to investigate whether they arise from ionization of
the origin of this is most likely the cereal source used in the same components. Fig. 5a and 5b exhibit the ESI(2)
the fermentation since the N-content of wood is known to tandem mass spectra for the anion of m/z 179 present in
be very low. counterfeit and American whiskies, respectively. Similar
Fig. 3 exhibits ESI(2)-MS spectra of two counterfeit whisky fragmentation patterns characteristic of a hexose (glucose
samples. Although similarities, mainly with Scotch whisky, for instance) for both samples are observed, and thereby
regarding diagnostic anions are observed, it is clear that a prove that they have identical or at least isomeric structures.
variety of diagnostic anions such as those of m/z 179, 341, 377, A series of fragment ions arising from water loss (18 Da)
387, 405, 439, 485, 503, 529 and 549 clearly distinguish the is observed, which is typical for [M 2 H]2 ions of sugars.27
counterfeit whisky samples. Fig. 5c and 5d display ESI-MS/MS for the diagnostic anion
To facilitate comparison, Fig. 4 shows characteristic of m/z 487 from two samples of American whiskies. The
ESI(2)-MS of a single sample of each of the three major spectra are nearly identical indicating the same origin and
types of whisky investigated herein. It is evident that Scotch that ESI(2)-MS/MS of the diagnostic anion of m/z 487
(Fig. 4a), American (Fig. 4b) and counterfeit (Fig. 4c) whisky provides enhanced and highly selective identification of
samples can be easily differentiated. For the Scotch whisky, American whisky.
the three major diagnostic anions are those of m/z 143, 171, Fig. 6 presents ESI-MS/MS of the anion of m/z 143 for both
and 199. The American whisky is clearly characterized Scotch and counterfeit whiskies. For the anion from the
mainly by a single diagnostic anion of m/z 487. The counterfeit counterfeit sample, little dissociation occurs even when
whisky shares the same set of three diagnostic ions as those considerably increasing the collision energy up to 55 eV. In
of the Scotch whisky (m/z 143, 171, and 199) but many great contrast, the ion of m/z 143 from Scotch whisky
other diagnostic ions are seen. Note that, interestingly, dissociates extensively therefore indicating different chemical
two such anions of m/z 179 and 341 correspond to the compositions for both mass-selected anions.
892 | Analyst, 2005, 130, 890–897 This journal is ß The Royal Society of Chemistry 2005Fig. 3 (a)–(b) ESI(2)-MS of two samples of counterfeit whisky commercialized in Brazil.
Fig. 4 (a)–(c) Typical ESI(2)-MS of (a) Scotch, (b) American and (c) counterfeit whisky samples. Major diagnostic anions are highlighted with
circles.
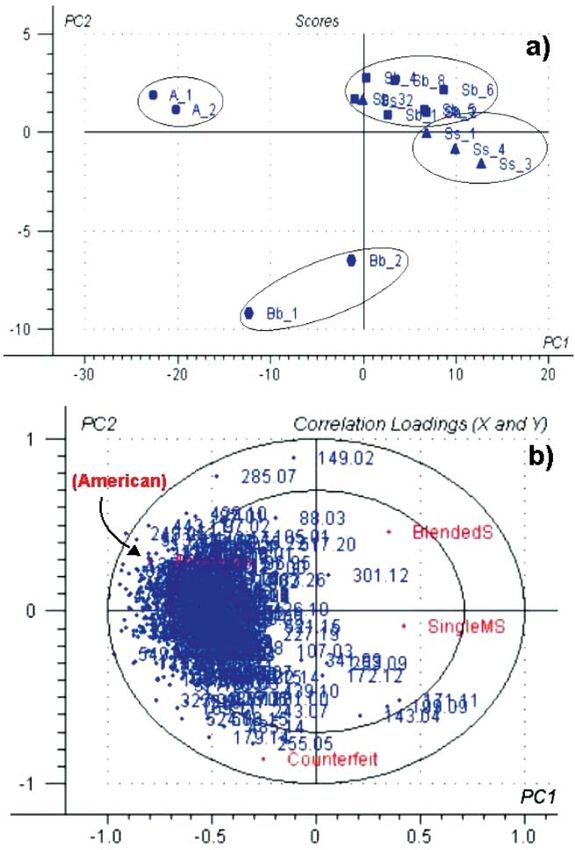
Multivariate data analysis found to be optimal, as principal components 1 and 2 describe
74% and 4% of the total variation in the X-data, respectively,
Fig. 7 shows results from a D-PLS regression performed with whereas 23% and 24% can be accounted for in the Y-data
whisky classes versus m/z ratios of anions in the range from 100 structure. The algorithm for PLS regression was originally
to 550. A PLS regression model with 4 principal components is presented four decades ago,28 and the technique has been
This journal is ß The Royal Society of Chemistry 2005 Analyst, 2005, 130, 890–897 | 893Fig. 5 (a)–(d) ESI(2)-MS/MS of diagnostic anions from different whisky samples. Anions of m/z 179 from (a) counterfeit whisky and (b) from American whisky. Anions of m/z 487 (c and d) from two American whisky samples. further developed and refined for various types of multivariate grouping of samples can be observed in a plot of the data.29 The developments in chemometrics in analytical correlation loading in which sample classes are also indicated. chemistry have been the subject of many reviews.30 The The closer the variables are located to the outer circular line sample scores in Fig. 7a exhibit separate grouping for Scotch, (21; 1) the higher percentage of correctly modelled variance American, and counterfeit whiskies, whereas the Scotch they explain. It can also be seen that counterfeit samples variants of blended or single malt whiskies could also be correlate well with the anions of m/z 179 and 255, whereas differentiated except only for a single sample of blended American samples are related to numerous components malt. In Fig. 7b, the m/z ratios of anions responsible for the making it difficult to pin-point single m/z combinations with 894 | Analyst, 2005, 130, 890–897 This journal is ß The Royal Society of Chemistry 2005
specific m/z values. However, compounds located in the right
                                                                            half of the correlation loadings plot are positively correlated to
                                                                            the Scotch whiskies, but a single component cannot fully
                                                                            account for the MS fingerprints of these samples. Nevertheless,
                                                                            the trio of compounds having anions of m/z 143, 171 and 199,
                                                                            respectively, all have some degree of positive correlation
                                                                            to Scotch whiskies and mostly to single malts as well as
                                                                            counterfeit samples.

                                                                            Discussion
                                                                            The present results show that direct insertion ESI-MS analysis
                                                                            in the negative ion mode produces unique fingerprinting mass
                                                                            spectra with diagnostic anions which enable precise identifica-
Fig. 6 (a)–(b) ESI(2)-MS/MS of the anion of m/z 143 from (a)                tion of Scotch or American whiskies. Counterfeit whisky, as
counterfeit and (b) Scotch whisky samples.                                  exemplified herein by samples commercialized in Brazil, are
                                                                            also easily characterized particularly for diagnostic anions
                                                                            arising from deprotonation of simple sugars. A second MS
                                                                            dimension of fingerprinting selectivity is obtained by acquiring
                                                                            ESI tandem mass spectra of diagnostic anions. Therefore,
                                                                            direct infusion ESI(2)-MS constitutes a rapid and reliable
                                                                            technique to typify whiskies, to probe authenticity, and to
                                                                            control its quality and maturation particularly at distilleries.
                                                                            These aspects will be discussed briefly in the following section.

                                                                            Chemical characteristics of whisky
                                                                            The effect of cask maturation may differ considerably for
                                                                            Scotch whisky and American bourbon as varying regulations
                                                                            are applied.31 This effect means that casks used for Scotch
                                                                            whisky gradually will reduce the amount of extractables and
                                                                            thus affect the flavour and character of the spirit. This
                                                                            circumstance may explain why heavier polar compounds in
                                                                            particular produced the diagnostic anion (m/z 487) for American
                                                                            whisky in comparison with Scotch whisky.
                                                                               Although visual inspection of the ESI-MS data seems to be
                                                                            highly effective, this may be regarded as a subjective classifica-
                                                                            tion approach. Hence, multivariate analysis can be applied to
                                                                            provide statistical separation of different types of whiskies.
                                                                            The American whisky is strongly correlated to a high number
                                                                            of negative anions, whereas anions of m/z 485, 255 and 179 are
                                                                            well correlated with counterfeit whisky. Furthermore, it is
                                                                            clear that the three anions of m/z 143, 171 and 199 are all
                                                                            characteristic for Scotch whisky but they are also present in
                                                                            counterfeit whisky. The ion of m/z 301 is present in all samples
                                                                            investigated and is therefore located in the centre of the
                                                                            chemometric plot shown in Fig. 7b.
                                                                               The component producing the negative anion of m/z 301 in
                                                                            all samples may be a polyphenolic component such as ellagic
Fig. 7 (a)–(b) D-PLS regression analysis of ESI(2)-MS data in
                                                                            acid (302 Da). The presence of such an acid has previously
relation to the three types of whisky investigated. Plot (a) shows scores
for principal components 1 and 2 for samples with names: A_1/2 5
                                                                            been identified in various distilled spirits32 and this may account
American whisky, Bb_1/2 5 counterfeit whisky, Ss_1–4 5 Scotch               for its detection in the counterfeit samples. Ellagic acid can
single malt and Sb_1–8 5 Scotch blended whisky. Plot (b) shows              act as a strong radical scavenger and as an effective
correlation loadings for principal components 1 and 2 with m/z values       antioxidant in alcoholic drinks,33 protecting the stomach
and whisky classes; BlendedS: blended Scotch; SingleMS: single malt         against oxidative stress.34,35
Scotch; location of American indicated with arrow.                             The appreciable amount of mono- and disaccharides found
                                                                            in the counterfeit whisky samples as revealed by the ions of m/z
higher degrees of significance than others. In contrast, the two            179 and 341 indicates the use of caramel to adjust colour and
kinds of Scotch whisky, blended or single malt, are character-              flavour. Significant amounts of monosaccharides have pre-
ized by being negatively correlated to these numerous ions of               viously been identified in both whiskies of low quality and in

This journal is ß The Royal Society of Chemistry 2005                                                    Analyst, 2005, 130, 890–897 | 895
American bourbon.36 Monosaccharides such as mannose identified. This combination will certainly enhance counterfeit
and xylose have been proposed to originate from the new detection. Additionally, we are confident that ESI-MS can
casks used in the maturation of American bourbon. provide a general fingerprinting method applicable not only to
Monosaccharides may also be present in genuine blended whisky but to many other fine alcoholic drinks that are subject
and malt whisky, but at low concentrations, owing to gradual to falsification, e.g. cognac and other liquors of high quality
release due to acid-catalysed hydrolysis of tannin from the such as cachaça. This generality is currently under investiga-
wood. The monosaccharide amount is an indication of the end tion in our laboratory.
of the required 3 year maturation period for genuine Scotch
whiskies.37 Thus, rapid and sensitive identification of traces of Conclusion
monosaccharides by ESI(2)-MS seems also to be a powerful
approach to monitor maturation stages of whisky. ESI-MS(/MS) fingerprinting provides a direct, simple, rapid,
sensitive, and highly selective method for origin and authen-
ESI-MS and whisky classification ticity certification of whisky samples. It is also likely to be
useful for product quality control and profile characterization
As already mentioned, over the years many methods have been particularly at distilleries. Another application with major
proposed to control quality or to classify whiskies.15–22 We benefits would certainly be demonstrated if ESI-MS profiles
envisage that ESI-MS and ESI-MS/MS particularly in the are found to correlate well with sensory profiles of samples of
negative ion mode are powerful techniques for quality control variable qualities.40
and for rapid, sensitive and selective investigation of many
attributes of various whisky types.
Acknowledgements
Previous analytical methods for authenticity analysis have
used higher-alcohol profiles for specific brands of Scotch We thank the Brazilian research foundations FAPESP and
whisky, and this has been found to be very consistent over CNPq for financial support. J.K.S. Møller also thanks the
many production batches. Therefore, gas chromatographic KVL International Committee at the Royal Veterinary and
(GC) determination of such alcohols together with the Agricultural University for providing financial support for his
presence of other specific congeners offers an effective but stay in Brazil.
more laborious and time consuming approach to authenticity
analysis.38 In addition, pyrolysis-MS combined with multi- Jens K. S. Møller,a Rodrigo R. Catharinob and Marcos N. Eberlin*b
a
Royal Veterinary and Agricultural University, Department of Food
variate analysis of the resulting mass spectra enable non- Science, Food Chemistry, Rolighedsvej 30, DK-1958 Frederiksberg C,
authentic samples to be discriminated from the authentic Denmark
b
product. Current standards of authenticity control in the Thomson Mass Spectrometry Laboratory, Institute of Chemistry, State
University of Campinas, UNICAMP, Campinas, SP 13083-970, Brazil.
industry of blended Scotch whisky is built around GC and is E-mail: eberlin@iqm.unicamp.br; Fax: +5519 3788 3073;
applied to analyse and quantify volatile congeners. Recently, a Tel: +5519 3788 3073
rapid but not so selective portable method (for detecting the
presence of peat or wood derived phenolic compounds and/or
References
colourant added to adjust final colour intensity) was proposed
for pin-pointing suspect whisky samples, based on UV/visible 1 http://www.scotch-whisky.org.uk.
2 J. R. Mosedale and J. L. Puech, Trends Food Sci. Technol., 1998, 9,
absorbance.39 Hence, direct ESI(2)-MS(/MS) fingerprinting of 95.
whisky samples nicely adds to the sophisticated portfolio of 3 B. Johnstone, New Sci., 1985, 108, 19.
analytical strategies available to probe whisky authenticity 4 K. Y. M. Lee, A. Paterson, J. R. Piggott and G. D. Richardson,
and quality control, offering clear advantages as a rapid, J. Inst. Brew., 2001, 107, 287.
5 A. J. Liebmann and B. Scherl, Ind. Eng. Chem., 1949, 41, 534.
simple, direct and highly selective alternative. Whereas the 6 M. C. Brockmann, J. Assoc. Off. Agric. Chem., 1950, 33, 127.
consistency of the ESI-MS method herein introduced is yet to 7 K. Kayahara, N. Aoyagi, I. Kawasaki and N. Miyachi, J. Ferment.
be verified over many production batches, the present results Technol., 1968, 46, 362.
point unequivocally towards superior performance. 8 M. J. Pro and A. D. Etienne, J. Assoc. Off. Agric. Chem., 1953, 36,
1150.
The use of GC, GC-MS, and UV/visible spectrophotometry 9 M. Lehtonen, Chromatographia, 1982, 16, 201.
for identifying the falsification of strong alcoholic beverages 10 K. Nishimur and M. Masuda, J. Food Sci., 1971, 36, 819.
(vodka, gin, cognac and whisky) has also been considered, 11 T. C. S. Dolan, J. Inst. Brew., 1976, 82, 177.
and these techniques in combination may be able to detect 12 J. H. Kahn and E. T. Blessing, J. Assoc. Off. Anal. Chem., 1972, 55,
549.
markers or impurities present in a certain ratio. Furthermore, 13 R. E. B. Duncan and J. M. Philp, J. Sci. Food Agric., 1966, 17, 208.
this multicomponent analysis applied to cognacs and related 14 M. Lehtonen and H. Suomalainen, Process Biochem., 1979, 14, 5.
liquors can reveal alcohol produced from non-grape raw 15 F. Jack, J. Inst. Brew., 2003, 109, 114.
materials or determine whether the cognac spirit has been in 16 T. Adam, E. Duthie and J. Feldmann, J. Inst. Brew., 2002, 108,
459.
contact with oak wood, plus how long this aging has lasted.21 17 D. Gonzalez-Arjona, V. Gonzalez-Gallero, F. Pablos and
In this context, the application of fast ESI-MS fingerprinting A. G. Gonzalez, Anal. Chim. Acta, 1999, 381, 257.
together with more elaborate GC(-MS) analysis will provide a 18 I. G. Parker, S. D. Kelly, M. Sharman, M. J. Dennis and D. Howie,
Food Chem., 1998, 63, 423.
wider picture of the components present in the whisky as both
19 J. Jaganathan and S. M. Dugar, J. AOAC Int., 1999, 82, 997.
the low molecular weight volatile compounds (by GC-MS) and 20 V. R. Kinton and L. Adam, Abstr. Pap. Am. Chem. Soc., 2002, 224,
the more polar or acidic components (by ESI-MS/MS) will be U90.
896 | Analyst, 2005, 130, 890–897 This journal is ß The Royal Society of Chemistry 200521 G. Fitzgerald, K. J. James, K. MacNamara and M. A. Stack, 31 J. R. Piggott, J. M. Conner, A. Paterson and J. Clyne, Int. J. Food J. Chromatogr., A, 2000, 896, 351. Sci. Technol., 1993, 28, 303. 22 K. J. G. Reid, J. S. Swan and C. S. Gutteridge, J. Anal. Appl. 32 D. M. Goldberg, B. Hoffman, J. Yang and G. Soleas, J. Agric. Pyrolysis, 1993, 25, 49. Food Chem., 1999, 47, 3978. 23 A. S. Araújo, L. L. da Rocha, D. M. Tomazela, A. C. H. F. Sawaya, 33 D. B. McPhail, P. T. Gardner, G. G. Duthie, G. M. Steele and R. R. Almeida, R. R. Catharino and M. N. Eberlin, Analyst, 2005, K. Reid, J. Agric. Food Chem., 1999, 47, 1937. 130, DOI: 10.1039/b415252b. 34 T. Iino, K. Nakahara, W. Miki, Y. Kiso, Y. Ogawa, S. Kato and 24 H. J. Cooper and A. G. Marshall, J. Agric. Food Chem., 2001, 49, K. Takeuchi, Digestion, 2001, 64, 214. 5710. 35 T. Iino, K. Tashima, M. Umeda, Y. Ogawa, M. Takeeda, 25 P. Mauri and P. Pietta, J. Pharm. Biomed. Anal., 2000, 23, 61. K. Takata and K. Takeuchi, Life Sci., 2002, 70, 1139. 26 A. C. H. F. Sawaya, D. M. Tomazela, I. B. S. Cunha, 36 K. Sato, F. Nakatsubo, K. Murakami and T. Hattori, Mokuzai V. S. Bankova, M. C. Marcucci, A. R. Custodio and Gakkaishi, 1992, 38, 608. M. N. Eberlin, Analyst, 2004, 129, 739. 37 K. Sato, F. Nakatsubo, H. Kawamoto and K. Murakami, 27 R. B. Cole, Electrospray Ionization Mass Spectroscopy, John Wiley Mokuzai Gakkaishi, 1994, 40, 846. & Sons Inc., New York, 1997. 38 R. I. Aylott, A. H. Clyne, A. P. Fox and D. A. Walker, Analyst, 28 H. Wold, Multivariate analysis: proceedings of an international 1994, 119, 1741. symposium, Academic Press, New York, 1966, pp 391–420. 39 W. M. MacKenzie and R. I. Aylott, Analyst, 2004, 129, 607. 29 H. Martens, Chemom. Intell. Lab. Syst., 2001, 58, 85. 40 M. N. Eberlin, D. M. Augusti, R. Augusti and R. Haddad, 30 B. K. Lavine and J. J. Workman, Anal. Chem., 2004, 76, 3365. submitted for publication. This journal is ß The Royal Society of Chemistry 2005 Analyst, 2005, 130, 890–897 | 897
You can also read