Spatial Analysis of Food and Waterborne Diseases in Sabah, Malaysia
←
→
Page content transcription
If your browser does not render page correctly, please read the page content below
Sains Malaysiana 49(7)(2020): 1627-1638
http://dx.doi.org/10.17576/jsm-2020-4907-14

          Spatial Analysis of Food and Waterborne Diseases in Sabah, Malaysia
                   (Analisis Reruang bagi Penyakit Bawaan Makanan dan Air di Sabah, Malaysia)

 S YED S HARIZMAN S YED A BDUL R AHIM*, S HAMSUL AZHAR S HAH, S HAHARUDIN IDRUS, Z AHIR I ZUAN A ZHAR,
                            M OHD R OHAIZAT H ASSAN & N AZARUDIN S AFIAN

                                                       ABSTRACT

Food and waterborne disease (FWBD) epidemic can produce devastating public health outcomes. From 1990 to 2006,
the annual notifications for FWBDs in Malaysia ranged from 2,000 to about 10,000 cases. The purpose of this study
was to describe the spatial epidemiology of FWBDs in four districts of Sabah from the year 2011 to 2014. This study
was a retrospective review of four years (i.e. 2011 to 2014) worth of data from Kota Kinabalu, Penampang,
Putatan, and Papar districts. All reported cases of cholera, dysentery, food poisoning, typhoid, and viral hepatitis A
from these areas and district health offices were included. Coordinates for the locations of the cases were based on
home addresses. Among a total of 1997 cases of FWBDs, food poisoning was the highest reported disease with 1787
(89.4%) cases. Kota Kinabalu had the most reported cases of FWBDs with 1368 (68.5%). In the year 2012, FWBD
incidence was the highest at 16.44 per 10,000 populations. Kernel density estimation demonstrated hot spots of food
poisoning and cholera in the western areas near the coast, while typhoid and viral hepatitis A cases had minimal
hot spots and appeared to be dispersed. Average nearest neighbour analysis showed clusters of food poisoning and
cholera cases. Further analysis with the nearest neighbour hierarchical spatial clustering presented 32 clusters of
food poisoning and 7 clusters of cholera. Food poisoning and cholera usually occur in clusters. From these findings,
it can be concluded that these areas, food poisoning, and cholera have significant spatial clustering and patterns.
Meanwhile, other FWBDs did not occur in clusters for this study. This indicates the possibility of under-reporting or real
dispersion of cases brought about by an efficient mechanism of spread from a common source.

Keywords: Cluster; foodborne; GIS; spatial analysis; waterborne

                                                        ABSTRAK

Epidemik penyakit bawaan makanan dan air (FWBD) boleh mengakibatkan masalah kesihatan awam. Dari tahun
1990 hingga 2006, dilaporkan bahawa bilangan kes tahunannya berada dalam lingkungan 2,000 hingga 10,000
kes. Tujuan kajian ini adalah untuk menghuraikan epidemilogi ruang bagi penyakit bawaan makanan dan air di
empat buah daerah di Sabah dari tahun 2011 hingga 2014. Sorotan retrospektif ini melibatkan data selama 4
tahun (2011 hingga 2014) yang dikutip daripada Kota Kinabalu, Penampang, Putatan dan Papar, Sabah. Semua kes
kolera, disentri, keracunan makanan, tifoid dan hepatitis A virus yang dilaporkan oleh pejabat kesihatan kawasan dan
daerah dikaji. Koordinat bagi lokasi kes adalah berdasarkan alamat rumah. Daripada sejumlah 1,997 kes FWBD,
keracunan makanan dilaporkan sebagai kes yang paling tinggi dengan 1,787 (89.4%) kes. Kota Kinabalu merekodkan
bilangan kes yang paling tinggi, iaitu 1,368 (68.5%). Bilangan kes FWBD adalah paling tinggi pada tahun 2012 dengan
catatan 16.44 per 10,000 populasi. Anggaran kepadatan Kernel menunjukkan bahawa kawasan yang mencatatkan kes
keracunan makanan dan kolera tertinggi adalah di bahagian barat berhampiran pantai. Kes-kes tifoid dan hepatitis
A virus tidak banyak dilaporkan di kebanyakan kawasan dan kelihatan berselerak. Analisis jiran terdekat purata
menunjukkan kelompok bagi kes-kes keracunan makanan dan kolera sahaja. Analisis lanjut melalui pengkelompokan
ruang hierarki jiran terdekat menunjukkan 32 kelompok bagi kes keracunan makanan dan 7 kelompok bagi kes kolera.
Keracunan makanan dan kolera biasanya berlaku secara berkelompok. Keputusan daripada kajian ini menunjukkan
kes keracunan makanan dan kolera mempunyai ciri-ciri kelompok dan corak reruang yang signifikan. Sementara
itu, penyakit bawaan makanan dan air lain bagi kajian ini tidak berlaku secara berkelompok. Ini mungkin disebabkan
terdapat kes yang tidak dilaporkan atau kes berselerak sahih berlaku dan merebak dengan cepat berasal daripada
punca yang sama.

Kata kunci: Analisis ruang; bawaan air; bawaan makanan; GIS; kelompok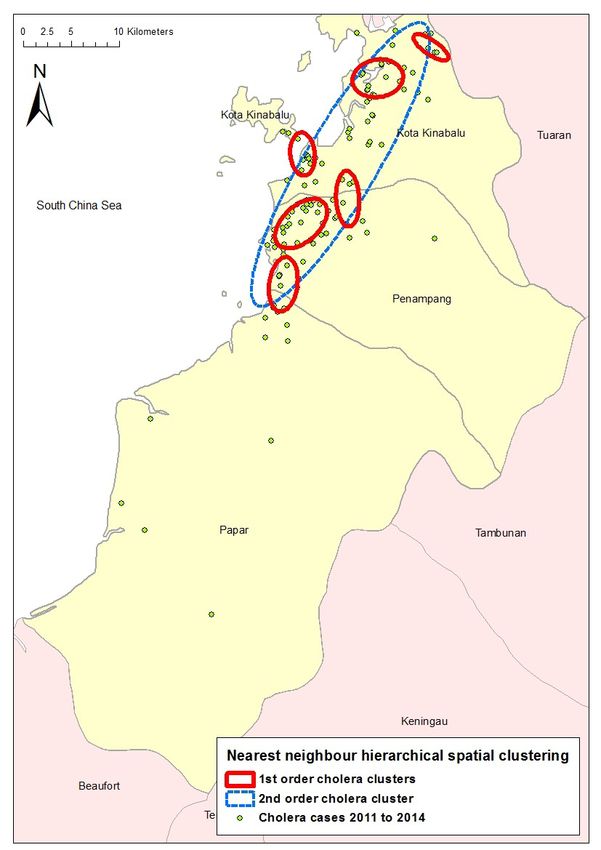
1628

                     I NTRODUCTION                             Health Offices were taken as samples, whereas the
                                                               coordinate system used was Rectified Skew Orthomorphic
The global number of food and water-borne diseases
                                                               (RSO) Timbalai 1948 Borneo (metres). Approval and
(FWBD) reported is largely unknown (Newell et al. 2010).
                                                               registration for this research were obtained from the
The FWBD epidemic can produce devastating health
                                                               Sabah State Health Department, Universiti Kebangsaan
outcomes in both developing and developed countries.
                                                               Malaysia (FF-2014-319), and the National Medical
In Malaysia, the annual notifications of FWBDs ranged
                                                               Research Register (NMRR-14-331-19140), Malaysia.
from 2000 to about 10,000 cases from 1990 to 2006
                                                                     Next, programs such as Statistical Package for the
(Ministry of Health 2006).
                                                               Social Sciences (SPSS) v20, ArcGIS v10, and CrimeStat
      Environmental factors such as climate, seasonality,
                                                               IV were used for data analysis and mapping. In particular,
temperature, and rainy seasons have shown relationships
                                                               five environmental features were analysed via a
and can thus manifest temporal variants (Carrel et al. 2009)
                                                               proximity analysis spanning 500 metres, which were the
Malaysia, in general and Sabah specifically is affected by
                                                               nearest market, sewage plant, municipal landfills, water
climate change, which is evident in situations that have
                                                               treatment plant, river, and coastline.
occurred such as floods, landslides, and tropical storms,
                                                                     Spatial analysis is a type of geographical analysis
which are attributed to the cyclical monsoon seasons.
                                                               which seeks to explain patterns of human behaviour and
Weather extremes such as storms, floods, and droughts
                                                               its spatial expression in terms of mathematics and
cause the emergence of climate-sensitive diseases from
                                                               geometry, that is, locational analysis (Esri 2013). Points
the contamination of water and environment (Alhoot et
                                                               and polyline were plotted and analysed accordingly based
al. 2016). In Malaysia and in particularly Sabah, the major
                                                               on the resulting FWBD diagnosis. Meanwhile, kernel
factor contributing to food and waterborne diseases is
                                                               function was used to create a smooth map of values
insanitary food handling procedures which accounted
                                                               from spatial data, which appeared like a spatially-based
for more than 50% of the poisoning episodes (Soon et
                                                               histogram. It depicted the level at each location along
al. 2011).
                                                               the map reflecting the point pattern intensity for the
      Spatial analysis has the potential for monitoring
                                                               surrounding area (Anselin et al. 2000). Next, the nearest
and managing FWBD surveillance. Its examples include
                                                               neighbourhood method was used to calculate the distance
interactive mapping, analysing dynamic changes for
                                                               to the nearest neighbour. The ratio is called the Nearest
transmission risk factors, and creating a framework
                                                               Neighbourhood Index. If the ratio is less than 1, the
for the disease management system. The current static or
                                                               observed distribution is clustered; if the ratio is larger than
pin map of disease distribution can be improved by using
                                                               1, it is dispersed (Esri 2013). In the nearest neighbour
dynamic disease mapping, which helps in making decisions,
                                                               hierarchical spatial clustering, clusters are identified and
illuminating the causes, and generating hypotheses of
                                                               put together based on two criteria, namely the threshold
the cause of disease. It is achievable via ecological or
                                                               distance and the minimum number of points that are
epidemiological risk assessment. For example, data of
                                                               close enough (Safian et al. 2008).
spatio-temporal changes and geographical statistical
correlation or interpretation can be used together (Abdul
Rauf & Abdul Malek 2012).                                                       RESULTS AND DISCUSSION
      This study is conducted in the four districts of         A total of 1997 cases of FWBDs were reported from the
Sabah, which are Kota Kinabalu, Penampang, Putatan,            four districts of Sabah from the year 2011 to 2014. The
and Papar. Sabah is one of the states in Malaysia located      highest age group was between 10 and 14 years old with
in the northernmost part of Borneo, recording a total          441 (10.4%) cases, while the female group had a slightly
population of 3,120,040 and an annual population growth        higher number of cases with 1094 (54.8%). The ethnic
rate of 1.7%. Its major ethnic groups are Kadazan/Dusun        group of Peribumi Sabah was the representation and
(17.9%), Bajau (14.0%), Chinese (9.1%), Malay (5.7%),          presented with 1421 (71.2%) cases. Meanwhile, in terms
Murut (3.3%), other Bumiputera (20.5%), and non-               of diagnosis, food poisoning was the highest reported
citizens (27.8%) (DOSM 2020). The purpose of this study        disease from all four districts with 1787 (89.4%) cases,
was to describe the spatial epidemiology of FWBDs in           whereas dysentery was the least reported with only 2
these four districts of Sabah from the year 2011 to 2014.      (0.1%) cases (Table 1). In an acute diarrhoea study done
                                                               locally, it was found that young adults had the highest
               MATERIALS AND METHODS                           incidence of acute diarrhoea, which could be attributed
This was a retrospective review and spatial analysis           to their lifestyle and eating habits as they were likely to
spanning over four years (i.e. 2011-2014) of data for          be single and more active. The same study also showed
FWBD s, which included cholera, dysentery, food                that Peribumi Sabah having the highest incidence of acute
poisoning, typhoid, and viral hepatitis A. The analysis        diarrhoea (Gurpreet et al. 2011). However, under five
included reported cases in the online disease notification     years of age, Bangladesh had the highest incidence of
system. All the reported cases from the Area and District      typhoid (Dewan et al. 2013). Part of the epidemiology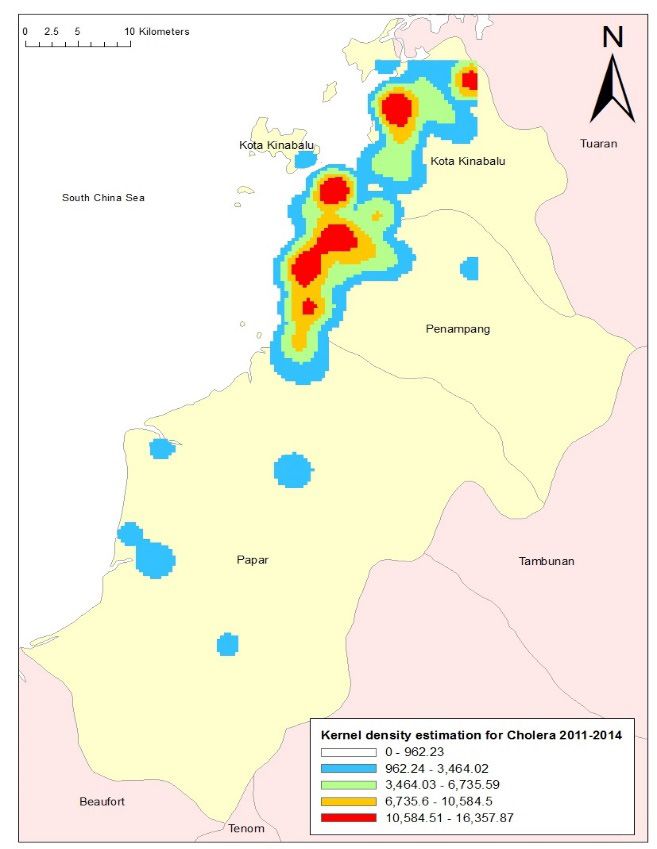
1629

of foodborne illness is tied to behavioural factors, socio-     water contamination and not as a result of a point-source
cultural practices, food choices and availability, consumer     spread. The lack of spatial clustering helped to formulate
and societal attitudes towards food, and food preparation       the hypothesis that the outbreak could have been due
practices (Tam 2008).                                           to the contamination of water supply to the entire area
      Kota Kinabalu District, which is the most populated       (Sowmyanarayanan et al. 2008).
among the four districts, had the highest number of                   In this study, too few dysentery cases were reported
reported cases with 1368 (68.5%) cases of FWBDs from            and thus no clusters were detected. However, in China,
the year 2011 to 2014. In contrast, Putatan had the least       the fluctuations of Shigella clusters found had caused
reported cases with 166 (8.3%). In terms of the year,           food poisoning and dysentery (Tang et al. 2014). The
FWBDs were highest reported in the year 2012 with 622           incidence of dysentery in an urban area can be attributed
(31.1%) cases, while 2011 showed the lowest amount of           to poor hygiene. Furthermore, such cases are influenced
reported cases with 380 (19.0%) cases. The highest FWBD         by meteorological factors such as a rise in temperature
incidence was in 2012 with 16.44 per 10,000 population.         and relative humidity, which will increase the incidence
      Table 2 shows the association between the outbreak        of cases; these findings should be considered in relevant
and sporadic cases of food and waterborne cases in the          prevention and control programmes (Li et al. 2015).
four districts of Sabah from 2011 to 2014. A significant              In 2011, only Kota Kinabalu and Papar illustrated
difference was seen in the outbreak and sporadic cases          food poisoning clusters. Between the year 2012 and
by district (χ2= 233.355, p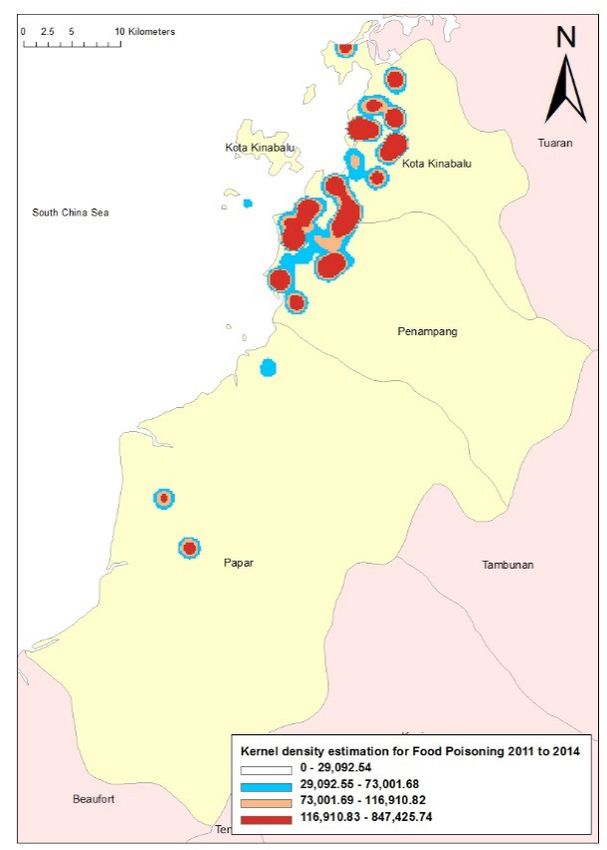
1630
poisoning, 43 cholera points, 6 typhoid points, 2 viral these areas to have a clustering of FWBD cases, which
hepatitis A points, and 1 dysentery point within 500 were associated with the shortage of safe drinking water
metres near a river and coastline (Table 4). Pathogen and poor sanitation (Kazembe et al. 2009). Besides,
contamination is a major cause of stream impairments, adequate facilities and infrastructures, which include
making it a major health risk (Pandey et al. 2014). safe water access and sanitation, are needed to avoid
Persistent and heavy rainfall may affect the health in pathogens that are causing diarrhoea (Zuckerman et al.
areas near rivers when flooding occurs, as it increases the 2007).
risks of infectious diarrhoea in the affected areas (Ding Cholera had seven clusters; of those, six were first-
et al. 2013). A close affiliation was found between the order and one was a second-order cluster (Figure 6).
health condition and viral contamination of wastewater Cholera could be observed in areas with higher population
product effluents, and consequently, the surface water density and might be due to the increased density of
contamination (Prevost et al. 2015). refuse dumps and breakdown of sanitation, which led to
Nearest neighbour hierarchical clustering analysis a higher risk of cholera in a particular area (Kanungo et
was used with a pair of points by a chance of 0.50, 10 al. 2012). Meanwhile, isolated clusters of high cholera
minimum points per cluster, and 1 standard deviation. incidence may be attributed to poor hygiene practice in
There were no clusters identified for typhoid, viral the community. Next, endemic cholera may occur when
hepatitis A, and dysentery, while the typhoid cases did its reservoirs are readily available in coastal areas and
not show spatial clustering. This finding conflicts with the sea (Ali et al. 2006). Temporal seasons, which cause
other study findings. For example, a typhoid study in optimal taking in of nutrient and sunlight, are the best
Kelantan showed that typhoid usually occurred in clusters conditions for plankton growth (Abdul Rauf et al. 2011).
and each case usually occurred near other cases as the Cholera distribution is influenced by the temperature,
causative agent would be present in the surrounding precipitation, elevation, distance to the coastline, and
area (Safian et al. 2008). Clusters of typhoid are also oceanic environmental factors, such as sea surface
influenced by the environment, such as a change in the temperature, sea surface height, and ocean chlorophyll
temperature, rainfall, and river level (Dewan et al. 2013). concentration. With this information, a forecast using
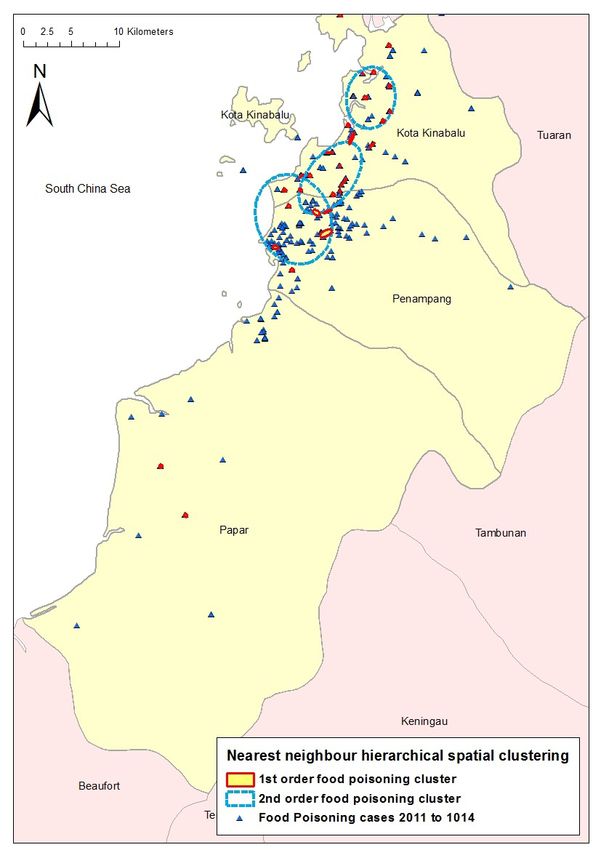
Food poisoning had a total of 32 clusters; of those, GIS can offer great prospects as a forewarning method
29 were first-order and 3 were second-order clusters for cholera (Xu et al. 2015).
(Figure 5). The findings in this study exhibited significant This study is not without its limitations; when
clustering of cases in food poisoning in which some using surveillance data, there is the possibility of under-
clusters were also found in villages and squatter areas. reporting of FWBD cases. Furthermore, this study did not
Similar spatial studies were done before to demonstrate include climate factors in the analysis.
TABLE 1. Patient characteristics of FWBDs from 2011 to 2014 in Kota Kinabalu, Penampang, Putatan, and
Papar, Sabah
Characteristics n (%) N = 1997
Age
Under 1 year old 8 (0.4)
1 to 4 years old 60 (3.0)
5 to 9 years old 208 (10.4)
10 to 14 years old 441 (22.1)
15 to 19 years old 431 (21.6)
20 to 24 years old 330 (16.5)
25 to 29 years old 146 (7.3)
30 to 34 years old 91 (4.6)
35 to 39 years old 74 (3.7)
40 to 44 years old 65 (3.3)
45 to 49 years old 58 (2.9)
50 to 54 years old 28 (1.4)
55 to 59 years old 23 (1.2)
60 to 64 years old 15 (0.8)
65 years and above 19 (1.0)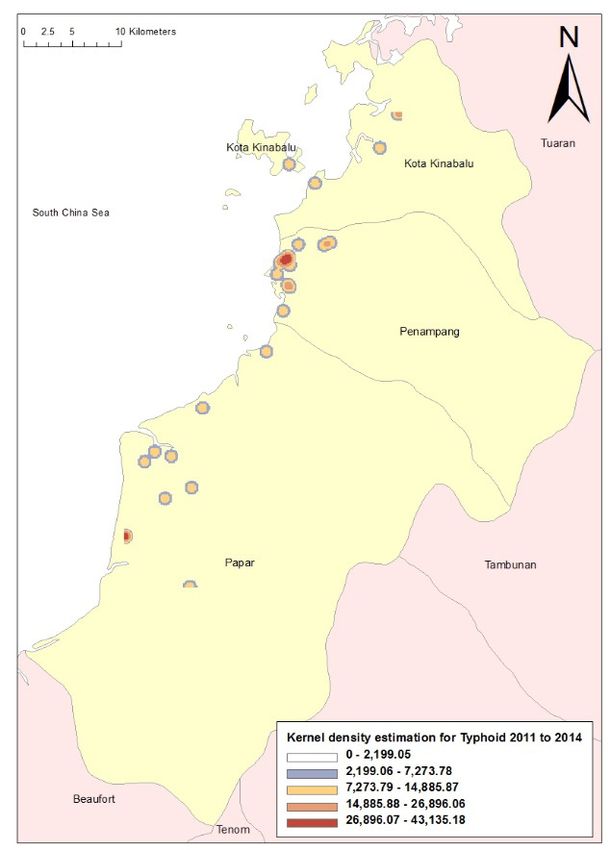
1631
Characteristics                                                           n (%) N = 1997

Gender
Male                                                                        903 (45.2)
Female                                                                     1094 (54.8)

Ethnic
Malay                                                                       182 (9.1)
Chinese                                                                     154 (7.7)
Indian                                                                       10 (0.5)
Peribumi Sabah                                                             1421 (71.2)
Peribumi Sarawak                                                             31 (1.6)
Others                                                                       51 (2.6)
Non Malaysian                                                               148 (7.4)

Diagnosis
Food poisoning                                                             1787 (89.4)
Cholera                                                                     162 (8.1)
Typhoid                                                                      29 (1.5)
Viral Hepatitis A                                                            17 (0.9)
Dysentery                                                                     2 (0.1)

   TABLE 2. Chi-square test between outbreak and sporadic cases of food and waterborne cases in the four
                                   districts of Sabah from 2011 to 2014

Variables                           Outbreak                Sporadic               χ2            p-value
                                    N= 1701                 N= 296
                                     n (%)                   n (%)

Gender                                                                            0.820           0.365
Male                                762(84.4)              141(15.6)
Female                              939(85.8)              155(14.2)

District                                                                        233.355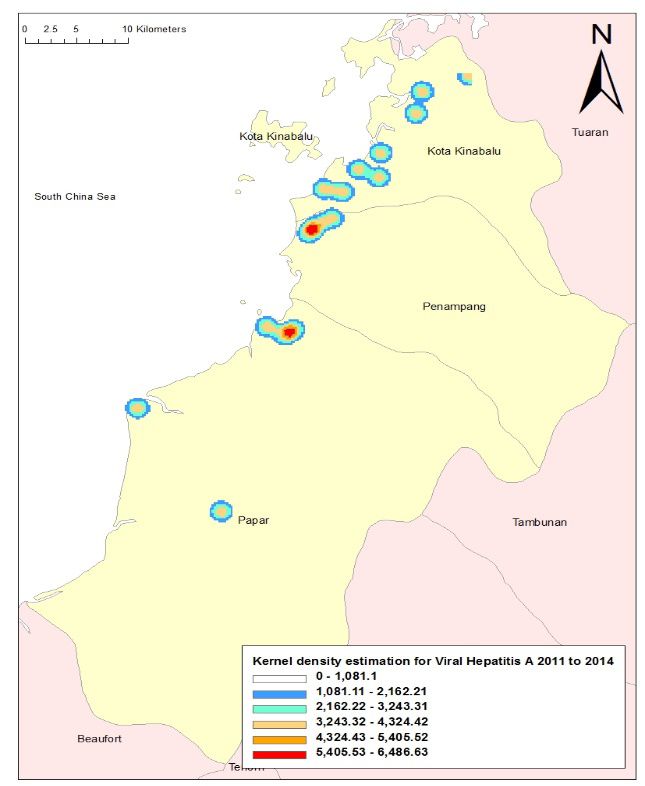
1632

               Age                                                                                                             249.628
1633
TABLE 4. Proximity analysis in the range of 500 metres near environmental features
River and
Diagnosis Market Sewage plant Municipal landfill Water treatment plant
coastline
Food poisoning 4 2 0 1 37
Cholera 4 1 0 0 43
Typhoid 1 1 0 0 6
Viral Hepatitis A 0 0 0 0 2
Dysentery 0 0 0 0 1
Putatan
FIGURE 1. Kernel density estimation of reported food poisoning in the
four districts of Sabah from 2011 to 20141634
FIGURE 2. Kernel density estimation of reported cholera in the four
districts of Sabah from 2011 to 2014
FIGURE 3. Kernel density estimation of reported typhoid in the four
districts of Sabah from 2011 to 20141635
FIGURE 4. Kernel density estimation of reported viral hepatitis A in the
four districts of Sabah from 2011 to 2014
FIGURE 5. Nearest neighbour hierarchical spatial clustering analysis of food
poisoning cases in the four districts of Sabah from 2011 to 20141636
FIGURE 6. Nearest neighbour hierarchical spatial clustering analysis of
cholera cases in the four districts of Sabah from 2011 to 2014
CONCLUSION REFERENCES
From these findings, one could conclude that for Abdul Rauf Abdul Rasam & Abdul Malek Mohd Noor 2012.
these particular areas, food poisoning and cholera had Contribution of GIS and remote sensing technologies for
significant spatial clustering and patterns. However, other managing foodborne diseases in Malaysia. IEEE Control
food water-borne diseases did not occur in clusters. This and System Graduate Research Colloqiuium. pp. 258-261.
could mean that the real cases and burden were either not Abdul Rauf Abdul Rasam, Abdul Malek Mohd Noor, Norazah
captured and there is under-reporting, or these were the Ahmad & Rosmadi Ghazali. 2011. MyGeoHealth: GIS-
based cholera transmission risk system in Sabah, Malaysia.
real dispersion of cases, which was brought about by an
IEEE 7th International Colloquium on Signal Processing
efficient mechanism of spread from a common source. and its Applications. pp. 474-479.
Alhoot, M.A., Tong, W.T., Low, W.L. & Sekaran, S.D. 2016.
ACKNOWLEDGEMENTS Climate change and health: The Malaysia scenario. In Climate
Change and Human Health Scenario in South and Southeast
We would like to thank the Director-General of Health
Asia. Advances in Asian Human-Environmental Research,
Malaysia for his permission to publish this article. The edited by Akhtar R. Springer, Cham. pp. 243-268.
authors would also like to express our gratitude to the Ali, M., Goovaerts, P., Nazia, N., Haq, M.Z., Yunus, M. & Emch,
Sabah State Health Department, particularly Kota M. 2006. Application of poisson kriging to the mapping
Kinabalu Area Health Office, Penampang Area Health of cholera and dysentery incidence in an endemic area of
Office, Papar Area Health Office and Putatan District Bangladesh. International Journal of Health Geographics
Health Office. 5(1): 45.1637
Anselin, L., Cohen, J., Cook, D., Gorr, W. & Tita, G. 2000. Spatial Kane, A., Sprong, H., Opsteegh, M., Langelar, M., Threfall,
analyses of crime. Criminal Justice 4: 213-262. J., Scheutz, F., Giessen, J.V.D. & Kruse, H. 2010. Food-
Asao, T., Kumeda, Y., Kawai, T., Shibata, T., Oda, H., Haruki, K., borne diseases - the challenges of 20 years ago still persist
Nakazawa, H. & Kozaki, S. 2003. An extensive outbreak of while new ones continue to emerge. International Journal
staphylococcal food poisoning due to low-fat milk in Japan: of Food Microbiology 139(2010): S3-S15.
Estimation of enterotoxin A in the incriminated milk and Pandey, P.K., Kass, P.H., Soupir, M.L., Biswas, S. & Singh,
powdered skim milk. Epidemiology and Infection 130(1): V.P. 2014. Contamination of water resources by pathogenic
33-40. bacteria. AMB Express 4(1): 51.
Carrel, M., Emch, M., Streatfield, P.K. & Yunus, M. 2009. Pardhan-Ali, A., Berke, O., Wilson, J., Edge, V.L., Furgal,
Spatio-temporal clustering of cholera: The impact of flood C., Reid-Smith, R., Santos, M. & McEwen, S.A. 2012. A
control in matlab, Bangladesh, 1983-2003. Health & Place spatial and temporal analysis of notifiable gastrointestinal
15(3): 741-752. illness in the Northwest territories, Canada, 1991-2008.
Dewan, A.M., Corner, R., Hashizume, M. & Ongee, E.T. 2013. International Journal of Health Geographics 11(1): 17.
Typhoid fever and its association with environmental Prevost, B., Lucas, F.S., Goncalves, A., Richard, F., Moulin, L.
factors in the Dhaka metropolitan area of Bangladesh: A & Wurtzer, S. 2015. Large scale survey of enteric viruses
spatial and time-series approach. PLoS Neglected Tropical in river and waste water underlines the health status of
Diseases 7(1): 12-15. the local population. Environment International 79: 42-50.
Ding, G., Zhang, Y., Gao, L., Ma, W., Li, X., Liu, J., Liu, Q. & Soon, J.M., Singh, H. & Baines, R. 2011. Foodborne diseases
Jiang, B. 2013. Quantitative analysis of burden of infectious in Malaysia: A review. Food Control 22(6): 823-830.
diarrhea associated with floods in Northwest of Anhui Sowmyanarayanan, T.V., Mukhopadhya, A., Gladstone, B.P.,
province, China: A mixed method evaluation. PloS ONE Sarkar, R. & Kang, G. 2008. Investigation of a hepatitis A
8(6): e65112. outbreak in children in an urban slum in Vellore, Tamil Nadu,
DOSM . 2020. Department of Statistics Malaysia Official using Geographic Information Systems. Indian Journal of
Portal. https://www.dosm.gov.my/v1/index.php?r=column/ Medical Research 128(1): 32-37.
cone&menu_id=dTZ0K2o4YXgrSDRtaEJyVmZ1R2h5 Tam, C.C. 2008. Fortune and foreigners: Toward an epidemiology
dz09. of food (borne illness). Epidemiology 19(2): 291-293.
Esri. 2013. ArcGIS Help 10.1 - Resource Center. http://resources. Tang, F., Cheng, Y., Bao, C., Hu, J., Liu, W., Liang, Q., Wu, Y.,
arcgis.com/en/help/main/10.1/index.html#/Welcome_to_the_ Norris, J., Peng, Z., Yu, R., Shen, H. & Chen, F. 2014. Spatio-
ArcGIS_Help_Library/00qn0000001p000000/. temporal trends and risk factors for Shigella from 2001 to
Gurpreet, K., Tee, G.H., Amal, N.M., Paramesarvathy, R. & 2011 in Jiangsu Province, People’s Republic of China. PloS
Karuthan, C. 2011. Incidence and determinants of acute ONE 9(1): e83487.
diarrhoea in Malaysia: A population-based study. Journal of Xu, M., Cao, C.X., Wang, D.C., Kan, B., Xu, Y.F., Ni, X.L. &
Health, Population and Nutrition 29(2): 103-112. Zhu, Z.C. 2016. Environmental factor analysis of cholera
Hart, A., McCulloch, B., Harper, C., Gardiner, N., Rutherford, S., in China using remote sensing and geographical information
Baker, P. & O’Sullivan, D. 2005. Report on GIS and Public systems. Epidemiology and Infection 144(5): 940-951.
Health Spatial Applications. Brisbane: Queensland Health. Zuckerman, J.N., Rombo, L. & Fisch, A. 2007. The true burden
Kanungo, S., Sur, D., Ali, M., You, Y.A., Pal, D., Manna, B., and risk of cholera: Implications for prevention and control.
Niyogi, S.K., Sarkar, B., Bhattacharya, S.K., Clemens, J.D. The Lancet Infectious Diseases 7(8): 521-530.
& Nair, G.B. 2012. Clinical, epidemiological and spatial
characteristics of Vibrio parahaemolyticus diarrhea and Syed Sharizman Syed Abdul Rahim*
cholera in the urban slums of Kolkata, India. BMC Public Department of Community and Family Medicine
Health 12(1): 830. Faculty of Medicine and Health Sciences
Kazembe, L.N., Muula, A.S. & Simoonga, C. 2009. Joint spatial Universiti Malaysia Sabah
modelling of common morbidities of childhood fever and 88400 Kota Kinabalu, Sabah
diarrhoea in Malawi. Health & Place 15(1): 165-172. Malaysia
Kistemann, T., Dangendorf, F., Krizek, L., Sahl, H.G., Engelhart,
S. & Exner, M. 2000. GIS-supported investigation of a Shamsul Azhar Shah, Mohd Rohaizat Hassan & Nazarudin Safian
nosocomial Salmonella outbreak. International Journal of Department of Community Health
Hygiene and Environmental Health 203(2): 117-126. Faculty of Medicine
Li, Z.J., Zhang, X.J., Hou, X.X., Xu, S., Zhang, J.S., Song, Universiti Kebangsaan Malaysia
H.B. & Lin, H.L. 2015. Nonlinear and threshold of the 56000 Bandar Tun Razak, Cheras
association between meteorological factors and bacillary Kuala Lumpur, Wilayah Persekutuan
dysentery in Beijing, China. Epidemiology and Infection Malaysia
143(16): 3510-3519.
Ministry of Health. 2006. Garis Panduan Pengurusan Wabak Shaharudin Idrus
Kolera. 2nd ed. Putrajaya: Ministry of Health. Institute for Environmental and Development
Nazarudin, S., Shah, S.A., Idrus, S. & Hamzah, W.M. 2008. Universiti Kebangsaan Malaysia
Cluster analysis of typhoid cases in Kota Bharu, Kelantan, 43600 UKM Bangi, Selangor Darul Ehsan
Malaysia. Medical Journal of Indonesia 17(3): 175-182. Malaysia
Newell, D.G., Koopmans, M., Verhoef, L., Duizer, E., Aidara-1638 Zahir Izuan Azhar *Corresponding author; email: syedsharizman@gmail.com Department of Population Health and Preventive Medicine Faculty of Medicine Received: 15 February 2019 Universiti Teknologi MARA (UiTM) Accepted: 6 March 2020 47000 Sungai Buloh, Selangor Darul Ehsan Malaysia
You can also read