Modeling of drying characteristics of pomelo (Citrus Maxima) peel - DergiPark
←
→
Page content transcription
If your browser does not render page correctly, please read the page content below
www.dergipark.gov.tr
                                                             ISSN:2148-3736
                                                   El-Cezerî Fen ve Mühendislik Dergisi
                                                            Cilt: 7, No: 1, 2020 (198-210)

                                              El-Cezerî Journal of Science and Engineering
                                                            Vol: 7, No: 1, 2020 (198-210)
                                                                                                                       ECJSE
                                                              DOI : 10.31202/ecjse.616497

                                                          Research Paper / Makale

             Modeling of drying characteristics of pomelo (Citrus Maxima) peel
                                 Azim Doğuş TUNCER1,2,*, Hande Özge GÜLER3, Hüseyin USTA4
       1
        Burdur Mehmet Akif Ersoy University, Faculty of Engineering-Architecture, Energy Systems Engineering
                                              Department, Burdur, Turkey
                        2
                          Gazi University, Natural and Applied Science Institute, Ankara, Turkey
      3
       Burdur Mehmet Akif Ersoy University, Faculty of Engineering-Architecture, Food Engineering Department,
                                                     Burdur, Turkey
          4
            Gazi University, Faculty of Technology, Energy Systems Engineering Department, Ankara, Turkey
                                                azimdtuncer@gmail.com

                     Received/Geliş: 06.09.2019                         Accepted/Kabul: 03.12.2019
    Abstract: Drying is a technique frequently used for agricultural food products to preserve them in long time
    periods. In this work, drying characteristics of Pomelo fruit (Citrus Maxima) peel for different drying techniques
    as microwave drying (MW), forced convection drying (FC) and freeze drying (FD) were determined.
    Experiments were conducted for two slab thicknesses (1 cm and 0.5 cm) in albedo part of the fruit peel. In
    addition, activation energy and effective diffusivity values also color properties were calculated for different
    drying techniques in both sizes. For FC, MW, and FD, drying times were determined as 34 min, 24 min, 410 min
    for thin slabs and 44 min, 30 min and 540 min for thick slabs, respectively. 0.5 cm thick peels had lower
    moisture content in a shorter drying period and when the slice thickness was reduced, the drying rate was
    increased nearly by 25%. By mathematical modelling with 11 different thin layer models, the best fitted kinetics
    models were found as Logarithmic, Diffusion Approach and Modified Henderson & Pabis models. At constant
    thickness, the highest effective diffusivity values were determined for the MW drying (1.925x10 -8 for thin slab,
    7.295x10⁻⁸ for thick slab). As for the color measurements, L*, a*, b* values generally have significant
    differences from fresh pomelo peel samples that the closest values to the fresh samples were obtained from
    freeze drying experiment.
     Keywords: Pomelo peel, freeze drying, modeling, color change.,

      Pomelo (Citrus Maxima) Kabuğu Kuruma Karakteristiğinin Modellenmesi
    Öz: Kurutma, özellikle tarım ürünlerinin uzun süreli muhafazasında yaygın olarak kullanılan bir yöntemdir. Bu
    çalışmada, zorlanmış taşınımla kurutma (FC), dondurularak kurutma (FD) ve mikrodalga kurutma (MW)
    tekniklerinin iki farklı ürün kalınlığında (1 cm ve 0,5 cm) pomelo meyvesi (Citrus Maxima) kabuğunun kurutma
    özellikleri üzerine etkileri incelenmiştir. Ayrıca, aktivasyon enerjisi, etkin difüzivite değerleri ve renk özellikleri
    de her iki boyutta farklı kurutma teknikleri için hesaplanmıştır. Kabukların kuruma süresi MC, FC ve FCD
    yöntemlerine göre ince örnekler için sırasıyla 24 dakika, 34 dakika, 410 dakika, kalın örnekler için ise sırasıyla
    30 dakika, 44 dakika ve 540 dakika olarak hesaplanmıştır. 0,5 cm kalınlığındaki örnekler daha kısa bir kuruma
    süresinde daha düşük nem içeriğine ulaşmış, dilim kalınlığı azaldığında kurutma hızı yaklaşık %25 artmıştır. 11
    farklı ince tabaka modeli ile matematiksel modellemede en uygun kinetik modeller Logaritmik, Difüzyon
    Yaklaşım ve Modifiye Henderson ve Pabis modelleri olarak belirlenmiştir. Sabit kalınlıkta en yüksek etkin
    difüzivite değerleri MW için belirlenmiştir (ince dilim için 1,925x10 -8, kalın dilim için 7,295          10-8). Renk
    ölçümleri sonucunda, L*, a*, b* değerlerinin taze pomelo kabuğu numunelerinden önemli ölçüde farklı olduğu
    saptanmış, taze ürüne en yakın renk değerleri ise dondurarak kurutma yöntemiyle elde edilmiştir.
     Anahtar kelimeler: Pomelo kabuğu, dondurarak kurutma, modelleme, renk değişimi.

How to cite this article
Tuncer, A.D., Güler, H.Ö., Usta, H., “Modeling of drying characteristics of pomelo (Citrus Maxima) peel”, El-Cezerî Journal of Science and Engineering, 2020, 7 (1);
198-210.
Bu makaleye atıf yapmak için
Tuncer, A.D., Güler, H.Ö., Usta, H., “Pomelo (Citrus Maxima) kabuğu kuruma karakteristiğinin modellenmesi”, El-Cezerî Fen ve Mühendislik Dergisi 2020, 7 (1);
198-210.
Tuncer, A.D., Güler, H.Ö., Usta, H. ECJSE 2020 (1) 198-210
1. Introduction
Pomelo fruit (Citrus Maxima) is one of the largest and most preferred species in the Rutaceae
(Citrus) family, due to its nutritional value and special taste. Pomelo fruit is usually consumed as
fresh fruit or fruit juice which can be used in various alcoholic and non-alcoholic beverages; or the
peel of this fruit can be sugared. There is also medical use due to its beneficial effects on health [1].
The citrus family by-products have potential to be used as ingredient in functional healthy foods
and also good sources of pectin, flavonoids and antioxidants which make them beneficial to health
and contribute some functional and technological properties [2-4]. Besides their dietary fiber and
low-calorie content, citrus fruits are determined to well-fermentable in colon with high water
holding capacities [5]. Citrus peel generally divided into two parts as albedo and flavedo which are
the inner and outer parts, respectively. Albedo part constitute nearly 30% of the total weight and is
characterized with its spongy and porous tissue. Despite the exploited benefits of this fruit, the peel
is generally discarded and may lead to some environmental problems [3]. It should be taken into
consideration that these high number of by-products may be utilized in some useful industrial
applications.
Food products rapidly begin to deteriorate after harvesting because of their respiratory activities.
There are many ways to enhance the durability of the harvested crops, as drying, which is one of the
earliest preservation methods that lowered the moisture content to a certain level and preserving
technological, microbial and nutritional values of the product. The main goal of this method is to
decrease or remove the free water, stop or limit the biochemical and microbial reactions, also to
preserve food products from deteriorating for extensive time intervals [6-7]. Freeze drying is based
upon the removal of moisture from the frozen sample by sublimation. This technique is an
extensively used process to get well-qualified and valuable dehydrated agricultural products but it
has low dehydration rates which increase the expenses and slow down the process [8]. Like forced
convection and freeze drying, microwave drying has been one of the most popular drying methods,
recently. In this method the main principle is conversion of the thermal energy to the
electromagnetic energy by affecting the polar molecules and water evaporation rates. This method
reduces the drying time up to 50% which the significant energy savings are provided [9-10]. In thin
layer drying, the samples which subjected to drying medium is placed as a thin layer. There are
many of experimental, semi-experimental and theoretical models that introduce the drying
characteristics of food products [11-16]. The mathematical modelling of the drying curves is
essential to increase the efficiency of the systems [17].
Although several studies on pomelo fruit drying have been taken part in literature, there is limited
information exists which the influences of various drying techniques on thin layer kinetics and the
color properties of pomelo fruit peels were examined. The main purposes of this study are i)
determination of the moisture ratios, moisture contents and drying rates of pomelo peels for two
different thicknesses and three different drying techniques as MW, FC and FD ii) estimation of
experimentally obtained drying data with 11 different drying models and choosing the most
compatible model with the experimental results iii) comparison of the color properties for dried
samples peel and selection of the most suitable method in terms of color changes iv) observation of
the activation energy and effective moisture diffusivities and comparison for each drying condition.
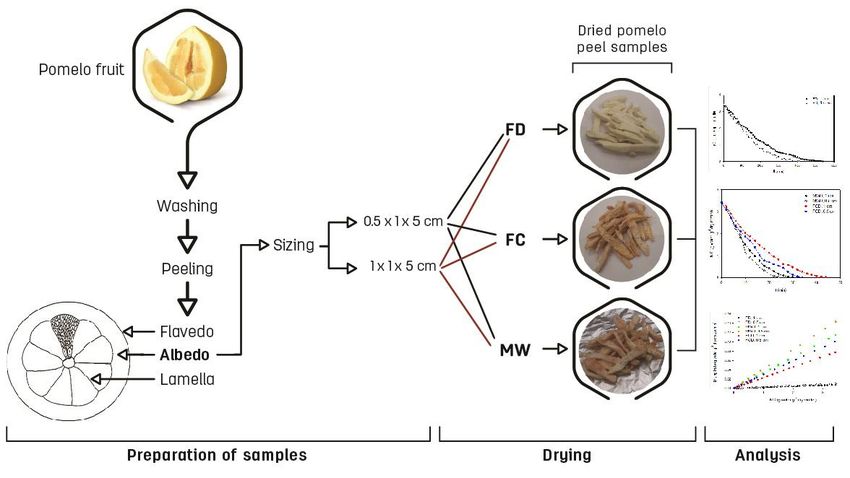
The framework of this study is schematically given in Fig. 1.
2. Materials and methods
2.1. Experimental setup
In this work, pomelo peels were dried by FD, MW and FC methods. Experiments were carried out
in Ankara Province, Turkey. The FD process was performed with a freeze dryer (Biobase-
199ECJSE 2020 (1) 198-210 Modeling of drying characteristics of pomelo (Citrus Maxima)
Biodustry, BK-FD12, China) and FC drying was performed with a convective dryer (JT 369/SL,
Whirlpool Corp, Benton Harbor, MI). The loss of the sample weight with time was measured with a
digital balance (XS6002S, Mettler Toledo model Excellence, USA) located in the center of drying
medium which had a capacity and accuracy of 6100±0.01 g.
Figure 1. The framework of the study.
2.2. Preparation of pomelo peel samples and drying
Fresh pomelo fruit was taken from a local market in Ankara, Turkey. The samples then washed and
the spongy albedo part of the peel was removed which cut into 5x1x0.5 cm and 5x1x1 cm slabs as
length x width x thickness. Before the experiment, pomelo peel samples were divided into equal
amounts of 50 g each for three different drying methods. Peels which are subjected to FD were
frozen in deep freezer (UĞUR deep-freezer, UDD 300-BK) at -30±1°C. The mass measurements
were conducted at 10 min intervals with a digital balance inside the drying chamber for FD. MW
and FC experiments was performed at 350 W constant power, and at 90°C constant temperature
values, respectively. In MW and FC, mass measurements were made every 2 min. Pomelo peels
were dried from 3.43±0.02 g water g-1 dry matter to 0.02±0.003 g water g-1 dry matter which the
difference of two measurements was less than about 1%. The rate of drying, moisture ratio and
average moisture content values of drying process were determined for each method as three times.
Moisture ratio (MR) value was calculated from the obtained experimental moisture content values.
MR is typically defined by Eq. 1:
(1)
The drying rate of pomelo peel samples were determined through Eq. 2:
(2)
Which MR is the dimensionless fractional moisture content, M e and M0 are the equilibrium and
initial moisture content values (g water g-1 dry matter); Mt and Mt+dt are the moisture content of the
product at time t and t+dt (g water g-1 dry matter), respectively, and t represents the drying time
(min).
200Tuncer, A.D., Güler, H.Ö., Usta, H. ECJSE 2020 (1) 198-210
2.3. Determination of the activation energy and the effective moisture diffusivity
Food drying processes usually contains different periods as constant and followed falling rate
period. In falling rate period the moisture movement of a hygroscopic solid is stated with diffusion
model [18]. Fick’s second law of diffusion may be used to determine the drying rate theoretically
and sufficiently commentate the drying data obtained from experiments (Eq. 3):
(3)
In the equation, Deff represents the effective moisture diffusivity (m2 s-1), t represents the drying
time (s), and x is the diffusion path (m). During the calculations the shape of pomelo peels were
assumed as infinite slab for simplify the calculations. Equation (4) is obtained when one-
dimensional mass transfer was assumed as major mechanism occured in the slab geometry. Also
these conditions were assumed:
Moisture was uniformly distributed inside the peels at the beginning of drying,
Diffusion coefficient was constant,
Outer resistance to moisture transfer, also shrinkage was not significant [19-20].
When long drying times are concerned, the first term can be taken into consideration by itself and
the equation is formed as Eq. 5:
(4)
(5)
In the equation L expresses the half-thickness of peel assumed as slab (m). So as to determine the
Deff value, the drying time dependent change of the ln (MR) values are plotted graphically and Deff
value achieved via the straight line slope.
Activation energy value can be determined according to Arrhenius equation (Eq. 6) since the
effective diffusivity (Deff) shows an exponential change with temperature as follow:
(6)
Which R and Ea represent the universal gas constant (8.314 J mol-1 K-1) and the activation energy
(kJ mol-1), respectively. Also, D0 represents the reference diffusion coefficient (m2 s-1) and Tabs was
the absolute temperature (K) [21]. The Ea parameter can be estimated via the slope of the ln(Deff)
versus T-1 graph.
Since the ambient temperature does not change and can not be measured in microwave dryer it is
not possible to mention a temperature value. Instead, the use of equations that define the relation
between the MD force values and the diffusion coefficient (Eq. 7) has also started to appear in the
literature [22]:
(7)
Which m and W represent the weight of the dried sample (g) and level of the MW power,
respectively.
201ECJSE 2020 (1) 198-210 Modeling of drying characteristics of pomelo (Citrus Maxima)
2.4. Determination of the thin layer characteristics
In this study, widely used 11 different semi-theoretical thin layer equations which are mostly used
in the literature were selected and stated in Table 1. The drying kinetics of the peels were modeled
by testing the compatibility of the pomelo peel samples with these equations and the experimental
drying results. Then, the most suitable model among eleven different models for each drying
methods and thickness were determined.
Table 1. Mathematical thin layer drying models*
Model Model Equation Reference
Lewis MR= [23]
Page MR= [24]
Modified Page MR= [25]
Henderson and Pabis MR = [26]
[27]
Modified Henderson & Pabis MR =
Midilli MR = [11]
Logarithmic MR = [28]
Two Term MR = [29]
Two Term Exponential MR = [30]
Diffusion Approach MR = [31]
Verma MR = [32]
*a,b,c,k,g,h,n: Drying constants.
2.5. The color measurement
Color properties also change more or less in the drying like other processes applied to food and it is
generally observed during the drying process. The change of the color characteristics of samples
were investigated by predicting the chroma, hue angle, color difference (ΔE) and deltaChroma (ΔC)
values (Eqs. 8- 11).
(8)
(9)
(10)
(11)
In the equations ΔL*, Δa*, Δb* represent the difference in the color parameters between the fresh
and dried samples. CIE L*, a*, b* parameters were evaluated by using a color measuring device
(Minolta, CR-300, Japan) from the center surface point of the pomelo peel slabs before and after the
drying process, and the changes on the color parameters were determined.
202Tuncer, A.D., Güler, H.Ö., Usta, H. ECJSE 2020 (1) 198-210
2.6. Statistical Evaluation
The statistical evaluations of the results were achieved by using SPSS package program (SPSS, Ver.
20, 2011). The statistical parameters were R2 (regression coefficient), chi-square (X2) and root mean
square error (RMSE) were determined to investigate correlation of the selected drying curve models
with the empirical results (Eqs. 12, 13). That is supposed the R2 is close to 1 as the main compliance
value. Also, reduced χ2 and RMSE values were also calculated, and these values were considered as
secondary indicators of compliance.
RMSE= (12)
(13)
MRexp is the moisture value measured in the experimental observation, MRprd is the moisture value
expected in the model, n and N represents the number of model coefficients and observations,
respectively.
3. Results and Discussions
3.1. Drying rate and moisture ratio
The MC-varying drying rate graphs of the pomelo peel samples for different thicknesses and drying
methods are given for MW and FC in Fig. 2 and for FD in Fig. 3. As seen in these graphs, MC
values initially reduces swiftly after that slowly decreases with increasing time which means the
bigger amount of the water was removed at the initial parts of experiments and declined over time.
Also, it is stated that peel thickness and drying method effects the total drying time significantly and
time needed for drying was increased proportionally with the enhanced peel thickness. According to
Fig. 2 and Fig. 3, 0.5 cm thick peels had lower moisture content values in a shorter drying period
than the 1 cm thick cuts. It can be said that drying gets faster because of the decreases amount of
water carried by the reduced quantity of the sample. Compared to FC and MW methods, significant
increase in drying time approximately 10 times higher and more was observed for FD method.
Also, drying time of were calculated as about 24 min, 34 min, 410 min for thin slabs and 30 min, 44
min and 540 min for thick slabs for MW, FC and FD, respectively.
4
MWD, 1 cm
MWD, 0.5 cm
FCD, 1 cm
MC (g water.g dry matter)
3 FCD, 0.5 cm
-1
2
1
0
0 10 20 30 40 50
t (min)
Figure 2. Time-dependent change of the MC values for MW and FC
203ECJSE 2020 (1) 198-210 Modeling of drying characteristics of pomelo (Citrus Maxima)
When the results are examined, it has been observed that there is a distinct impact of the various
drying methods and the thickness of the product on the drying rate. Impact of drying methods,
thickness and MC on the drying rate of pomelo peels are given in Fig. 4. According to this, constant
drying rate period is not exist that the drying procedure was situated in falling rate period. The
reason of this may be through the inner layers of the peels which did not supply a stable amount of
water in the certain drying period.
4
FD, 1 cm
FD, 0.5 cm
MC (g water.g dry matter)
3
-1
2
1
0
0 100 200 300 400 500 600
t (min)
Figure 3. Time-dependent change of the MC values for FD
This also demonstrates in the drying experiments moisture diffusion behave as the main mechanism
in the sample. Similar results were observed in some other studies [33-35]. Also, the faster drying
rates might be associated with inner heat generation of the pomelo peel samples. According to the
Fig. 4, drying rate decreased through drying time and the decreased amount of the water in the
product. When the slice thickness is reduced by half, the drying rate has increased nearly by 25%.
Reduced product thickness reduces the distance the water will pass with diffusion and increases the
surface area per unit volume which is exposed to drying.
0.16
FD, 1 cm
Drying Rate (g water g dry matter min )
FD, 0.5 cm
-1
0.14
MWD, 1 cm
0.12 MWD, 0.5 cm
FCD, 1 cm
0.10
FCD, 0.5 cm
-1
0.08
0.06
0.04
0.02
0.00
0 1 2 3 4
MC (g water g-1 dry matter)
Figure 4. Effect of drying methods and MC on the drying rate of pomelo peels.
204Tuncer, A.D., Güler, H.Ö., Usta, H. ECJSE 2020 (1) 198-210
For this reason, thinner sliced food products generally dry up faster [36]. Similarly, there are other
studies which observed that the drying rate is reduced by increasing sample thickness [37-38].
Compared to other methods MW resulted in shortest drying times. MW drying provides easier
removal of large amount of moisture and causes lower drying time. For different food products,
similar results were determined for eggplant [36], pomegrate arils [39] and jujube [40] in the
literature.
3.2. Drying characteristics
Statistical findings of the best fitted three thin layer models which well-express the drying behavior
of dried samples were presented in Table 2. Nonlinear regression analyses are used to calculate the
coefficients for all drying models. The model coefficients are given in Table 2 for dried pomelo
peel samples under different conditions.
Table 2. Statistical results of the thin layer models that best express the drying behavior of pomelo peels
Model Model Constants R2 RMSE X2
Logarithmic k=0.001, c=-0.194, a=1.247 0.995 0.06992 0.00782
MW-1 cm Two Term k=0.001,c=0.008,a=1.056,b=0.009 0.995 0.22541 0.10162
Diffusion Approach k=0.004, b=0.984, a=-61.995 0.993 0.07851 0.00771
Henderson and Pabis k=0.0010, a=0.0010 0.981 0.07773 0.00787
FC-1 cm Logarithmic k=0.001, c=-0.225, a=1.2520 0.998 0.22255 0.07439
Diffusion Approach k=0.002, b=0.98, a=-35.751 0.994 0.05515 0.00466
Modified Henderson and k=0.0001, g=0.0001, h=0.0001, a=0.359, 0.986 0.09222 0.02552
Pabis b=0.359, c=0.359
FD-1 cm Two Term k=0.0001,c=0.0001,a=0.539,b=0.539 0.969 0.09200 0.01524
Diffusion Approach k=0.0001, b=0.966, a=-20.269 0.980 0.42228 0.26748
Logarithmic k=0.001, c=-0.225, a=1.252 0.998 0.11096 0.01969
MW-0.5 Diffusion Approach k=0.004, b=0.984, a=-61.995 0.993 0.23384 0.08749
cm
Two Term k=0.001,c=0.001,a=0.54,b=0.54 0.969 0.27838 0.15499
Logarithmic k=0.001, c=-0.256, a=1.272 0.998 0.11358 0.01843
FC-0.5 cm Henderson and Pabis k=0.001, a=1.067 0.977 0.13144 0.02159
Diffusion Approach k=0.002, b=0.984, a=-46.065 0.992 0.06739 0.00649
Two Term k=0.0001,c=0.0001,a=0.543,b=0.543 0.983 0.15974 0.04253
Diffusion Approach k=0.0001, b=0.984, a=-46.362 0.996 0.54922 0.43093
FD-0.5 cm
Modified Henderson and k=0.0001, g=0.0001, h=0.0001, a=0.362, 0.986 0.09222 0.02552
Pabis b=0.362, c=0.362
When the results were examined, it was found that three different models well-matched with the
experimental results. As seen in the table R2 values were in 0.969-0.998, χ2 values were in 0.005-
0.431 and RMSE values were in 0.055-0.549 intervals. Accordingly, best fitted model for MW and
FC drying methods with both 0.5 cm and 1 cm thicknesses is Logarithmic model. For the dried
sample with 0.5 cm slice thickness in FD, Diffusion model was chosen as the most compatible
model. Also, for 1 cm sliced thickness, Modified Henderson & Pabis model was determined as the
most suitable model for FD.
In a study which was determined the bell pepper thin-layer drying kinetics for five different
temperature levels in convective dryer, Logarithmic model was satisfactorily illustrate the drying
curve of bell pepper [41]. Toğrul and Pehlivan (2004) determined that the Diffusion Approach and
Modified Henderson-Pabis models are the best fitted models expressing the drying behavior of the
apricots and figs; grape and plum, respectively [42].
205ECJSE 2020 (1) 198-210 Modeling of drying characteristics of pomelo (Citrus Maxima)
3.3. Activation Energy and Effective Moisture Diffusivity
Effective diffusion coefficients of dried samples in MW, FC and FD for two different thicknesses
were observed and the results were given in Table 3. The effective diffusion coefficients of the
dried pomelo peel samples were found to be between 2.026×10⁻⁹ and 7.295 10-8 m2 s-1 for different
drying methods. At constant thickness, the highest effective diffusivity values has been determined
for the MW drying. MW provides increasing drying rate and Deff value by increasing the rate of
mass transfer in thin layers of pomelo peel. In addition, it has been found that the effective
diffusivity value increases with the thickness. Deff value is directly relevant to the square of the
sample thickness (Eq. 4). Since the amount of water in the thinner slices is smaller, the moisture
concentration difference between the ambient is lower, so the transport of the sample in the fruit is
slower. For this reason, the increase in thickness may lead to an increase in the effective diffusivity.
Compared to FD, the obtained effective diffusion coefficients were 10 times higher for MW and
FC. Since the diffusion coefficient can also be used to characterize the drying method, it is thought
that the most successful drying results are taken from MW, FC and FD, respectively. In a study
which apple pomace is used as sample in drying experiment the effective diffusion coefficients for
four different MD powers between 150-600 W observed in the interval of 1.0465-3.6854×10⁻⁸ m2 s-1
[43]. In another study where potato slices were dried with MD, the effective diffusivity coefficients
were found to vary between 0.025-3.05×10⁻⁸ m2 s-1 at power densities for four MW power densities
between 5-20 W g-1 [44]. Dried bell peppers in a convective dryer, Taheri-Garavand et al. (2011)
determined the moisture diffusion coefficient between 1.7x10⁻⁹ and 11.9x10⁻⁹ m2 s-1. The data
obtained from the previous literature studies were close to our experimental results [41].
The activation energy values for FC-dried samples were calculated as 52.435 and 56.791 kJ mol-1
for 1 cm and 0.5 cm thick sliced pomelo peel samples, respectively. Activation energy of pomelo
peel samples showed slightly higher compared to bell peppers (44.49 kJ mol-1) (Taheri-Garavand et
al., 2011); orange skin (36.40 kJ mol-1) [45]; okra (51.26 kJ mol-1) [20]; orange slice (16.47–40.90
kJ mol-1) [34]; in the interval of jujube (34.97 and 74.20 kJ mol-1) [40] and lower by comparison of
black tea (406.02 kJ mol-1) [33].
Also, the activation energies of the MW-dried samples were found as 115.03 W g-1 for 1 cm thick
peels and 124.36 W g-1 for 0.5 cm thick peels. Regardless of the drying methods, the activation
energies decreased with the increased peel thickness. The increase in the amount of substance by
increasing the thickness may caused a rise in the energies of the particles and therefore a decrease in
the activation energy could be occurred. This observation is supported by several studies in the
literature. For instance, the activation energies of the MD-dried samples were found as 76.5 W g-1
for the 5 mm thick eggplant samples and 25.4 W g-1 for the 10 mm thick samples [46].
Table 3. Effective diffusivity (m2 s-1) values of dried pomelo peel samples
Experiment Condition Deff (m2 s-1)
MW-0.5 cm 1.925 x 10⁻⁸
MW-1 cm 7.295 x 10⁻⁸
FC-0.5 cm 1.418 x 10⁻⁸
FC-1 cm 5.674 x 10⁻⁸
FD-0.5 cm 2.026 x 10⁻⁹
FD-1 cm 8.106 x 10⁻⁹
3.4. Color Properties
When the color properties are analyzed in Table 4, a* value is increased as against fresh sample for
both two thickness levels except for FD. The L* value decreased as a consequence of all drying
206Tuncer, A.D., Güler, H.Ö., Usta, H. ECJSE 2020 (1) 198-210
methods, while the b* value increased. Also, for different drying techniques different L*, a* and b*
values were determined among the samples with same thicknesses. FD method was found to be
more effective in preserving the Lightness (L*) value of the samples. As seen in Table 4 the Hue
angle increased with drying and this increase was higher in the FD. It can be said that the color of
pomelo peel samples dried with FD method is more distant from redness than other techniques.
Table 4. Color properties of pomelo peel samples before and after different drying conditions.
Color Raw Drying Condition
Parameters Material MW-0.5cm MW-1 cm FC-0.5 cm FC-1 cm FD-0.5 cm FD-1cm
L*
84.26 ± 0.76 65.23 ± 0.21 67.44 ± 0.32 66.58 ± 1.05 65.75 ± 0.23 72.56 ± 1.19 77.38 ± 0.63
a* 1.70 ± 0.19 2.55 ± 0.28 2.09 ± 0.06 3.49 ± 0.14 1.96 ± 0.26 0.94 ± 0.04 0.62 ± 0.04
b* 6.48 ± 0.61 24.13 ± 0.31 18.85 ± 0.47 22.24 ± 0.13 17.52 ± 0.33 18.63 ± 1.26 20.67 ± 0.74
C 6.69 ± 0,74 24.26 ± 1.20 18.96 ± 0.72 22.51 ± 0.56 17.60 ± 1.01 18.65 ± 0,94 20.67 ±1.12
∆C - 17.67 ± 0.76 12.38 ± 0.54 15.86 ± 0.82 11.03 ± 0.62 12.18 ± 0.78 14.23 ± 0.73
ΔE - 42.84 ± 1.04 38.84 ± 1.32 40.88 ± 1.01 40.05 ± 0.93 33.95 ± 1.14 30.41 ± 1.12
Hue angle 1.31 ± 0.12 1.46 ± 0.02 1.46 ± 0.03 1.41 ± 0.03 1.45 ± 0.08 1.52 ± 0.01 1.54 ± 0.02
In Fig. 5 and Fig. 6 the column charts of other color parameters were shown as deltaChroma (ΔC),
total color difference (ΔE), respectively. According to Fig. 5 and also Table 4 the ΔC value was
found to be higher in MW than FC and minimum ΔC value is observed in FD. This result shows
that the color saturation is higher in MW that the product becomes darker. The total color change in
dried samples was observed most in MW dried samples and least in FD dried samples for the same
peel thickness. Comparing the drying methods in terms of ΔC and ΔE values, it was seen that the
FD caused a little less change. Similar results were observed in the literature in terms of color
changes of dried pomelo peels [47].
Figure 5. Effect of sample thicknesses and drying methods on the ΔE color properties of pomelo peels.
207ECJSE 2020 (1) 198-210 Modeling of drying characteristics of pomelo (Citrus Maxima)
Figure 6. Effect of sample thicknesses and drying methods on the ΔC color properties of pomelo peels.
4. Conclusions
It was observed from the experimental results that for each drying method and sample thickness
only the falling rate period took place similar to most of the studies in the literature. Logarithmic,
Modified Henderson & Pabis and Diffusion Approach Models were most suitably models for
explaining the drying of pomelo peel slices. Results indicated that drying periods and effective
diffusivity coefficients of pomelo peel samples enhanced with increase in peel thickness inversely
with the drying rate and Ea values. Deff value of the samples were varied between 2.026×10⁻⁹ and
7.295×10⁻⁸ m2 s-1 and also found as about 10 times higher for MW and FC methods compared to
FD. The closest color parameters to the fresh product were obtained from FD method with respect
to ΔE and ΔC values. As a result, when looking at all these characteristics in general, it can be seen
that the closest quality feature to the fresh sample can be achieved with FD and the fastest drying
can be achieved with MW. If it is evaluated in terms of drying time, it is very clear that drying with
MW could be more advantageous with poorer quality characteristics compared to FD.
References
[1]. Abeysinghe D.C., Li X., Su, C., Zhang W., Zhou C., Chen K., Bioactive compounds and
antioxidant capacities in different edible tissues of citrus fruit of four species, Food
Chemistry 2007, 104 (4), 1338–1344.
[2].Zarina Z., Tan S.Y., Determination of flavonoids in Citrus grandis (Pomelo) peels and their
inhibition activity on lipid peroxidation in fish tissue, International Food Research Journal
2013, 20, 313–317.
[3].Methacanon P., Krongsin J., Gamonpilas C., Pomelo (Citrus maxima) pectin: Effects of
extraction parameters and its properties, Journal of Food Hydrocolloid 2013, 35, 383-391.
[4].Chau C.F., Huang Y.L., Comparison of the chemical composition and physicochemical
properties of different fibers prepared from the peel of citrus sinensis L. Cv. Liucheng,
Journal of Agricultural and Food Chemistry 2003, 51, 2615–2618.
[5].Fernando F., María L.H., Ana M.E., Italo C., Fernando A., Fibre concentrates from apple
pomace and citrus peel as potential fibre sources for food enrichment, Food Chemistry 2005,
91, 395-401.
[6].Alibaş Özkan İ., Işık E., Determination of drying parameters in microwave drying of apricot
and sweet cherry, First Stone Fruits Symposium 2001 Yalova, Turkey.
[7].Cemeroğlu B., Karadeniz F., Özkan M., Meyve ve Sebze İşleme Teknolojisi, Bölüm:
Kurutma Teknolojisi, Gıda Teknolojisi Derneği Yayınları 2003 28, 541-675.
208Tuncer, A.D., Güler, H.Ö., Usta, H. ECJSE 2020 (1) 198-210
[8]. Huang L.L., Zhang M., Mujumdar A.S., Lim R.X., Comparison of four drying methods for
restructured mixed potato with apple chips, Journal of Food Engineering 2011, 103, 279-
284.
[9]. Mcloughlin C.M., Mcminn W.A.M., Magee T.R.A., Microwave drying of citrus peel,
Proceedings of the Florida State Horticultural Society 2003, 95, 204–207.
[10]. Vadivambal R., Jayas D.S., Changes in Quality of Microwave-Treated Agricultural
Products: A review, Biosystems Engineering 2007, 98, 1-16.
[11]. Özdemir M., Devres Y.O., The thin layer drying characteristics of hazelnuts during
roasting, Journal of Food Engineering 1999, 42(4), 225-233.
[12]. Midilli A., Kucuk H., Mathematical modeling of thin layer drying of pistachio by using
solar energy, Energy Conversion and Management 2003, 44(7), 1111-1122.
[13]. Çelen, S., Arda, S.O., Karataşer, M.A., Modeling of Drying Behavior Using Microwave
Conveyor Dryer Assisted Solar Energy, El-Cezerî Journal of Science and Engineering,
2018, 5(1), 267-271.
[14]. Çetiner, S., Köse, H., Resistive Pressure Sensing Behavior of Electrically Conductive
PEDOT:PSS-Nonwoven Fabric Composites, El-Cezerî Journal of Science and
Engineering, 2018, 5(2), 310-315.
[15]. Güler, H.O., Tuncer, A.D., Şirin, C., Usta, H., Effect of forced convection drying on the
thin layer characteristics of ‘Deveci’ pear (Pyrus Communis L.), 3rd International
Conference on Agriculture, Food, Veterinary and Pharmacy Sciences 2019, Trabzon,
Turkey.
[16]. Khanlari, A., Güler, H.Ö., Tuncer, A.D.;, Şirin, C., Bilge Y.C., Yılmaz, Y., Güngör, A.,
Experimental and numerical study of the effect of integrating plus-shaped perforated
baffles to solar air collector in drying application. Renewable Energy 2020, 145, 1677-
1692.
[17]. Cihan A., Kahveci K., Hacıhafızoğlu O., Modelling of intermittent drying of thin layer
rough rice, Journal of Food Engineering 2007, 79, 293-298.
[18]. Dincer I., Dost S., An analytical model for moisture diffusion in solid objects during
drying, Drying Technology 1995, 13(1–2), 425–435.
[19]. Crank, J., The mathematics of diffusion. Clarendon Press, 1975 Oxford, UK.
[20]. Doymaz, I., Drying characteristics and kinetics of okra. Journal of Food Engineering 2005
69(3), 275–279.
[21]. Barbosa-Canovas, G.V., Vega-Mercado, H., Dehydration Mechanisms. In: Dehydration of
Foods 1996 First Edition, Chapman&Hall, New York, USA, 101-155.
[22]. Dadali, G., Özbek, B., Microwave heat treatment of leek: drying kinetics and effective
moisture diffusivity, International Journal of Food Science and Technology 2008, 43,
1443-1451.
[23]. Lewis, W.K., The rate of drying of solid materials, The Journal of Industrial and
Engineering Chemistry 1921, 3, 42.
[24]. Page, G.E., Factors influencing the maximum rate of air drying shelled corn in thin-
layers, 1949 MS Thesis, Purdue University, West Lafayette, USA.
[25]. White G.M., Bridges T.C., Loewer O.J., Ross I.J., Seed coat damage in thin layer drying
of soybeans as affected by drying conditions, Transactions of the ASAE 1978, 23(1),
224-227.
[26]. Henderson S.M., Pabis S., Grain drying theory I: Temperature effect on drying coefficient,
Journal of Agricultural Engineering Research 1961, 6, 169-174.
[27]. Karathanos V.T., Determination of water content of dried fruits by drying kinetics, Journal
Food Engineering 1999, 39, 337–344.
209ECJSE 2020 (1) 198-210 Modeling of drying characteristics of pomelo (Citrus Maxima)
[28]. Chandra P.K., Singh R.P., Applied Numerical Methods for Food and Agricultural
Engineers, 1995, CRC Press, Boca Raton, USA, 163-167.
[29]. Henderson, S.M., Progress in developing the thin layer drying equation. Transaction of
The ASAE 1974, 17, 1167-1172.
[30]. Sharaf-Eldeen Y.I., Blaisdell J.L., Hamdy M.Y., A model for ear corn drying, Transactions
of the ASAE 1980, 23, 1261-1271.
[31]. Kaseem A.S., Comparative studies on thin layer drying models for wheat, 13th
International Congress on Agricultural Engineering 1998, Morocco.
[32]. Verma L.R., Bucklin R.A., Ednan J.B., Wratten F.T., Effects of drying air parameters on
rice drying models, Transactions of the ASAE 1985, 28, 296–301.
[33]. Panchariya P.C., Popovic D., Sharma A.L., Thin-layer modeling of black tea drying
process, Journal of Food Engineering 2002, 52, 349-357.
[34]. Rafiee S., Sharifi M., Keyhani A., Omid M., Jafari A., Mohtasebi S.S., Mobli, H.,
Modeling effective moisture diffusivity of orange slice (Thompson Cv.), International
Journal of Food Properties 2010, 13(1), 32-40.
[35]. Tulek Y., Drying kinetics of oyster mushroom (Pleurotus ostreatus) in a convective hot air
dryer, Journal of Agricultural Science and Technology 2011, 13, 655-664.
[36]. Ertekin C., Yaldiz O., Drying of eggplant and selection of a suitable thin layer Drying
model, Journal of Food Engineering 2004, 63, 349-359.
[37]. Wang J., Xi Y.S., Drying characteristics and drying quality of carrot using a two-stage
microwave process, Journal of Food Engineering 2005, 68, 505-511.
[38]. Maskan M., Microwave/air and microwave finish drying of banana, Journal of Food
Engineering 2000, 44, 71-78.
[39]. Minaei S., Motevali A., Najafi G., Mousavi Seyedi S.R., Influence of drying methods on
activation energy, effective moisture diffusion and drying rate of pomegranate arils
('Punica granatum'), Australian Journal of Crop Science 2012, 6(4), 584.
[40]. Motevali A., Abbaszadeh A., Minaei S., Khoshtaghaza M.H., Ghobadian B., Effective
Moisture Diffusivity, Activation Energy and Energy Consumption in Thin-layer Drying of
Jujube (Zizyphus jujube Mill), Journal of Agricultural Science and Technology 2012, 14,
523-532.
[41]. Taheri-Garavand A., Rafiee S., Keyhani A., Study on effective moisture diffusivity,
activation energy and mathematical modeling of thin layer drying kinetics of bell pepper,
Australian Journal of Crop Science 2011, 5(2), 128.
[42]. Toğrul İ.T., Pehlivan D., Modelling of thin layer drying kinetics of some fruits under open-
air sun drying process, Journal of Food Engineering 2004, 65(3), 413-425.
[43]. Wang Z., Sun J., Chen F., Liao X., Hu X., Mathematical modelling on thin layer
microwave drying of apple pomace with and without hot air predrying, Journal of Food
Engineering 2007, 80, 536-544.
[44]. Darvishi H., Energy consumption and mathematical modeling of microwave drying of
potato slices, Agricultural Engineering International: CIGR 2012, 14(1),94-102.
[45]. Garau M.C., Simal S., Femenia A., Rossello C., Drying of orange skin: drying kinetics
modeling and functional properties. Journal of Food Engineering 2006, 75, 288–295.
[46]. Kutlu N., İşci A., Effect of Different Drying Methods on Drying Characteristics of
Eggplant Slices and Mathematical Modeling of Drying Processes, Academic Food Journal
2016, 14(1), 21-27.
[47]. Rahman N.F.A., Shamsudin R., Ismail A., Shah N.N.A.K., Effects of post-drying methods
on pomelo fruit peels, Food Science and Biotechnology 2016, 25(1), 85-90.
210You can also read