Quantum Dot-Polyfluorene Composites for White-Light-Emitting Quantum Dot-Based LEDs - MDPI
←
→
Page content transcription
If your browser does not render page correctly, please read the page content below
nanomaterials

Article
Quantum Dot–Polyfluorene Composites for
White-Light-Emitting Quantum Dot-Based LEDs
Mariya Zvaigzne 1, * , Irina Domanina 1 , Dmitriy Il’gach 2 , Alexander Yakimansky 2 ,
Igor Nabiev 1,3 and Pavel Samokhvalov 1, *
 1   Laboratory of Nano-Bioengineering, National Research Nuclear University MEPhI (Moscow Engineering
     Physics Institute), 115409 Moscow, Russia; frolova.irina.mephi@yandex.ru (I.D.);
     igor.nabiev@univ-reims.fr (I.N.)
 2   Laboratory of Polymer Nanomaterials and Compositions for Optical Media, Institute of Macromolecular
     Compounds of the Russian Academy of Sciences, 199004 St. Petersburg, Russia;
     ilgachdm@hq.macro.ru (D.I.); yak@hq.macro.ru (A.Y.)
 3   Laboratoire de Recherche en Nanosciences (LRN-EA4682), Université de Reims Champagne-Ardenne,
     51100 Reims, France
 *   Correspondence: mazvajgzne@mephi.ru (M.Z.); pssamokhvalov@mephi.ru (P.S.)

 Received: 12 November 2020; Accepted: 9 December 2020; Published: 11 December 2020

 Abstract: Colloidal quantum dots (QDs) are a promising luminescent material for the development of
 next generation hybrid light-emitting diodes (QDLEDs). In particular, QDs are of great interest in terms
 of the development of solid-state light sources with an emission spectrum that mimics daylight. In this
 study, we used CdSe(core)/ZnS/CdS/ZnS(shell) QDs with organic ligands mimicking polyfluorene
 and its modified derivatives to obtain QD–polymer composites emitting white light. We found that
 the emission of the composites obtained by spin-coating, being strongly dependent on the chemical
 structure of the polymer matrix and the QD-to-polymer mass ratio, can be accurately controlled
 and adjusted to bring its emission spectrum close to the spectrum of daylight (CIE coordinates:
 1931 0.307; 0.376). Moreover, the light emission of these composites has been found to be temporally
 stable, which is due to the minimal structural instability and volume-uniform charge and energy
 transfer properties. Thus, the use of the synthesized polyfluorene-based organic ligands with
 controllable chemical structures adaptable to the structure of the polymer matrix can significantly
 increase the stability of white light emission from QD composites, which can be considered promising
 electroluminescent materials for fabrication of white QDLEDs.

 Keywords: quantum dots; polyfluorene; charge transfer; energy transfer; white-light emission; QDLEDs

1. Introduction
     Colloidal quantum dots (QDs) are luminescent nanocrystals that have great potential for use
in many applications. Their unique physical and chemical properties determine a variety of new
QD-based trends in biomedicine, laser physics, and optoelectronics [1–5]. The major advantage of
QDs is the possibility to control their optical properties, i.e., the luminescence maximum wavelength
and absorption spectral range, by varying their physical size. Another important particularity of QD
properties is the possibility of obtaining colloidal solutions of QDs that can be used as fluorescent
inks, which makes it possible to fabricate functional QD films using relatively cheap methods, such as
spin-coating or applying QDs by inkjet printing [6–8]. In the field of hybrid optoelectronics, this opens
up the opportunity to avoid the use of expensive vacuum deposition technologies, and therefore
to simplify, and reduce the cost of, manufacturing microelectronic devices. QDs are of particular
interest in the development of solid-state light sources with an emission spectrum that mimics daylight.

Nanomaterials 2020, 10, 2487; doi:10.3390/nano10122487                  www.mdpi.com/journal/nanomaterials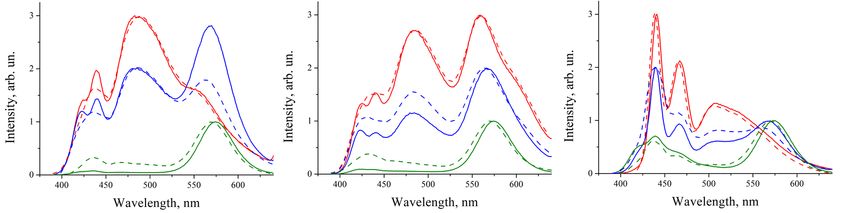
Nanomaterials 2020, 10, 2487                                                                      2 of 10

There are several ways to achieve white light emission using QDs. The first example is a combination
of a semiconductor LED emitting in the blue region of the optical spectrum with a layer of red and
green QDs deposited on top of it, which yields the desired white light [9]. Another way is to use
composites based on QDs and fluorescent organic polymers as an active electroluminescent layer of a
hybrid QD-based LED (QDLED) [10,11]. In this case, the combination of the emission spectra of the
polymer matrix and embedded QDs mimic the emission spectrum of daylight. The main advantage of
this approach is the simplicity and cost-effectiveness of fabricating such LEDs on flexible substrates
using the spin-coating or inkjet printing methods, because the emitting layer is deposited from a
mixed solution of the polymer and QDs. Another important advantage of this approach is that only
two components are used in the composites, which simplifies the process of optimizing the emission
spectrum of the fabricated devices, whereas in other options, more than two fluorophores are necessary
to obtain white light [9].
      However, the incorporation of QDs into a polymer matrix can significantly alter their optical
properties [9,12,13], which, as a result, affects the emission spectrum of the composite and, finally,
that of the QDLED. Apart from the obvious aggregation-related issues in such systems, various transfer
processes can occur between the QDs and the polymer matrix: radiative energy transfer, nonradiative
transfer by the FRET mechanism, and charge transfer between the QDs and their environment [13–16].
For this reason, an important role in the physicochemical stability of QD–emissive polymer composites
is played by the QD surface ligands, organic molecules that have a high affinity for both the QD surface
and the surrounding media, thus stabilizing the nanocrystals both in a solution and in the solid phase
when QDs are embedded in the polymer matrix [9].
      In this study, we investigated the effect of polyfluorene and its chemically modified derivatives
on the QD photoluminescence (PL) properties in order to design QD–polymer composites with a
stable white PL spectrum. We showed that the PL of the composite developed strongly depends
on the chemical structure of the polymer matrix and the QD-to-polymer mass ratio. Moreover,
we demonstrated that the emission of these composites can be accurately controlled by selecting the
polyfluorene derivative with the chemical structure adaptable to the structure of the polymer matrix
and adjusted so as to bring this emission spectrum close to the spectrum of daylight.

2. Materials and Methods
      CdSe(core)/ZnS/CdS/ZnS(shell) core/multishell QDs (CdSe/MS) with the luminescence maximum
at a wavelength of 569 nm and a full width at half maximum (FWHM) of 40 nm were fabricated by
colloidal synthesis according to the technique described by us elsewhere [17]. The synthesis of CdSe
cores was carried out by the “hot injection” of trioctylphosphine selenide into a solution of cadmium
n-hexadecylphosphonate in 1-octadecene heated to 240 ◦ C. This method allows obtaining QDs with a
relatively narrow size distribution of the CdSe cores in the ensemble. A multilayer ZnS/CdS/ZnS shell
was deposited on pretreated cores [18] by the method of successive ionic layer adsorption and reaction
(SILAR) [17]. The as-prepared QDs were capped with hexadecylammonium palmitate (HDA-PA)
ligands; the introduction of these ligands was carried out at the last stage of the QD synthesis to
increase their stability during storage and processing. The luminescence spectrum (measured using
an Cary Eclipse spectrofluorimeter (Agilent, Santa Clara, CA, USA)) of the QDs used in this study is
shown in Figure 1 (dashed orange line). All luminescence spectra reported in this study were recorded
under excitation at 350 nm. The luminescence quantum yield (QY) of the as-prepared QDs was found
to be 91% using Rhodamine 6G as a reference dye [19], but it dropped to 54% during the purification
procedure and sample processing due to charge transfer processes typical of QDs in solution [2,13].
Nanomaterials 2020, 10, x FOR PEER REVIEW 3 of 11
Nanomaterials 2020, 10, 2487 3 of 10
Figure 1. Luminescence spectra of polymer solutions and quantum dots (QDs). Polymer p99 (black),
Figurepolymer
1. Luminescence spectra of polymer solutions and quantum dots (QDs). Polymer p99 (black),
p79 (red), and polymer p133 (blue) in toluene; luminescence spectrum of CdSe/MS QDs in
polymer p79(dashed
toluene (red), orange
and polymer
line). p133 (blue) in toluene; luminescence spectrum of CdSe/MS QDs in
toluene (dashed orange line).
To study the possibility of using polyfluorene and its chemical derivatives to obtain QD–polymer
composites with white light emission for the development of QDLEDs, organic polymers that efficiently
To study the possibility of using polyfluorene and its chemical derivatives to obtain QD–
fluoresce in the blue region of the optical spectrum were selected. The structural formulas of the
polymer composites
polymers are shownwith white2.light
in Figure emissionused
The polymers for were
the development
designated p79,of QDLEDs,
p99, and p133.organic
The PL polymers
that efficiently
spectra of the fluoresce
polymersinarethe blueinregion
shown Figure 1of(solid
the lines,
optical spectrum
all spectra were selected.
are normalized The structural
to different
values for convenience). As seen from these spectra, all the considered polymers
formulas of the polymers are shown in Figure 2. The polymers used were designated p79, p99, and have similar optical
properties,
p133. The which are
PL spectra of mainly determined
the polymers arebyshown
the maininchain
Figureof the polyfluorene
1 (solid lines,network. All polymers
all spectra are normalized to
have the first emission maximum at a wavelength of 417 nm and the second maximum at a wavelength
different values for convenience). As seen from these spectra, all the considered polymers have
of 440 nm, which could be attributed to the exciton–vibronic bands (417 nm 0-0 and 440 nm 0-1) of the
similarlong
optical
fluorene properties,
sequence in which are mainly
the copolymers determined
p99, p79, and p133. The byluminescence
the main chain of studied
QYs of the the polyfluorene
network. All polymers
polymers in solution have the first using
were measured emission maximum
Coumarin at a wavelength
102 as a reference dye and were of 417 nm
found and
to be 74,the second
maximum
82, and at73%
a wavelength of 440
for p99, p79, and p133,nm, which could be attributed to the exciton–vibronic bands (417
respectively.
nm 0-0 and 440 nm 0-1) of the long fluorenewas
The fabrication of QD–polymer composites carried out
sequence in according to the following
the copolymers procedure.
p99, p79, and p133. The
First, a portion of solid QDs was weighted and dissolved in toluene, after which the solution was
luminescence QYs of the studied polymers in solution were measured using Coumarin 102 as a
purified twice from excess surface ligands by precipitating QDs with methyl acetate and redissolving
reference
themdye and were
in toluene. Afterfound to bethe
purification, 74,dry
82,QDand 73%was
residue for redissolved
p99, p79, inand p133,and
toluene, respectively.
the absorption
spectrum of the solution was measured (an Agilent Cary 60 UV-Vis spectrophotometer). The QD
concentration was determined using the Beer–Lambert law and the known values of the QD extinction
coefficient at the first exciton maximum (100,000 (M × cm)−1 ) and molecular mass of QDs with a
PL maximum at 569 nm (200 kDa). The polymers were also dissolved in toluene at a concentration
of 10 mg/mL, and then mixed with a QD solution to obtain QD-to-polymer mass ratios of 1:1, 1:10,
and 10:1. Then the solutions were applied onto precleaned glass substrates by spin-coating at a
spinning rate of 2000 rpm, after which they were dried under normal conditions. As a result of these
procedures, thin film samples with different mass ratios between QDs and polymer matrix were
obtained. After the film deposition, the luminescence spectra were measured, and then chromatic
diagrams were constructed to visualize the characteristics of the radiation chromaticity, and the
corresponding CIE 1931 chromaticity coordinates were determined. To study the dynamics of changes
in the luminescence of these composites, the photoluminescence spectra of the samples were measured
immediately after preparation and after 1, 2, 4, and 7 days of their storage in the dark.Nanomaterials 2020, 10, 2487 4 of 10
Nanomaterials 2020, 10, x FOR PEER REVIEW 4 of 11
Figure2.2.Structural
Figure Structuralformulas
formulasofofthe
thep79,
p79,p99,
p99,and
andp133
p133polyfluorene-based
polyfluorene-basedpolymers.
polymers.
InThe
order to study of
fabrication theQD–polymer
effect of QD ligands
composites on the
wasluminescent
carried outproperties
accordingof tothethe
composites,
following
the initial CdSe/MS QD ligands were replaced with ligands structurally resembling
procedure. First, a portion of solid QDs was weighted and dissolved in toluene, after which the the polyfluorenes
used, NIhexSH,
solution and OXDhexSH
was purified twice from(Figure 3). It isligands
excess surface assumed bythat such ligands
precipitating QDsensure a moreacetate
with methyl uniform and
distribution of QDs in the composite. The ligand replacement protocol was as follows.
redissolving them in toluene. After purification, the dry QD residue was redissolved in toluene, and Stock solutions
ofthe
QDsabsorption
in toluene were twice purified
spectrum of thefrom excess original
solution ligands as described
was measured above.Cary
(an Agilent After 60
the second
UV-Vis
centrifugation, the QD pellet at the bottom of the centrifuge tube was dissolved
spectrophotometer). The QD concentration was determined using the Beer–Lambert law and the in toluene in which a
1000-fold excess of the new ligand was previously dissolved. To increase the efficiency
known values of the QD extinction coefficient at the first exciton maximum (100,000 (M × cm) ) and of substitution,
−1
after the addition
molecular mass ofofQDs
newwith
ligands,
a PLthe QD solutions
maximum at 569 were
nm (200placed inThe
kDa). a water bath and
polymers werekept
alsofor 1 h at
dissolved
a in ◦ C. Then, the QD solution with the new ligands was precipitated again with methyl acetate and
60 toluene at a concentration of 10 mg/mL, and then mixed with a QD solution to obtain QD-to-
centrifuged,
polymer mass andratios
the procedure for treating
of 1:1, 1:10, and 10:1.QDs Thenwith
theansolutions
excess ofwere
new ligands
applied was
ontorepeated.
precleaned Finally,
glass
two additional
substrates sedimentation/redispersion
by spin-coating at a spinning rate cycles wererpm,
of 2000 performed as described
after which they wereabove,
driedtounder
obtainnormal
pure
samples of QDs
conditions. As capped
a result with the procedures,
of these NIhexSH or OXDhexSH ligand.with
thin film samples These QDs were
different mass mixed
ratioswith different
between QDs
polymer solutions, and thin film samples were prepared by the method described
and polymer matrix were obtained. After the film deposition, the luminescence spectra were above.
measured, and then chromatic diagrams were constructed to visualize the characteristics of the
radiation chromaticity, and the corresponding CIE 1931 chromaticity coordinates were determined.
To study the dynamics of changes in the luminescence of these composites, the photoluminescencefor 1 h at a 60 °C. Then, the QD solution with the new ligands was precipitated again with methyl
acetate and centrifuged, and the procedure for treating QDs with an excess of new ligands was
repeated. Finally, two additional sedimentation/redispersion cycles were performed as described
above, to obtain pure samples of QDs capped with the NIhexSH or OXDhexSH ligand. These QDs
were mixed with different polymer solutions, and thin film samples were prepared by the method
Nanomaterials 2020, 10, 2487 5 of 10
described above.
Figure 3. Structural formulas of the OXDhexSH and NIhexSH ligands.
Figure 3. Structural formulas of the OXDhexSH and NIhexSH ligands.
3. Results and Discussion
3. Results and Discussion
Figure 4 shows the luminescence spectra of the film composites made from the p79, p99, and p133
Figure
polymers and 4 shows the luminescence
QDs containing spectra
the original of the ligands
HDA-PA film composites made from
on their surface. the p79,
Initially, p99, and
we compared
p133 polymers andspectra
the luminescence QDs containing the original
of the solutions of theHDA-PA ligands on
pristine polymer andtheir
QDssurface.
with theInitially,
spectrawe of
compared the luminescence spectra of the solutions of the pristine polymer
their composite form measured on the day of composite film deposition. In the samples with a and QDs with the spectra
of their composite
QD-to-polymer form
mass measured
ratio of 1:10,on
thethe
QDday of composite
luminescence film deposition.
maximum In the
was shifted to samples with a QD-
shorter wavelengths.
to-polymer
In this case,mass ratio of 1:10,
an asymmetric the was
peak QD observed
luminescence maximum
at 470–500 nm, wasin theshifted
middle to between
shorter wavelengths.
those of pure
In this case, an asymmetric peak was observed at 470–500 nm, in the middle
polymers and QDs, with a weakly pronounced hump in the long-wavelength region, characteristic between those of pureof
polymers
our QDs. and QDs,
As one canwith
see,athis
weakly
effectpronounced hump in
strongly depended onthethelong-wavelength region, characteristic
structure of the polymer matrix; it was
of our pronounced
most QDs. As onefor canthesee, this effectbased
composites strongly
on thedepended
p79 polymer on the andstructure of the
was almost polymerfor
negligible matrix;
the ones it
was most pronounced for the composites based on the p79 polymer and was
based on the p133 polymer. Presumably, this may have been related to the misbalance in the degree of almost negligible for
the onesor
energy based on transfer
charge the p133from
polymer.
QDs ofPresumably,
various sizes thisinmay have beentorelated
the ensemble to the
different misbalance
fragments in the
of polymer
degree of energy or charge transfer from QDs of various sizes in the ensemble to
chains. However, this hypothesis requires further investigation. For samples with a mass ratio of 1:1, different fragments
of
nopolymer chains.
shift of the QD However,
PL maximum this was
hypothesis
observed,requires
and for further investigation.
the samples For samples
with a mass ratio of with
10:1, athe
mass
QD
ratio of 1:1, no shift
PL maximum of the QD
was shifted by 5PLnm maximum
to longer was observed, Apparently,
wavelengths. and for the samples
this fact with
may bea mass ratio of
explained by
10:1, the QD PL maximum was shifted by 5 nm to longer wavelengths. Apparently,
the large excess of QDs over the polymer in the prepared samples. Indeed, in the samples with a large this fact may be
explained
content of by thethe
QDs, large excess of
probability QDsaggregation
of QD over the polymer
increases,inwhichthe prepared
may be the samples.
cause ofIndeed,
the red in the
shift of
samples
their PLwith a large
spectrum contentby
induced ofnonradiative
QDs, the probability of QD aggregation
energy transfer (FRET) fromincreases,
smaller towhich
largermayQDsbe the
[14].
Nanomaterials
cause of the 2020, 10, x FOR
red shift PEER REVIEW
of their PL spectrum induced by nonradiative energy transfer (FRET) from 6 of 11
smaller to larger QDs [14].
Figure4.4.Luminescence
Figure Luminescencespectraspectraofofthe
theQD–p79
QD–p79(A),
(A),QD–p99
QD–p99(B),
(B),and
andQD–p133
QD–p133(C) (C)composites
compositesatat
variousQD-to-polymer
various QD-to-polymer concentration
concentration ratios,
ratios,measured
measuredimmediately
immediatelyafter fabrication
after (solid
fabrication lines)
(solid and
lines)
after
and a week
after a weekof of
storage
storageunder
undernormal
normalconditions
conditions (dashed
(dashed lines). The QD-to-polymer
QD-to-polymerconcentration
concentration
ratios
ratiosare
are1:10
1:10(red),
(red),1:1
1:1(blue),
(blue),and
and10:1
10:1(green).
(green).
Similar
Similarcomparison of the
comparison of luminescence maxima
the luminescence of the polymers
maxima showed that,
of the polymers for thethat,
showed composites
for the
containing the p79 and p99 polymers at QD-to-polymer mass ratios of 1:1 and 1:10, the first,
composites containing the p79 and p99 polymers at QD-to-polymer mass ratios of 1:1 and 1:10, most intense
the
peak
first,was shifted
most to peak
intense longer wavelengths
was by 7 nm,
shifted to longer while the second
wavelengths by 7 nm,peak did the
while not second
change peak
its position.
did not
change its position. The samples with a QD-to-polymer mass ratio of 10:1 exhibited only one
maximum of polymer luminescence, at a wavelength of 430 nm. Regarding the composites based on
the p133 polymer, a significant shift to longer wavelengths by 25 nm was observed for both
luminescence maxima in the samples with QD-to-polymer ratio mass ratios of 1:1 and 1:10, whereas
no PL maximum shift was observed at the QD-to-polymer mass ratio of 10:1.Nanomaterials 2020, 10, 2487 6 of 10
The samples with a QD-to-polymer mass ratio of 10:1 exhibited only one maximum of polymer
luminescence, at a wavelength of 430 nm. Regarding the composites based on the p133 polymer,
a significant shift to longer wavelengths by 25 nm was observed for both luminescence maxima in the
samples with QD-to-polymer ratio mass ratios of 1:1 and 1:10, whereas no PL maximum shift was
observed at the QD-to-polymer mass ratio of 10:1.
Analysis of the time course of alteration of the composite film luminescence spectra showed that
the main changes in the lineshape of the spectra occurred within the first 4 days after the film deposition.
Therefore, we compared the PL spectra of the composites obtained immediately after film fabrication
and after a week of their storage in the darkness, assuming that there were no further changes in the
spectral characteristics. For all samples based on the p79 and p99 polymers, the luminescence spectrum
measured after a week of storage in the dark had a single peak at a wavelength of about 430 nm. In the
samples based on the p133 polymer, with QD-to-polymer mass ratios of 1:1 and 1:10, two luminescence
peaks of the polymer shifted to the short-wavelength region by 4 nm were observed. The sample with
a QD-to-polymer ratio of 10:1 had one emission peak located at 434 nm. These aging effects of the
luminescence shift in polymers can be explained by their gradual oxidation by atmospheric oxygen,
which has been previously observed [20]. In addition, the spin-coating process allows one to deposit
composite films that are thermodynamically metastable, which is followed by phase segregation of the
polymer and QDs to a thermodynamically stable two-phase film after a prolonged time, accompanied
by spectral modifications of both components. Figure 4 shows that the samples where the amount of
polymer either considerably exceeded the mass content of QDs or was approximately equal to it were
the most stable over time. It can be assumed that, in the case of a relatively low QD content in the
composite, the probability of QD aggregation was also low, which led to a more uniform distribution
and better separation of nanoparticles over the volume of the sample. However, the PL spectrum of
the obtained composites was strongly shifted towards the blue region.
Analysis of the emission color coordinates (Figure 5) of the composite films showed that the
QD–p99 composite film with a QD-to-polymer mass ratio of 1:10 (x = 0.307, y = 0.376) was the closest to
the “absolutely
Nanomaterials 2020, 10, xwhite” (D65) with the coordinates x = 0.3128 and y = 0.329, which corresponds to
pointREVIEW
FOR PEER 7 of 11
the emission of a standard daylight source established by the International Commission on Illumination.
Figure 5. Chromatic diagram of the QD–p99 composite films with different QD-to-polymer mass ratios.
Figure 5. Chromatic diagram of the QD–p99 composite films with different QD-to-polymer mass
ratios.
This QD–p99 composite sample also had a greater temporal stability than, for example, the QD–
p133 sample with a mass ratio of 10:1, which also had color coordinates close to the coordinates of
white light (x = 0.320, y = 0.368), because the latter exhibited a shift of the luminescence peak and aNanomaterials 2020, 10, 2487 7 of 10
This QD–p99 composite sample also had a greater temporal stability than, for example,
the QD–p133 sample with a mass ratio of 10:1, which also had color coordinates close to the coordinates
of white light (x = 0.320, y = 0.368), because the latter exhibited a shift of the luminescence peak
and a change in its shape after several days of storage. Thus, the relative drifts of the |∆x| and |∆y|
color coordinates for the former sample were, respectively, 5 and 11 times smaller than those of
the latter sample. Therefore, further studies on the effect of surface ligands on the luminescence
properties of the prepared composites were carried out using polymer p99. In addition, taking into
account that the samples with a large excess of QDs were found to be extremely unstable with time,
we omitted the highest QD-to-polymer mass ratio of 10:1 in the subsequent experiments in favor of
lower contents of QDs in the composite materials. We supposed that the effects of both time-dependent
deterioration of QD–polymer composites and large unpredictable spectral drifts of the emission of
individual components were caused by a bad compatibility of the original aliphatic ligands of the QDs
with the polymer matrix. Indeed, this incompatibility could lead to severe aggregation of QDs in the
composite leading to PL quenching and non-uniform energy or charge transfer at the polymer–QD
interface. Moreover, this large difference in the chemical structure of the polymer matrix and QD
organic ligands could lead to time-dependent reorganization of the components in the bulk composite,
leading to phase segregation, which would further alter the composite luminescence properties. Finally,
these phase-segregated composites could be supposed to be more prone to polymer oxidation due
to the higher permeability of the inhomogeneous composite for atmospheric oxygen and moisture.
Therefore, in order to solve these problems, we made an attempt to improve the stability of the
luminescence properties of the composite films by using QDs whose surface was better adapted to
the structure of the polymer matrix. For this purpose, the composite films based on a mixture of the
p99 polymer and QDs coated with the specially synthesized NIhexSH and OXDhexSH ligands were
NanomaterialsFigure
prepared. 2020, 10,6 xshows
FOR PEER
theREVIEW
luminescence spectra of the obtained composites. 8 of 11
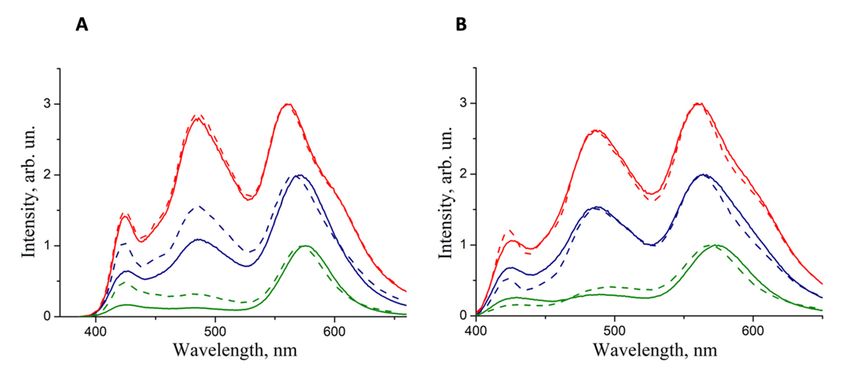
Figure 6. Luminescence spectra of composites consisting of QDs with OXDhexSH ligands and p99
Figure
(A) and6.QDs
Luminescence
with NIhexSH spectra of composites
ligands and p99 (B)consisting
recorded of QDs with OXDhexSH
immediately ligands
after composite and p99
preparation
(A) and
(solid QDsand
lines) with NIhexSH
after a week ligands and
of storage p99 (B)
under recorded
normal immediately
conditions (dashedafter composite
lines). preparation
The QD-to-polymer
(solidratios
mass lines)in
and
theafter a week of
composites storage
were under
1:10 (red normal
lines), 1: 1 conditions
(blue lines),(dashed
and 5: 1lines).
(greenThe QD-to-polymer
lines).
mass ratios in the composites were 1:10 (red lines), 1: 1 (blue lines), and 5: 1 (green lines).
Figure 6 shows that the shape of the luminescence spectra of the samples in which the NIhexSH
Figure
ligand 6 shows
was used werethat the shape
altered of the luminescence
significantly spectra
less after a week of the samples
of storage than thatin of
which the NIhexSH
the luminescence
ligand was
spectra used
of the were altered
composites significantly
in which less after
QDs with a week of
the original storageligands
aliphatic than that of the
were luminescence
used (Figure 4).
spectra
The of the of
positions composites in which QDs
the QD luminescence with the
maxima original
changed byaliphatic
no moreligands were
than 5 nm used
(for the(Figure
sample 4). The
with a
positions of the QD luminescence maxima changed by no more than 5 nm (for the sample
QD-to-polymer mass ratio of 5:1) even after a week of storage, and the polymer luminescence maxima with a QD-
to-polymerdid
practically massnotratio of 5:1)
change even
their after a week
positions. of storage,
For the andbased
composites the polymer
on QDsluminescence maxima
with the OXDhexSH
practically did not change their positions. For the composites based on QDs with
ligands, similar results are observed. However, as can be seen from the spectra, the QD-to-polymerthe OXDhexSH
ligands, similar results are observed. However, as can be seen from the spectra, the QD-to-polymer
emission intensity ratio changed with time to a greater extent compared to the samples in which
NIhexSH was used as a QD surface ligand. In this case, a decrease in the intensity of the QD peaks
relative to the polymer peaks was observed. Analysis of the changes in the color coordinates of the
radiation (Table 1) showed that the use of the NIhexSH ligand made it possible to significantly
increase the stability of the luminescence of the samples under study. These samples remained stableNanomaterials 2020, 10, 2487 8 of 10
emission intensity ratio changed with time to a greater extent compared to the samples in which
NIhexSH was used as a QD surface ligand. In this case, a decrease in the intensity of the QD peaks
relative to the polymer peaks was observed. Analysis of the changes in the color coordinates of the
radiation (Table 1) showed that the use of the NIhexSH ligand made it possible to significantly increase
the stability of the luminescence of the samples under study. These samples remained stable for over a
week, whereas the luminescence of the samples with the original ligands degraded as soon as after
a day of storage. Indeed, there was no decrease in the intensity of the QD luminescence relative to
the polymer, which led to a minor color coordinate drift: by a factor of 1.5 for |∆x| and by a factor of
4 for |∆y|. Furthermore, the luminescence QY of the QD/NIhexSH–p99 film with a QD-to-polymer
mass ratio of 5:1, measured in the integration sphere by the method described in [21], was found to be
very close to that of the pristine p99 polymer (75% and 82%, respectively). This finding allows us to
conclude that even high loading of NIhexSH–capped QDs does not severely affect the luminescence
energy efficiency of the polymer matrix.
Table 1. Emission color coordinates of the QD–p99 films with NIhexSH and OXDhexSH used as the
QD surface ligands.
Color Coordinates
Immediately after Preparation After 7 Days of Storage
Sample |∆x| |∆y|
x y x y
NIhexSH ligand
1:1 0.334 0.406 0.336 0.428 0.002 0.022
1:10 0.324 0.402 0.322 0.401 0.002 0.001
5:1 0.386 0.423 0.371 0.459 0.015 0.036
OXDhexSH ligand
1:1 0.356 0.407 0.325 0.385 0.031 0.022
1:10 0.317 0.389 0.312 0.386 0.005 0.003
5:1 0.431 0.440 0.358 0.329 0.073 0.111
White light (D65) 0.3128 0.329
The data show that the production of QD–polymer composites with a white emission spectrum
and temporally stable spectral characteristics requires careful adjustment of the QD-to-polymer mass
ratio in the composite, and functionalization of the QD surface with adaptable organic ligands capable
of enhancing thermodynamic stability of the nanocrystal dispersion in the matrix and stabilizing the
energy- and charge-transfer properties throughout the volume of the composite and in time. We believe
that our approach based on the use of polymer-mimicking ligands for preparation of luminescent
composites could be extended by using more complex ligand systems that include several types of
ligand molecules bearing different structural fragments of the polymer matrix, or by enhancing the
affinity of ligand molecules for the QD surface or the native ligand shell and the polymer matrix.
The use of the novel QD–polymer composites as the electroluminescent layer of QDLEDs will be the
subject of our further research.
4. Conclusions
We systematically investigated the optical properties of QD–polymer composites and developed
composites based on CdSe(core)/ZnS/CdS/ZnS(shell) QDs and polyfluorene-based ligands emitting
white light. Although we found that all of the studied polymers can be used to fabricate QD–polymer
composites with a white emission spectrum, their temporal stability and predictability of the spectral
coordinates strongly depend on the exact mass ratio between the QDs and polymer matrix and on the
type of organic ligands used for the QD stabilization. In order to minimize the phase incompatibilityNanomaterials 2020, 10, 2487 9 of 10
issues caused by the different natures of the original QD ligands and polymer matrix, we successfully
used specially synthesized surface ligands with a structure resembling the chemical structure of the
polymer matrix to obtain temporally stable composites with white light emission, which could serve as
electroluminescent materials for future QDLEDs.
The emission of the composites obtained by spin coating, being strongly dependent on the
chemical structure of the polymer matrix and the QD-to-polymer mass ratio, was accurately controlled
and adjusted to bring its emission spectrum close to the spectrum of daylight (CIE coordinates:
1931 0.307; 0.376). The data show that the use of the synthesized polyfluorene-based organic ligands
with controllable chemical structures adaptable to the structure of the polymer matrix can significantly
increase the stability of white light emission from the QD composites, which may be considered
promising electroluminescent materials for fabrication of white QDLEDs.
Author Contributions: Conceptualization, I.N. and P.S.; methodology, M.Z., I.D. and D.I.; validation, A.Y.;
writing—original draft preparation, M.Z. and I.D.; writing—review and editing, P.S. and I.N.; project
administration, P.S. All authors have read and agreed to the published version of the manuscript.
Funding: This work was supported by the Russian Science Foundation, grant no. 18-19-00588 (to P.S.). Part of
this work dealing with the optical characterization of solid-state composite materials was funded by the Ministry
of Education and Science of the Russian Federation, grant no. 14.Y26.31.0011.
Acknowledgments: I.N. acknowledges the support from the Ministry of Higher Education, Research and
Innovation of the French Republic and the Université de Reims Champagne-Ardenne. We thank Vladimir Ushakov
for the help with technical preparation of the manuscript.
Conflicts of Interest: The authors declare no conflict of interest.
References
1. Samokhvalov, P.; Artemyev, M.; Nabiev, I. Basic principles and current trends in colloidal synthesis of highly
luminescent semiconductor nanocrystals. Chem. A Eur. J. 2013, 19, 1534–1546. [CrossRef]
2. Vokhmintcev, K.V.; Samokhvalov, P.S.; Nabiev, I. Charge transfer and separation in photoexcited quantum
dot-based systems. Nano Today 2015, 11, 189–211. [CrossRef]
3. Klimov, V.I. Optical Gain and Stimulated Emission in Nanocrystal Quantum Dots. Science 2000,
290, 314–317. [CrossRef]
4. Sun, Y.; Jiang, Y.; Sun, X.W.; Zhang, S.; Chen, S. Beyond OLED: Efficient Quantum Dot Light-Emitting Diodes
for Display and Lighting Application. Chem. Rec. 2019, 19, 1729–1752. [CrossRef] [PubMed]
5. Yang, Y.; Zheng, Y.; Cao, W.; Titov, A.; Hyvonen, J.; Manders, J.R.; Xue, J.; Holloway, P.H.; Qian, L.
High-efficiency light-emitting devices based on quantum dots with tailored nanostructures. Nat. Photonics
2015, 9, 259–266. [CrossRef]
6. Coe-Sullivan, S.; Steckel, J.S.; Woo, W.K.; Bawendi, M.G.; Bulovic, V. Large-area ordered quantum-dot
monolayers via phase separation during spin-casting. Adv. Funct. Mater. 2005, 15, 1117–1124. [CrossRef]
7. Kramer, I.J.; Minor, J.C.; Moreno-bautista, G.; Rollny, L.; Kanjanaboos, P.; Kopilovic, D.; Thon, S.M.;
Carey, G.H.; Chou, K.W.; Zhitomirsky, D.; et al. Efficient Spray-Coated Colloidal Quantum Dot Solar Cells.
Adv. Mater. 2015, 27, 116–121. [CrossRef] [PubMed]
8. Kramer, I.J.; Moreno-Bautista, G.; Minor, J.C.; Kopilovic, D.; Sargent, E.H. Colloidal quantum dot solar cells
on curved and flexible substrates. Appl. Phys. Lett. 2014, 105, 1–5. [CrossRef]
9. Zvaigzne, M.A.; Martynov, I.L.; Samokhvalov, P.S.; Nabiev, I. Fabrication of composite materials from
semiconductor quantum dots and organic polymers for optoelectronics and biomedicine: Role of
surface ligands. Russ. Chem. Bull. Int. Ed. 2016, 65, 2568–2577. [CrossRef]
10. Yoon, C.; Kim, T.; Shin, M.-H.; Song, Y.-G.; Shin, K.; Kim, Y.-J.; Lee, K. Highly luminescent and stable white
light-emitting diodes created by direct incorporation of Cd-free quantum dots in silicone resins using the
thiol group. J. Mater. Chem. C 2015, 3, 6908–6915. [CrossRef]
11. Lin, H.; Wang, S.; Lin, C.; Member, S.; Chen, K.; Han, H.; Tu, Z.; Tu, H.; Chen, T.; Shih, M.; et al. Excellent Color
Quality of White-Light-Emitting Diodes by Embedding Quantum Dots in Polymers Material. IEEE J. Sel.
Top. Quantum Electron. 2016, 22, 35–41. [CrossRef]Nanomaterials 2020, 10, 2487 10 of 10
12. Zvaigzne, M.A.; Martynov, I.L.; Krivenkov, V.A.; Samokhvalov, P.S.; Nabiev, I.R. The influence of the quantum
dot/polymethylmethacrylate composite preparation method on the stability of its optical properties under
laser radiation. Opt. Spectrosc. (Engl. Transl. Opt. i Spektrosk.) 2017, 122, 76–80. [CrossRef]
13. Krivenkov, V.; Samokhvalov, P.; Zvaigzne, M.; Martynov, I.; Chistyakov, A.; Nabiev, I. Ligand-Mediated
Photobrightening and Photodarkening of CdSe/ZnS Quantum Dot Ensembles. J. Phys. Chem. C 2018,
122, 15761–15771. [CrossRef]
14. Chou, K.F.; Dennis, A.M. Ferster Resonance Energy Transfer between Quantum Dot Donors and Quantum
Dot Acceptors. Sensors 2015, 15, 13288–13325. [CrossRef] [PubMed]
15. Mork, A.J.; Weidman, M.C.; Prins, F.; Tisdale, W.A. Magnitude of the Förster Radius in Colloidal Quantum
Dot Solids. J. Phys. Chem. C 2014, 118, 13920–13928. [CrossRef]
16. Zheng, K.; Zidek, K.; Abdellah, M.; Zhu, N.; Chábera, P.; Lenngren, N.; Chi, Q.; Pullerits, T. Directed energy
transfer in films of CdSe quantum dots: Beyond the point dipole approximation. J. Am. Chem. Soc. 2014,
136, 6259–6268. [CrossRef] [PubMed]
17. Samokhvalov, P.; Linkov, P.; Michel, J.; Molinari, M.; Nabiev, I. Photoluminescence quantum yield
of CdSe-ZnS/CdS/ZnS core-multishell quantum dots approaches 100% due to enhancement of charge
carrier confinement. Proc. SPIE 2014, 8955. [CrossRef]
18. Linkov, P.A.; Vokhmintcev, K.V.; Samokhvalov, P.S.; Nabiev, I.R. Ultrasmall quantum dots for fluorescent
bioimaging in vivo and in vitro. Opt. Spectrosc. (Engl. Transl. Opt. i Spektrosk.) 2017, 122, 8–11. [CrossRef]
19. Grabolle, M.; Spieles, M.; Lesnyak, V.; Gaponik, N.; Eychmuller, A.; Resch-Genger, U. Determination of
the Fluorescence Quantum Yield of Quantum Dots: Suitable Procedures and Achievable Uncertainties.
Anal. Chem. 2009, 81, 6285–6294. [CrossRef]
20. Yang, S.H.; Le Rendu, P.; Nguyen, T.P.; Hsu, C.S. Fabrication of MEH-PPV/SiO2 and MEH-PPV/TiO2
nanocomposites with enhanced luminescent stabilities. Rev. Adv. Mater. Sci. 2007, 15, 144–149.
21. Makowiecki, J.; Martynski, T. Absolute photoluminescence quantum yield of perylene dye ultra-thin films.
Org. Electron. 2014, 15, 2395–2399. [CrossRef]
Publisher’s Note: MDPI stays neutral with regard to jurisdictional claims in published maps and institutional
affiliations.
© 2020 by the authors. Licensee MDPI, Basel, Switzerland. This article is an open access
article distributed under the terms and conditions of the Creative Commons Attribution
(CC BY) license (http://creativecommons.org/licenses/by/4.0/).You can also read