Research project Fieldlab Evenementen phase II: scale-ups - Data collection and monitoring of group dynamics between visitors of the Fieldlab ...
←
→
Page content transcription
If your browser does not render page correctly, please read the page content below
.
    Research project Fieldlab Evenementen phase II:
    scale-ups

    Data collection and monitoring of group dynamics between visitors of the Fieldlab
    Evenementen pilot events

    Breda
                                                                            July 2021
Contents
1.     Introduction                                                    2
1.1    Research objective                                              2
1.2    The events                                                      2
1.3    Readers guide                                                   2
       1.4.1.   Risk profile                                           3
       1.4.2.   Safety measures                                        3
2.     Type I events                                                   4
2.4.   Residential Orchestra, Zuiderstrandtheater (the Hague)          4
       2.4.1.   The event                                              4
       2.4.2.   Safety measures                                        5
       2.4.3.   Results                                                5
2.5.   Conclusion type I events                                        6
3.     Type II events                                                  7
3.4.   3FM Awards, Tivoli Vredenburg (Utrecht)                         7
       3.4.1.   The event                                              7
       3.4.2.   Safety measures                                        8
       3.4.3.   Results                                                8
3.5.   Racoon concert, Mainstage (’s Hertogenbosch)                   10
       3.5.1.   The event                                             10
       3.5.2.   Safety measures                                       11
       3.5.3.   Results                                               11
3.6.   Eurovision Song Contest, Ahoy (Rotterdam)                      13
       3.6.1.   The event                                             13
       3.6.2.   Safety measures                                       14
       3.6.3.   Results                                               14
3.7.   Conclusion type II                                             16
4.     Type III events                                                17
4.4.   International match NED-LAT, Johan Cruijff ArenA (Amsterdam)   17
       4.4.1.   The event                                             17
       4.4.2.   Safety measures                                       18
       4.4.3.   Results                                               18
4.5.   Conclusion type III                                            20
5.     Conclusion                                                     21
6.     Bibliography                                                   22

                                                       1
1. Introduction
The global COVID-19 pandemic poses major political, social and economic challenges to countries. Measures
aimed at restricting (close) contact between individuals, gathering in large numbers, or in environments with
reduced air quality in order to contain the spread of COVID-19 have had a major impact on society. The far-
reaching measures, sometimes even lockdowns, have meant that various sectors have had to operate below
their normal capacity, or have even been unable to operate at all.

One of the sectors that has been hit hardest by the effects is the events sector. After all, the spread of COVID-19
is facilitated by contact between people, and events are potential situations where people have a lot of contacts.
Historically, sports, religious, music and other large-scale events have been the source of infectious diseases that
have spread worldwide (Memish, et al., 2019). However, not organizing events is not a sustainable situation from
a social and economic perspective (Fieldlab Evenementen, 2020). Little is known about the actual number of
contacts of a visitor, the influence of visitor dynamics during an event and the associated risk.

The results presented in this report ‘Research project Fieldlab Evenementen phase II scale-ups’, are logically
building further upon the research done in phase I. The research conducted in phase II differs in relation to the
number of visitors to the events organized in phase I.

The research conducted in phase I provided insights and findings on the execution of ‘safe’ small-scale events.
The results presented in this report are focused on the similarities and differences in visitor dynamics in ‘small
scaled’ events in comparison to the events with a larger number of visitors (scale-ups).

Ultimately, this research aims to investigate if the alternative set of measures applied in phase I are still applicable
and feasible when it regards events with a larger number of visitors. The conclusions and recommendations
drawn can contribute to a situation in which events can take place safely and responsibly during a pandemic.
These research activities are (partly) financed with the PPP allowance of the Ministry of Economic Affairs and
Climate from CLICKNL. CLICKNL is the top consortium for Knowledge and Innovation (TKI) of the Creative
Industry.

1.1    Research objective
The principles of the research into visitor dynamics remain the same as in phase I; the number of contacts a
visitor has, at what distance these contacts are and how long these contacts last. Density was also measured at
certain 'attraction points', such as the toilets, catering establishments and cloakrooms/ lockers.

The main question of the sub-study is formulated slightly different and is as follows: What is the potential impact
of measures and/or interventions on the number of contact moments in the different categories that a visitor
has during his/her stay at scaled up events?

1.2    The events
In a period of three months (March – May 2021), nine events initiated by Fieldlab Events took place for phase II
of the research project. In this report, the results from five events are covered and elaborated, as these events
were focused on scaling up. The following events are covered;
     •    I. Indoor passive: Residential Orchestra
     •    II. Indoor active: 3FM Awards, Racoon concert, Eurovision Song Contest
     •    III. Outdoor active: international soccer match (NED-LAT)

1.3    Readers guide
The chapters of the report are structured according to the different event types; I (indoor passive), II (indoor
active) and III (outdoor active), followed by a discussion. Per event type, the different pilot events are discussed.
First, the event specifics will be given, followed by a risk profile and the safety measures. Next, the results are

                                                            2
presented. The conclusions will be given overall per type of event at the end of the chapter. A more elaborate
introduction in the reporting per pilot event regarding the risk profile and safety measures is given below.

          1.4.1. Risk profile
The building block, visitor dynamics, focuses on minimising the risk of infection at events. In order to map the
profile of the event, a distinction is made between factors that normally play a role when analysing the risks at
events in a non-covid situation. A distinction is made between the activity profile, the spatial profile and the public
profile (van den Brand & Abbing, 2003).

Activity profile
The activity profiles came about through a brainstorming session with various stakeholders (Logistics Community
Brabant, 2020). It concerns the processes at the event where visitors come together and where there is a possible
risk of contamination. This involves visitors encountering each other at a certain location, for a certain length of
time and at a certain risk. By localising, describing, and analysing the risks, processes can be optimised, and the
spread of risks minimised.

Spatial profile
Not one event is like another. It is therefore useful to use general characteristics when classifying events. (van
Rijn & van Damme, 2011) describe several general characteristics related to events in addition to the
characteristics mentioned by Fieldlab. These general characteristics give direction to the expectations concerning
the dynamics of visitors to events.

Before the events, clear and strict guidelines have been drawn up for all those directly involved. The main
condition for participating in the event is the submission of a negative rapid test result at the entrance to the
event site. This test must be taken at one of the affiliated test locations within 24 hours before the end of the
event. Apart from this condition, additional conditions have been communicated through a developed app. For
example, outside the event site, the RIVM guidelines apply to everyone involved and no specific measures or
restrictions apply on the event site.

Public profile
It is essential to know the characteristics of the audience of a specific event in order to anticipate on their
behaviour. Audience is inextricably linked to behaviour.

Before zooming in on behaviour and mood, the type of audience is mentioned. In addition to the distinction in
audiences, social characteristics of audiences are indicated. Audiences display specific behaviour, but they are
difficult to define and cannot easily be classified (Still, 2014).

          1.4.2. Safety measures
The events took place in a protected and controlled environment. In order to realise this environment, different
safety measures were taken, such as the requirement for a negative COVID-19 test for entrance, direct
communication with the visitors and ventilation requirements. This report will focus on the measures regarding
visitor dynamics, such as time slots. The use of time slots aims to achieve a gradual and controlled ingress and is
directly related to the starting times and physical size of the starting areas. The design and organisation of the
ingress/egress process and the allocation of time slots were achieved through intensive cooperation between
various parties involved.

For the ingress process, process calculations were made to determine the capacity of the ingress process per
entrance lane, in order to ensure a safe and regulated ingress with minimum contact moments.

                                                            3
2. Type I events
Event type I: indoor passive is characterised as an indoor event with a passive character. Visitors are calm,
composed and/or business-like. Visitors have an assigned or free seat. This allocated seat is part of a specific
bubble that each has explicit rules and measures (Fieldlab Evenementen, 2020).

    2.4. Residential Orchestra, Zuiderstrandtheater (the Hague)
On Friday, May 7th, 2021 the third type I event, initiated by Fieldlab events, took place in the Zuiderstrandtheater,
the Hague. The ingress started at 18.30h and the start of the concert was at 19.30h and ended at 20.40h.

         2.4.1. The event
The risk profile of the event is described in Table 1, Table 2 and Table 3.

Table 1. Activity profile Residential Orchestra

 Touchpoints (Ingress)            Zuiderstrandtheater
    Parking                       Nearby car park
    Entrance                      Ticket, negative test result and after receiving tag
    Placing                       Based on bubbles
    Visitation                    Not applicable
 Touchpoints
 (Circulation)
    Beverage                      Bars
    Food                          Not applicable
    Toilets                       At location
    Entrance process              Through entrance gate manned by steward(s)
    Exit process                  Via exit gate manned by steward(s)
    Routes                        Via signage
 Touchpoints (Egress)
    Parking                       Nearby parking area
    Exit                          Accompanied by stewards and after return of tags

Table 2. Spatial profile Residential Orchestra

 Event name                      Residential Orchestra
 Spatial Profile
 Event location                  Zuiderstrandtheater
 Event type                      Indoor passive
 Sort event                      Public event
 Event specification             Music event
 Attractiveness                  Regional/National
 Duration                        Evening
 Location (indoor/outdoor)       Indoor
 Accessibility                   Fixed location – Existing
 Size                            Small sized (500 - 5.000 persons)
 Access                          Ticket sales

Table 3. Public profile Residential Orchestra

 Cohesive                        Crowd gathered for a specific purpose or reason;
                                 No leadership.

                                                             4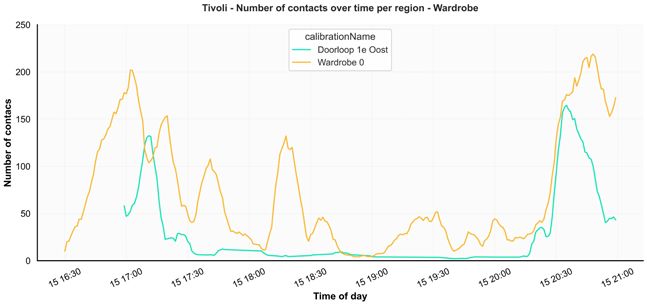
The location can accommodate 1007 visitors; however, 516 tickets have been sold for this occasion. This leads to
an occupancy rate of 51%. To the visitors in this event setting, passive behaviour applies during ingress and
egress. Visitors for this event are to be typified as “cohesive”, meaning that no extra safety measures have been
implemented other than in- and egress processes.

          2.4.2. Safety measures
In order to realise a gradual ingress, arrival time slots were implemented. Table 4 shows the time slots and the
number of visitors per timeslot.
Table 4. Time slots Residential Orchestra

 Timeslots           Bubble 1 (Grey); 348p          Bubble 2 (Yellow); 209p
 18.20h - 18.40h                116                               70
 18.40h - 19.00h                116                               70
 19.00h - 19.20h                116                               69

        2.4.3. Results
The total visitor group was divided into two separate ‘bubbles’ as an organizational measure to try and keep
contacts to a minimum. Table 5 presents the general statistics of the event. On average the grey bubble had 6.7
unique contacts (IQR= 5-8) lasting more than 15 minutes cumulative within 1.5 meters. The yellow bubble had -
on average- a non-meaningful difference in the number of unique contacts; 6.6 (IQR= 4-8).

Table 5. General statistics Residential Orchestra

Figure 1 shows an overview of the total number of contacts over time. A clear spike in contacts can be noted
during the in- and egress of the theatre hall. A smaller second spike can be noted around 22:00 as part of a
second egress wave after the after-show drinks for the grey bubble.

Figure 1. Total number of contacts over time Residential Orchestra

                                                              5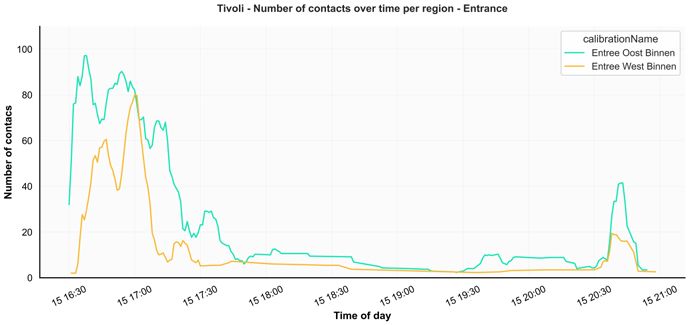
Video analyses shows, as illustrated in Figure 2, that this possibility for the grey bubble to have several drinks
after the show leads to a higher number of contacts for a longer duration (bar area) than for the comparable
areas of the yellow bubble (Level 1 bar). It can also be observed that contacts in the yellow bubble are evenly
distributed amongst the two bars, whereas this is not the case for the grey bubble. However, as indicated by the
results of the contact tracking device analyses, this does not lead to a higher number of critical contacts.

Figure 2. Number of contacts over time per area Residential Orchestra

    2.5. Conclusion type I events
Figure 3 compares the findings of the type I pilot events as organized during phase 1 of the research program
with those organized during phase 2. From this data, we can see that that the results are in line with previous
conclusions. Increasing the maximum allowed number of visitors does not seem to have a significant impact on
the number of critical contacts a visitor has during his attendance. As with pilot 1, the possibility for catering
during the event increases the number of contacts slightly in comparison with pilot 2. However, as research, as
conducted by TU Delft, indicates, no meaningful difference in risk level was found.

Figure 3. Comparison type I events

                                                           6
3. Type II events
The definition of event type II, as described in Pilots for 'Low-Contact Events (Fieldlab Evenementen, 2020); indoor
active is characterised as an event that takes place inside and has an active character. Visitors are enthusiastic,
sociable, and exuberant and have an 'assigned' place to sit/stand. This allocated seat/standing place is part of a
specific bubble that each has explicit rules and measures.
3.4. 3FM Awards, Tivoli Vredenburg (Utrecht)
On Thursday, April 15th 2021, the third type II event, initiated by Fieldlab events, took place in Tivoli Vredenburg
in Utrecht. The event was a music concert and award show. With the support acts during the evening. The ingress
of the event started at 16.30h and the show ended at 20.30h.
3.4.1. The event
The risk profile of the event is described in Table 6, Table 7 and Table 8.
Table 6. Activity profile 3FM Awards
Touchpoints (Ingress) 3FM Awards
Parking Nearby car park
Entrance Ticket, negative test result
Placing Based on bubbles
Visitation Applicable
Touchpoints (Circulation)
Beverage Bars
Food Snackbar
Toilets At location
Entrance process Through entrance gate manned by steward(s)
Exit process Via exit gate manned by steward(s)
Routes Via signage
Touchpoints (Egress)
Parking Nearby parking area
Exit Accompanied by stewards and after the return of tags
Table 7. Spatial profile 3FM Awards
Event name 3FM Awards
Spatial Profile
Event location Tivoli theatre
Event type Indoor active
Sort event Public event
Event specification Music event
Attractiveness National
Duration Evening
Location (indoor/outdoor) Indoor
Accessibility Fixed location - Existing
Size Small sized (500 - 5.000 persons)
Access Tickets sales
7Table 8. Public profile 3FM Awards
Cohesive Crowd gathered for a specific purpose or reason;
No leadership.
The Tivoli Theatre in Utrecht can accommodate 2000 spectators in a semi-seated setting. For this occasion, 1200
tickets have been made available, which represents an occupancy rate of over 60%. Visitors for this event are to
be typified as “cohesive”, meaning that no extra safety measures have been implemented other than in- and
egress processes.
3.4.2. Safety measures
At the 3FM Awards, three bubbles were created. One of these bubbles, the nominees for the awards, has not
been included in the research. The other two bubbles were split between the ground floor and the first floor.
Bubble 1 contained 472 seats, whereas bubble 2 contained 265 seats + space for 338 people on the dance floor.
3.4.3. Results
Approximately 1200 visitors attended an indoor concert. No contact tracking devices were utilized to collect data.
Video analysis is performed to answer the main research questions.
Figure 4 shows the number of contacts per entrance; bubble 1 (Entree West Binnen) and bubble 2 (Entree Oost
Binnen). Bubble 2 had slightly more visitors than bubble 1 (28% more), which may clarify the higher number of
contacts at the entrance of bubble 2. The process in the field-of-view of the camera is the CoronaCheck, the
execution of which was more “smooth” at bubble 2. Interestingly enough, this did not impact the number of
contacts.
Figure 4. Number of contacts per entrance 3FM Awards
Figure 5 shows the number of contacts per wardrobe area. The wardrobe for bubble 1 (Wardrobe 0) was a
regular, “open” wardrobe, whereas the wardrobe for bubble 2 (Doorloop 1e oost) had a queuing system. The
wardrobe with the queuing system had considerably more contacts than the wardrobe without. However, this
can partially be explained by the function of the areas in the field-of-view of the cameras. The wardrobe area for
bubble 1 was solely utilized as a wardrobe area, however, the wardrobe area for bubble 2 was utilized as
8circulation and hang-out area as well, explaining the peaks in contacts outside the times during which the
wardrobe was visited.
Figure 5. Number of contacts per wardrobe 3FM Awards
Figure 6 shows the number of contacts per bar area. The bar for bubble 1 (Horeca 0) was a bar with a queueing
system, whereas the bar (Horeca 1-2) and food stand (Horeca 1-1) for bubble 2 had no specific queueing system.
It can once again be observed that the queue with the queuing system has a higher number of contacts.
Figure 6. Number of contacts per bar 3FM Awards
The result regarding the higher number of contacts in areas where queuing systems were applied is somewhat
counterintuitive. On the other hand, the area is designed to improve the flow and thus prevent the duration a
visitor would have to spend in that area. The current result represents the number of contacts within 1,5 metres
but does not include the duration of the contact. The queuing systems may still have a positive effect on the
number of critical contacts (more than 15 minutes) a visitor has, however, this can not be determined.
Furthermore, the video images were manually observed to analyse the processing time for the execution of the
CoronaCheck; the scanning of a QR code in an application on the visitors’ phone. It is important to mention
beforehand that the CoronaCheck procedure at the 3FM Awards did not include an ID check. The average
processing time for bubble 1 was 10.6 seconds and for bubble 2 8.9 seconds, a significant difference. The results
are influenced by whether visitors were informed before the check process; there was a steward in bubble 2,
who informed visitors they would have to go through the CoronaCheck. As a result of this, visitors arrived
prepared (QR code ready to be scanned), and the average processing time decreased.
93.5. Racoon concert, Mainstage (’s Hertogenbosch)
On Friday, May 7th 2021, the 4th type II pilot event, initiated by Fieldlab events, took place in the Mainstage in the
Brabanthallen in 's-Hertogenbosch. The event was a music concert by the band Racoon, with a support act by
Son Mieux. The ingress of the music concert started at 19.00h and the show ended at 22.45h.
3.5.1. The event
The risk profile of the event is described in Table 10, Table 11 and Table 12.
Table 9. Activity profile Racoon concert
Touchpoints (Ingress) Racoon
Parking Nearby car park
Entrance Ticket, negative test result and after receiving tag
Placing Based on bubbles
Visitation Applicable
Touchpoints (Circulation)
Beverage Bars
Food Snackbar
Toilets At location
Entrance process Through entrance gate manned by steward(s)
Exit process Via exit gate manned by steward(s)
Routes Via signing
Touchpoints (Egress)
Parking Nearby parking area
Exit Accompanied by stewards and after return of tags
Table 10. Spatial profile Racoon concert
Event name Pop concert Racoon
Spatial Profile
Event location Brabanthallen 's-Hertogenbosch
Event type II. Indoor active
Sort event Public event
Event specification Music concert
Attractiveness Regional/national
Duration Daytime
Location (indoor/outdoor) Indoor
Accessibility Fixed location - existing
Size Medium sized (5000 - 50.000 persons)
Access Tickets sales
Table 11. Public profile Racoon concert
Cohesive Crowd gathered for a specific purpose or reason;
No leadership.
The Brabanthallen (Mainstage) in 's-Hertogenbosch can accommodate 4210 spectators in a regular situation. For
this occasion, 3500 tickets have been made available, which represents an occupancy rate of over 80%. Visitors
for this event are to be typified as “cohesive”, meaning that no extra safety measures have been implemented
other than in- and egress processes.
103.5.2. Safety measures
In order to realise a gradual ingress, arrival time slots were implemented. Table 13 shows the time slots and the
number of visitors per timeslot.
Table 12. Time slots Racoon concert
Timeslots Blue Red
19.00h - 19.15h 435 435
19.15h - 19.30h 435 435
19.30h - 19.45h 435 435
19.45h - 20.00h 435 435
3.5.3. Results
In total, 3252 visitors attended the 3-hour indoor concert. The total visitor group was divided into two separate
‘bubbles’ to test several different logistical processes regarding bars and wardrobes. Table 14 presents the
general statistics of the event. On average the blue bubble had 29.6 unique contacts (IQR= 17-41) lasting more
than 15 minutes cumulative within 1.5 meters. The red bubble had -on average- a non-meaningful difference in
the number of unique contacts; 25.5 (IQR= 14-35).
Table 13. General statistics Racoon concert
The total number of contacts over time are shown in Figure 7. The most interesting aspect of this graph is that
while no spike in contacts can be seen during the ingress phase of the event, indicating the spread of visitors
using timeslots was very effective, a spike can be noted during the changeover from the preshow to the main
show.
Figure 7. Total number of contacts over time Racoon concert
11Figure 8. Average number of contacts per visitor over time for lockers/wardrobe (left) and bars (right) Racoon concert
To compare the difference between the use of self-service lockers versus a regular wardrobe regarding the
number of contacts a visitor incurs video analysis is performed. Figure 8 illustrates the average number of
contacts a visitor has within 1.5 meters within either the locker/wardrobe area (left) or the bar areas (right). The
results obtained from this analysis seem to indicate that using self-service lockers has a beneficial effect on the
number of contacts a visitor has. The difference in contacts between the two bar areas is negligible.
123.6. Eurovision Song Contest, Ahoy (Rotterdam)
ESC took place from Monday the 17th of May up to and including Saturday the 22nd of May 2021 and was hosted
by Ahoy, Rotterdam. Multiple shows were organised with different starting times. In case it regards a family show
(daytime), the ingress started at 12.30h, and the show started at 15.00h. In case it regards an evening show, the
ingress started at 18.30h, and the show started at 21.00. The show lasted two hours and ended at respectively
17.00h (family show) or 23.00h (evening show), except for the ‘grand final’, which ended at 01.00h on Saturday
night.
In this specific event, the visiting population was not divided into assigned bubbles. Though, the hosting location
Ahoy was filled up according to a predefined principle to spread the audience over the stands.
3.6.1. The event
The risk profile of the event is described in Table 15, Table 16 and Table 17.
Table 14. Activity profile Eurovision Song Contest
Touchpoints (Ingress) Ahoy Rotterdam
Parking Several surrounding car parkings
Entrance Ticket and negative test result
Placing Based on a predefined structure
Visitation Extended, organized by assigned security company
Touchpoints (Circulation)
Beverage Several bars
Food Several take away points/snack bars
Toilets Multiple fixed toilet locations
Entrance process Through entrance gate manned by steward(s)
Exit process Via exit gate manned by steward(s)
Routes Via signage
Touchpoints (Egress)
Parking Several surrounding car parkings
Exit Guided by stewards
Table 15. Spatial profile Eurovision Song Contest
Spatial Profile
Event location Ahoy Rotterdam
Event type Indoor passive
Sort event Public event
Event specification Music event
Attractiveness Mondial
Duration Several days during daytime and evening
Location (indoor/outdoor) Indoor
Accessibility Fixed location – Existing
Size Medium sized (5.000 -50.000 visitors)
Access Tickets sales
Table 16. Public profile Eurovision Song Contest
Cohesive Crowd gathered for a specific purpose or reason;
No leadership.
13The event site in Rotterdam can accommodate 16.426 visitors. A maximum of 3.500 tickets has been sold for this
occasion. In total, 9 shows were executed which computes to a total number of visitors of 31.500. This leads to
an occupancy rate of 21%. However, visitors where placed in a setting representing a 100% occupancy rate.
Visitors for this event are to be typified as “cohesive”, meaning that no extra safety measures have been
implemented other than in- and egress processes.
3.6.2. Safety measures
In order to realise a gradual ingress, arrival time slots were implemented. Time slots had a duration of 15 minutes
and the ingress was distributed over 1 hour and 45 minutes. Table 18 shows the time slots and the number of
visitors per timeslot for the evening shows. The distribution of time slots was set up similar for the afternoon
shows.
Table 17. Time slots Eurovision Song Contest
Time slots evening shows First Ring Second ring Total
18.30h - 18.45h 300 154 454
18.45h - 19.00h 321 180 501
19.00h - 19.15h 369 93 462
19.15h - 19.30h 328 150 478
19.30h - 19.45h 372 117 489
19.45h - 20.00h 321 216 537
20.00h - 20.15 301 239 540
Total 2312 1149 3461
3.6.3. Results
Over the course of one week, 9 shows with a total of approximately 31.500 visitors were held (3.500 visitors per
show). Due to the scale and level of production, the use of the UWB contact tracking devices was not possible.
Therefore, video analyses are performed. Additionally, data was gathered using a mobile application operative
on Bluetooth Low Energy, which visitors were requested to download. The results of this data collection method
can be found in a separate report.
Several different in- and egress scenarios were tested throughout the events. In addition to this, adjustments
concerning flow were suggested based on the near real-time analysis, to improve the circulation.
Ingress
For the first three shows, visitors were supposed to be guided on their route by the signage. However, signage at
the outside of the venue referring visitors to the 1st and 2nd ring was barely eye-catching, which resulted in the
routes not being utilized and thus ingress scenario test did not succeed. The filling of the grandstands was based
on timeslots, filling the arena from back to front.
It was observed that one of the bars was specifically busy before the start of the show (Figure 9). This bar (bar
level 3 – north) is a bar all visitors on the 2nd ring would pass on their way to their seat. Another bar (bar level 3 –
south) was open to visitors, however, visitors would have to walk further along the circuit. It was advised to refer
visitors in the early timeslots (and thus seated in the back of the arena, south) to the bar on the south of the
circuit. The results of this management intervention can be observed in the third graph.
Figure 9. Number of contacts over time for show 7, 8 (before intervention) and 9 (after intervention) Eurovision Song
Contest
14Circulation
After the first three shows, the merchandise stand was relocated, since the stand on the 1st ring had caused a
queue of over 100 visitors in the shows before. In addition, the video analysis dashboard had measured a
negative sentiment. The location of the stand was not quite optimal; in a narrow hallway which was also a central
point in the circuit. The merchandise stand on the 2nd floor was relocated to the ground floor, at the entrance of
the building, to relieve the pressure from the stand on the 1st floor. The queues would still arise on the ground
floor, but there was sufficient space to prevent crowding.
Figure 10. Number of contacts over time at 1st ring circuit for show 3 (before intervention) and 6 (after intervention)
Eurovision Song Contest
Egress
As mentioned before, every show is executed three times. The first two shows have a dummy scoring, whereas
the third live show is the actual scoring based on televoting. During the first two shows, it is noticeable visitors
leave before the show ends, during the dummy scoring. The egress takes about 45 to 60 minutes, in contrast to
the live show egress, which takes about 30 minutes.
It was observed that during egress, most of the visitors used the west exit, a logical occurrence since this was the
shortest route for most visitors. It was advised to redistribute the crowd, by referring visitors to the east staircase
when advisable, based on the real-time situation. This has resulted in a more evenly distributed crowd along the
egress route.
Figure 11. Number of contacts over time during egress per exit route (west/east) for show 7 (before intervention), 8 and
9 (after intervention) Eurovision Song Contest
153.7. Conclusion type II
Management interventions such as referring visitors to a different bar and/or exit have proven to have a positive
effect on the number of contacts. Design interventions like queuing systems at facilities such as bars or
wardrobes result in a higher number of contacts within 1,5 metres than an unstructured system would. However,
the duration of the contacts is not measured and it might well be that queuing systems may still have a positive
effect on the number of critical contacts (more than 15 minutes) a visitor has, since the area is designed to
improve the flow and thus prevent the duration a visitor would have to spend in that area. As for the processes
within the facilities, it is observed that using self-service lockers has a beneficial effect on the number of contacts
compared to a manned wardrobe. Pre-ordering drinks via a QR code, however, has no impact on the number of
contacts compared to ordering at the bar.
Regarding critical contacts (15 minutes), which are only measured at the Racoon concert, visitors
had on average 26-30 contacts. Compared to the type II pilot event in phase I with a somewhat similar type of
music and an occupancy rate of 90%, visitors had an average of 39 contacts. Increasing the maximum allowed
number of visitors does not seem to have a significant impact on the number of critical contacts a visitor has
during his attendance.
164. Type III events
The definition of event type III, as described in Pilots for 'Low-Contact Events’ (Fieldlab Evenementen, 2020);
outdoor active is characterised as an event that takes place outside and has an active character. Visitors are
enthusiastic, sociable, and exuberant and have an 'assigned' place to sit/stand. This allocated seat/standing place
is part of a specific bubble that each has explicit rules and measures.
4.4. International match NED-LAT, Johan Cruijff ArenA (Amsterdam)
On Saturday, March 27th 2021, the third type II event, initiated by Fieldlab events, took place in the Johan Cruijff
ArenA. The event was a sporting event organised by KNVB and UEFA. The ingress of the game started at 17.30h
and the game ended at 19.45h.
4.4.1. The event
The risk profile of the event is described in Table 19, Table 20 and Table 21.
Table 18. Activity profile international soccer match
Touchpoints (Ingress) Football Match NED-LET
Parking Nearby car park
Entrance Ticket, negative test result and after receiving tag
Placing Based on bubbles
Visitation Applicable
Touchpoints (Circulation)
Beverage Bars
Food Snackbar
Toilets At location
Entrance process Through entrance gate manned by steward(s)
Exit process Via exit gate manned by steward(s)
Routes Via signage
Touchpoints (Egress)
Parking Nearby parking area
Exit Accompanied by stewards and after return of tags
Table 19. Spatial profile international soccer match
Spatial Profile
Event location Johan Cruijff ArenA
Event type II. Indoor active
Sort event Public event
Event specification Sports event
Attractiveness national
Duration Daytime
Location (indoor/outdoor) Indoor / outdoor
Accessibility Fixed location - existing
Size Medium sized (5000 - 50.000 persons)
Access Tickets sales
17Table 20. Public profile international soccer match
Expressive Crowd gathered for a common purpose;
Under loose leadership or following a specific motive;
Not aggressive, but parts of the crowd become slightly antisocial;
May require active involvement of authorities.
The Johan Cruijff Stadium in Amsterdam can accommodate 55.500 spectators in a regular situation. For this
occasion, 5000 tickets have been made available, which represents an occupancy rate of about 9%. Visitors for
this event are to be typified as “expressive”, meaning that during in- and egress processes extra security measures
has been implemented, for example with stewards.
4.4.2. Safety measures
In order to realise a gradual ingress, arrival time slots were implemented. Table 22 shows the time slots and the
number of visitors per timeslot.
Table 21. Time slots international soccer match
Timeslots Entrance 3 Entrance 5
16.30h - 16.45h 250 250
16.45h - 17.00h 250 250
17.00h - 17.15h 250 250
17.15h - 17.30h 250 250
4.4.3. Results
On March 27th 2021, 5000 spectators were able to attend the UEFA soccer match between the Netherlands and
Latvia. Out of these 5000 spectators two distinct bubbles of roughly 2000 spectators participated in our pilot
event. Seating patterns as planned by UEFA were compared with the results of type III results of phase 1 of the
research program. Bubble 3 will be seated by stewards in a chessboard pattern with 50% capacity, Bubble 5 will
have a 75% capacity with assigned seating.
Table 22. General statistics international soccer match
Table 23 presents the general statistics of the event. On average the bubble 3 had 6.6 unique contacts (IQR= 4-8)
lasting more than 15 minutes cumulative within 1.5 meters. Bubble 5 had -on average- a slightly higher number
of unique contacts; 8.7 (IQR= 6-11).
18As shown in Figure 12, during the game itself, when all contacts are considered, the number of contacts is low.
During halftime, the number of contacts rises. Further analysis of the total number of contacts over time shows
that a visitor in bubble 5 has on average a higher number of contacts than a visitor in bubble 3 during ingress
and halftime.
Video analyses (Figure 13) shows that the number of contacts at the bar areas is similar across both bubbles
meaning these extra contacts occur elsewhere. When zooming in on the specific section (Figure 14) the difference
in occupation rate is very much visible.
Figure 13. Number of contacts at the bar areas international soccer match
Figure 14. Number of contacts at the sections international soccer match
194.5. Conclusion type III
Figure 15 compares the findings of the type III pilot events as organized during phase I of the research program
with those organized during phase II. From this data, we can see that that the results are in line with previous
conclusions. Increasing the maximum allowed number of visitors does not seem to have a significant impact on
the number of critical contacts a visitor has during his attendance.
205. Conclusion
The results presented in this report are focused on the similarities and differences in visitor dynamics in ‘small
scaled’ events, as executed in phase I of the research project, in comparison to the events with a larger number
of visitors (scale-ups).
The scale-ups conclude that the results are in line with the research results from phase I. For type I, II and III
events, the results indicate that increasing the maximum allowed number of visitors does not seem to have a
significant impact on the number of critical contacts a visitor has during his attendance.
Two suggestions can be made to decrease the number of contacts. First, management interventions such as
referring visitors to a different bar, route, etc., based on density as monitored in video analyses software. Second,
self-service lockers are preferred to manned wardrobes. In general, the use of time slots and the prevention of
bottlenecks by aligning processes is advised.
216. Bibliography
Fieldlab Evenementen. (2020, oktober 19). Pilots
voor 'Low-Contact Events'. Retrieved from
www.fieldlabevenementen.nl
Logistics Community Brabant. (2020, oktober 30).
Onderzoeksresultaten. (J. van de Pas, I.
Kamphorst, J. Coolen, & M. van Rijn, Eds.)
Logistics Community Brabant.
Memish, Z., Steffen, R., White, P., Dar, O., Azhar, E.,
Sharma, A., & Zumla, A. (2019, May 18).
Mass gatherings medicine: public health
issues arising from mass gathering
religious and sporting events. Lancet,
393(10185), 2073-2084. doi:10.1016/S0140-
6736(19)30501-X
Still, G. (2014). Introduction to Crowd Science. Taylor
& Francis Group.
van den Brand, R., & Abbing, M. (2003). Leidraad
veiligheid publieksevenementen. Arnhem:
Nibra.
van Rijn, M., & van Damme, D. (2011).
Evenementenlogistiek. De realisatie van
evenementenconcepten in veilige en
servicegerichte omgevingen. MB Advies &
training.
22You can also read