Identification of flavour in fresh feijoa fruit
←
→
Page content transcription
If your browser does not render page correctly, please read the page content below
Faculty of Natural Resources and
 Agricultural Sciences

   Identification of flavour in fresh feijoa
                                          fruit

Angelica Nyström

 Agronomy Programme• Food Science •
 Bachelor thesis• 15 HEC • Ground level, G2E
 Publikation/ Sveriges lantbruksuniversitet, Institutionen för livsmedelsvetenskap, no 375
 Uppsala 2013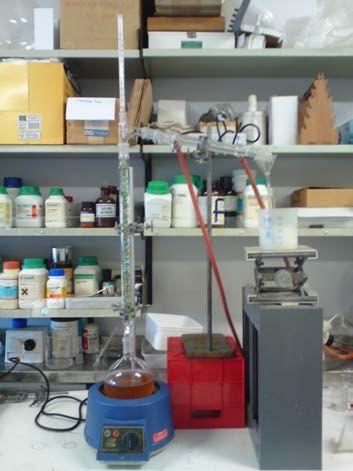
Identification of flavour in fresh feijoa fruit
Angelica Nyström

Supervisor:                    Associate Professor Geoffrey Savage, Lincoln University,
                               Christchurch, New Zealand

Examiner:                      Lena Dimberg

Credits: 15 hec
Level: Ground, G2E
Course title: Independent project in food science
Course code: EX0669
Programme/education: Agronomy program

Place of publication: Uppsala
Year of publication: 2013
Cover picture: Own
Title of series: Publikation/Sveriges lantbruksuniversitet, Institutionen för
livsmedelsvetenskap, no:375
Online publication: http://stud.epsilon.slu.se

Keywords: feijoa fruit, extraction, distillation, organoleptic evaluation, gas chromatography-
mass spectrometry, D-limonene, cis-rose oxide

  Sveriges lantbruksuniversitet
  Swedish University of Agricultural Sciences

  Department of Food Science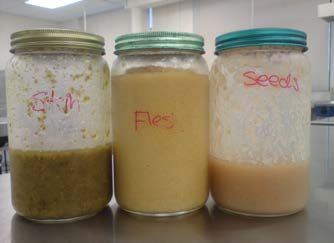
Abstract

The aim of this study was to extract and identify volatile flavour components from peel, flesh
and seeds of feijoa fruit separately and further determine its flavour profile. Obtained
information is aimed to be used to develop a new flavour mixture for the food industry. The
volatile flavour fraction of feijoa fruit flesh, seeds and skin were isolated by ethanol extraction
and steam distillation. Further an organoleptic evaluation was carried out to distinguish
flavour differences within the obtained distillates to decrease the number of samples to be
analysed by gas chromatography and gas chromatography-mass spectrometry. Gas
chromatography analysis resulted in 13 identified flavour compounds of the 23 reference
compounds used. Results showed gas chromatography-mass spectrometry to be most
successful and this technique presented a great amount of data of which seven compounds
are reported for the first time as flavour compounds of feijoa fruit; citronellyl acetate, cis-rose
oxide, geraniol acetate, isoamyl acetate, ethyl octanoate, D-limonene and humulane-1,6-dien-
3-ol. Further analysis is needed to evaluate the extent of unique findings of flavour
compounds and to evaluate how they contribute to the flavour of feijoa fruit to be able to
produce a flavour mixture for the food industry.

Key words: feijoa fruit, extraction, distillation, organoleptic evaluation, gas chromatography-
mass spectrometry, D-limonene, cis-rose oxide.
Table of contents

Abstract ...................................................................................................................................................... 1

Table of contents ....................................................................................................................................... 2

Acknowledgements.................................................................................................................................... 4

1.      Introduction ....................................................................................................................................... 5

     1.1 The flavour of feijoa fruit ................................................................................................................. 5

     1.2 What is a flavour? ............................................................................................................................ 6

     1.3 Extraction of volatile flavour components....................................................................................... 6

        1.3.1 Gas Chromatography/Mass Spectrometry ............................................................................... 7

     1.3.2 Aim of project ............................................................................................................................... 8

2.      Materials and methods ...................................................................................................................... 9

     2.1 Extraction of flavour components ................................................................................................... 9

        2.1.1 Sample preparation .................................................................................................................. 9

        2.1.2 Distillation ................................................................................................................................. 9

        2.1.3 Organoleptic evaluation.......................................................................................................... 10

     2.2 Identification of flavour components ............................................................................................ 11

        2.2.1 Gas Chromatography (GC) ...................................................................................................... 11

        2.2.2 Gas Chromatography-Mass Spectrometry (GC-MS) ............................................................... 12

3.      Results and discussion ..................................................................................................................... 13

     3.1 Extraction method of flavour components.................................................................................... 13

        3.1.1 Sample preparation and distillation........................................................................................ 13

        3.1.2 Organoleptic evaluation.......................................................................................................... 13

     3.2 Identification of flavour components ............................................................................................ 14

        3.2.1 Gas Chromatography (GC) ...................................................................................................... 14
                                                                                                                                                               2
3.2.2 Gas Chromatography-Mass Spectrometry (GC-MS) ............................................................... 18
3.2.3 GC versus GC – MS .................................................................................................................. 21
4. Conclusions .......................................................................................................................................... 22
References ............................................................................................................................................... 23
Electronic references .......................................................................................................................... 24
Appendix .................................................................................................................................................. 25
Appendix 1 - Identification of flavour compounds .............................................................................. 25
Appendix 2 – GC extraction ................................................................................................................. 26
Appendix 3 – GC-analysis results of combined fractions ..................................................................... 29
Appendix 4 ........................................................................................................................................... 30
Appendix 4a - Experimental data and identified compounds for fractions of the flesh extract ..... 30
Appendix 4 b - Experimental data and identified compounds for fractions of the skin extract ..... 32
Appendix 4 c - Experimental data and identified compounds for fractions of the seeds extract ... 36
3Acknowledgements
I would like to thank my supervisor Geoffrey Savage for his support and for giving me the
opportunity to carry out this project in New Zealand.
I appreciate the assistance from Phil Edmonds the flavourist and would like to thank David
Rout the Managing Director of Formula Foods, Christchurch.
I would like to thank Leo Vanhanen for his help setting up the extraction system and
performing GC-MS analysis.
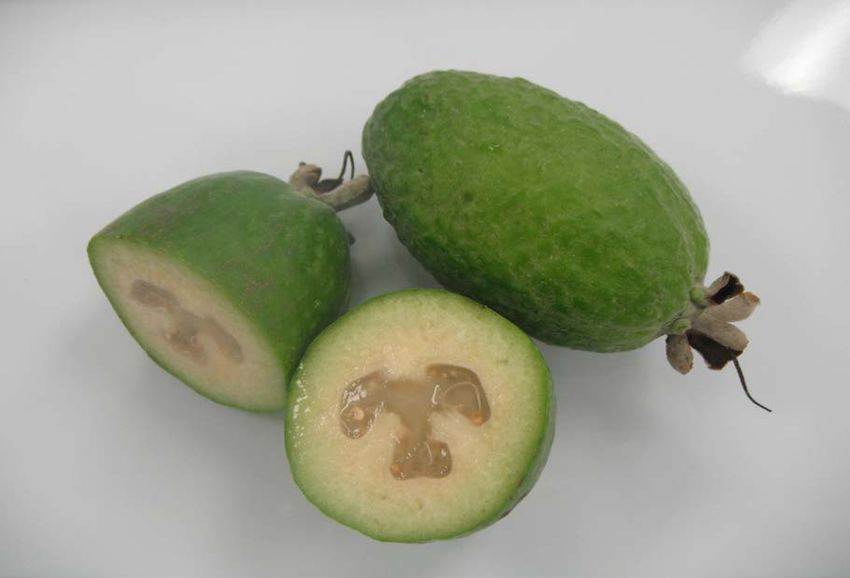
4Identification of flavour in fresh feijoa fruit
1. Introduction
Feijoa sellowiana Berg is a shrub native to South America and is a close relative of the guava
(Psidium guajava L.) (Hardy & Michael, 1970). Because the feijoa plant can tolerate a wide
range of climatic and soil conditions, it is grown either as an ornamental or exploited
commercially in warm temperate areas of the world for its fruit which is consumed fresh or
processed (Shaw, Allen & Yates, 1989; Hardy & Michael, 1970). Feijoa fruit is used to
manufacture products such as juice, jam, ice-cream, chutney and fruit smoothies. The two
major flavour sensations in most fruits are sweetness and sourness which mainly are due to
sugars and non-volatile acids. Bitterness and astringency are not generally considered
desirable flavour characteristics in fruits although if adequately masked by sugars, low levels
of these attributes may well add body and depth of flavour. When producing a food product it
is important to consider its flavour and aroma as both are important parameters that affect
the acceptability of a product. It is also important to consider the presence of trace amounts
of volatile components since they contribute a lot of character to fruits and their processed
products (Williams, 1979).
1.1 The flavour of feijoa fruit
The flavour of feijoa fruit or pineapple guava (F. sellowiana Berg) is characterized by its high
content of the flavour compounds methyl benzoate and ethyl benzoate. Hardy & Michael
(1970) distilled volatiles from intact fruit and showed that methyl benzoate and ethyl
benzoate constituted of 90% of the flavour and they provided much of the distinctive aroma
which is characteristic of feijoa fruit. Both esters have a similar odour but the methyl ester is
much stronger. Although benzoate esters have been detected in other fruits, the feijoa is the
only fruit examined in which benzoate esters are the major aroma compounds (Hardy &
Michael, 1970). Data presented from another analysis of intact feijoa fruit showed that esters,
generally important in fruit for their flavour contribution, constituted approximately 93% of
the aroma concentrate. Further preliminary sensory evaluation experiments suggested that
5only methyl benzoate, ethyl benzoate and ethyl butyrate had feijoa-like aroma qualities. Ethyl
butyrate was considered to be contributing significantly to the aroma of intact feijoa fruit
(Shaw, Ellingham & Birch, 1983).
1.2 What is a flavour?
The four basic taste sensations are sweet, salty, sour and bitter (Seidman, 1979). The term
aroma is used to describe the ‘intangible conception’ of odour and flavour. Aroma could also
be referred to as a processed raw material used by the flavourist (Arctander, 1960).
Flavour is often explained as a combination of taste and aroma (Laing & Jinks, 1996). The
flavour of food is caused by chemical substances present in the food and consists of a
combination of taste, odour and other sensations. When considering flavour components it is
usual to divide these into volatiles and non-volatiles (Williams, 1979). Taste is caused by
stimulation of the gustatory cells of the buccal surface of the tongue by soluble substances,
most of them non-volatile released from the food into the saliva. Flavour and aroma are said
to be obtained mainly due to odorous volatile substances being released from the food into
the air in the mouth and further carried to the olfactory epithelium in the nose (Laing, 1979;
Wiliams, 1979). What is recognized as the response to an odour is dependent on the amounts
of those volatile substances which are released into the air from food and reaching the
olfactory sensors as well as the interaction with the perceiving organism (Laing, 1979).
1.3 Extraction of volatile flavour components
Flavour extraction can be demanding due to several factors including their presence in very
low concentrations in food products and fruits. In foods the concentrations of the volatile
components cover a wide range where the major volatile components vary from 10-3 to 10-1
mg/litre while those of the trace constituents may be as low as 10-7 mg/litre. Even those
constituents of really low concentrations might be important odour constituents since odour
threshold values as low as 10-9 mg/litre has been detected (Acree, 2005; Bebelmans, 1979).
To identify flavour compounds in food products it normally requires initial isolation from the
bulky constituents of the food combined with substantial concentration; for example using
6distillation. It is important to minimize the distortion of the native composition, especially
when studying the quality of flavours. Distillation techniques have the advantage to assure
adequate isolation of compounds of higher boiling points and low concentrations but
precautions have to be taken to ensure that volatile flavour compounds remain unchanged
during their isolation or concentration since some volatiles are heat sensitive or reactive and
so are easily lost. There is a risk for formation of new volatiles, artefacts, due to reactions
between chemical constituents of a food matrix (Bebelmans, 1979).
The use of gas-liquid chromatography and mass spectrometry enables detection of trace
compounds of small concentrations as well it enables work with smaller amounts of food
concentrates. Areas of the chromatogram or certain peaks can be detected by smell during
analysis using GC-MS and its odour is described (Seidman, 1979). The relative amount of
components in an odour concentrate prepared from the product is not the same as those in
the vapour. Such differences of ratios may affect the odour (Bebelmans, 1979).
Mass spectrometer analysis makes it possible to determine the chemical structure of the
unknown compound and this can be verified by comparison with authentic compounds
(Seidman, 1979).
1.3.1 Gas Chromatography/Mass Spectrometry
A gas chromatograph (GC) separates components of a mixture while the mass spectrometry
gives structural information of each component. If standards of known concentration are
used together with the unknown compounds gas chromatography/mass spectrometry can
also provide quantitative data.
Gas chromatography analysis of a mixture involves the injection of a dilute solution (1µl or
less) into a head port of the gas chromatograph. The sample is evaporated and swept by a
flow of inert gas into a capillary column. The capillary column is a tube with a normal length of
10-30 m and width of 0.1-0.5 mm. It is contained within a chamber (‘oven’) and the
temperature can be varied according to the volatility of the analysed samples. A stationary
7phase is usually coating the inside of the capillary column and the stationary phase is often a
non-polar silicon based polymer.
As molecules of the sample are swept by the inert gas through the column, the molecules
travel at different rates. The rate they are travelling is dependent on their boiling points and
the degree of affinity for the stationary phase. The higher boiling point or the stronger affinity
for the stationary phase the longer time it will take for the molecule to pass through the
column. The length of time it takes for a compound to pass the column is called retention
time. There is also a partition of the compound between the gas phase and the liquid phase;
if the compound spends more time in the liquid phase it gets retained on the column and
comes out later on.
When the components exit the gas chromatograph one by one it travels into the mass
spectrometer. Molecules of the sample get bombarded by electrons; ions and fragments of
the molecule are formed resulting in a mass spectrum. One mass spectrum is formed for
every molecule (Solomons & Fhryle, 2006).
1.3.2 Aim of project
To extract and identify volatile flavour components from peel, flesh and seeds of feijoa fruit
separately and further determine its flavour profile. This information is needed to be able to
develop a nature identical feijoa flavour; a product that does not exist on the market.
82. Materials and methods
2.1 Extraction of flavour components
2.1.1 Sample preparation
Approximately 4.7 kg of feijoa fruit of unknown variety was purchased from a Gordon’s
vegetable market in Prebbleton, Christchurch, New Zealand, and stored at room temperature
(25°C) during 4 days until ripe and ready for use. Approximately 2 kg of ripe feijoa fruit were
picked out and peeled to an approximate depth of 1 mm. Fruit flesh, seeds and peel were
collected separately.
Fractions of flesh, seeds and peel were weighed and
ethanol was added in a 2:1 ratio. The samples were further
homogenized for 2 minutes using a Cascade Blender
(Model No. CE071BR, China). The fruit-ethanol mixtures
was poured into 1 l glass jars and flushed with nitrogen gas
to avoid oxidation during storage. The sealed glass jars
Figure 1. Feijoa skin, flesh and
seed extracts were placed in a fridge at 4°C for seven days to allow the
flavour fractions to be extracted into the ethanol from the homogenised tissue.
2.1.2 Distillation
A distillation method to extract and separate volatile flavour components of fresh feijoa fruit
was developed. There is no previous work published where feijoa seeds have been extracted
separated from the fruit flesh.
In the first trial extracts were poured directly into round glass flasks which were placed on a
heating mantle and connected to a water-cooled condenser. When the required temperature
(78°C) for extraction was reached the fruit puree extracts started to burn.
9The method was modified by filtering the extracts to
separate the fruit puree (the non-volatile food matrix)
from the liquid fraction of ethanol using glass microfiber
filters (11.0 cm, GF/C) and an electric vacuum pump. The
filtered extracts were placed in a round bottomed flask
on a heating mantle. The vapour passed through an 80
cm long glass condenser tube. Glass marbles were placed
inside the tube in order to increase the surface that the
vapour needed to pass through. The purpose of the
increased surface was to improve separation of volatile
flavour components within the vapour. A cooling system Figure 2. Distillation apparatus
of water was used to condense the vapour. Fractions were collected in 50 and 100 ml round
bottle flasks which were enclosed by glass caps and further cooled in an ice-bath.
Temperature of evaporates was recorded as fractions were collected. New fractions were
aimed to be collected for every 1°C increase to ensure separation and isolation of volatile
flavour compounds; it is known that volatile compounds evaporate at different temperatures
and this is dependent on its molecular weight. Distillation proceeded until at least one
fraction had been collected at a temperature of 100°C; the boiling point of water. Fractions
were collected for approximately 3-5 hours per fruit extract. Collected fractions were stored
sealed in a domestic fridge (4°C) until further analysis could be performed.
2.1.3 Organoleptic evaluation
An organoleptic evaluation was performed of seed, flesh and skin fractions by making 1%
dilutions with water of each fraction. Fractions were sniffed and tasted to identify differences
of flavour within each fraction of seed, flesh and peel separately. Fractions of similar flavour
features were grouped and analysis was carried out before gas chromatography and gas
chromatography – mass spectrometry was commenced.
102.2 Identification of flavour components
2.2.1 Gas Chromatography (GC)
Gas chromatography (GC) was used to separate and identify volatile components of feijoa
fruit distillates of seed, flesh and skin. Samples representing all fractions of distilled fruit flesh,
peel and seed extracts were analysed separately to obtain an overall view of their flavour
profile.
Further GC was used to determine if the distillation technique was effective by analysing
whether the flavour compounds had been successfully separated. Results of the organoleptic
evaluation were used; grouped fractions of fruit flesh, seeds and skin distillates were analysed
separately. Gas chromatography analysis was performed using a Hewlett Packard model 5890
capillary column gas chromatograph equipped with a flame ionization detector (FID).
Separation was carried out using a 30 m x 0.25 mm DB wax column. A 5 µl sample at room
temperature (25°C) was injected for each run. The syringe was cleaned with ethanol in
between injections followed by a flush through with sample before a new injection. The
column temperature program for analysis was set to an initial temperature of 50°C which was
held for 10 minutes. The temperature was then increased 5°C/minute up to a temperature of
220°C which was held for 20 minutes.
To be able to identify peaks of the obtained GC – chromatograms and to get an approximate
quantification reference compounds were analysed. Reference compounds were grouped
into four samples using Kovats retention indices (Kovats, 1958) to obtain separated peaks and
thereby simplify analysis of the chromatograms. Chosen reference compounds (see Appendix
1) were added in the ratio of 1:1 in each sample. A similar GC set up to the previously
mentioned analysis was used, the only difference being a reduction of the amount of sample
being injected to the column which was decreased to 3 µl. The purpose of decreasing the
amount of sample for injection was to adjust the height of peaks in the resulting
chromatograms. Identification of flavour compounds was obtained by comparing peaks of the
analysed fruit distillates with peaks of analysed reference compounds.
112.2.2 Gas Chromatography-Mass Spectrometry (GC-MS)
To determine the total contents of flavour compounds in feijoa fruit distillates GC-MS analysis
was performed. GC-chromatograms of single fractions of flesh, skin and seeds were analysed
separately and those of different profiles from a flavour point of view were chosen for further
analysis using the GC-MS technique.
A SPME (solid-phase micro extraction) column was used to prepare the sample for injection
into the GC-MS. Ethanol extract (20 µl) was pipetted into a 20 mL SPME vial containing 8.98
mL of deionised water. Further 3 g of sodium chloride was added and the vial was capped.
The volatiles were extracted from the headspace of the SPME vial at a temperature of 50°C
for 40 minutes. Desorption time was 5 minutes at 50°C. The SPME fibre used was a
DVB/CAR/PDMS 2 cm version Supelco (Sigma-Aldrich Pty. Ltd., Sydney, Australia).
The injection port was set to 250°C and the oven was initially set at 30°C and held for 5
minutes. The temperature was then increased 5°C/ 5 minutes up to a temperature of 240°C.
The flow rate used was 1 mL/min linear velocity (29.3 cm/s) with a splitless initial injection of
3 minutes and then a 20:1 split. The mass spectra interface was set to 250°C with the ion
source set to 200°C. The scan range was 33 m/z – 450 m/z. The NIST standard reference
database 05 (National Institute of Standards and Technology, Gaithersburg, MD, USA) was
used to identify the output peaks.
123. Results and discussion
3.1 Extraction method of flavour components
3.1.1 Sample preparation and distillation
To extract volatile flavour components of fresh feijoa fruit two trials were performed. The first
trial failed due to an excess of fruit material in the sample which got caramelized and burnt
during heating. The distillation could not be carried out. Even if the sample had not been
burnt the caramelization would still have had a negative influence on the results due to a
development of new flavour compounds from the caramelization process. The second trial
was successful and the fruit material was removed by filtration; heating could be performed
without the extracts becoming burnt. As a result fractions could be collected at different
temperatures. Data from the collection of fractions can be found in Table I-III in Appendix 2.
Analysis of chromatograms representing the extracts of flesh, seeds and skin (See Appendix 3,
Fig. I-III) indicates a successful distillation; volatile flavour components of the feijoa fruit
extracts have been extracted and peaks of the chromatograms have been successfully
separated. Data analysis of chromatograms representing the last distilled fraction of each fruit
extract of seeds, flesh and skin (see Appendix 4a-c) indicated a successful extraction of
volatile flavour components; only a few peaks were recorded in these chromatograms and
they consisted of a high proportion of solvents.
3.1.2 Organoleptic evaluation
The aim of the organoleptic evaluation was to distinguish flavour differences between
fractions of distilled fruit extracts of skin, seeds and fruit peel. Fractions of similar flavour
features were grouped to reduce the number of samples for further evaluation using gas
chromatography. The organoleptic evaluation resulted in six new fractions per fruit extract
being prepared (see Table 1). The last fraction of each extract had an odour characterized as a
still-odour; a smell that can be compared to gunpowder. This is a common phenomenon using
the distillation technique and is well known in the analysis of essential oils (Arctander, 1960).
The problem could have been avoided by leaving the samples to age in a temperature of 12-
1315°C for one to several months or by aerating the samples in open containers (Arctander,
1960). Due to time constrains and the risk of losing volatile flavour compounds of interest this
was not carried out.
Table 1. Results of the organoleptic evaluation presenting grouped fractions and sample numbers
Fruit extract Fraction no. Sample no.
Skin 1-5 S1
6-7 S2
8 S3
9-13 S4
14-16 S5
17-18 S6
Seeds 1-4 F1
5-9 F2
10-12 F3
13-15 F4
16 F5
17-18 F6
Flesh 1-5 K1
6-12 K2
13 K3
14-16 K4
17-18 K5
19 K6
3.2 Identification of flavour components
3.2.1 Gas Chromatography (GC)
Gas chromatography (GC) was performed to determine whether the separation of volatile
flavour compounds using the distillation technique had been successful and to detect volatile
flavour compounds that contribute to the flavour of fresh feijoa fruit. GC-analysis was used to
investigate whether flavour compounds of feijoa fruit extracts had been successfully
separated and to detect which flavour compounds there were within the different extracts of
skin, flesh and seeds.
14Samples representing all fractions of distillates were analysed to obtain an overall view of the
flavour profile for fruit flesh, peel and seeds separately resulting in three GC-chromatograms
(see Appendix 3, Fig. I-III) which suggested a large number of flavour compounds in each
extract. The retention times of the peaks in these chromatograms were compared with
retention times of reference compounds (see Appendix 1) to identify flavour compounds.
Experimental data and identified flavour compounds for fruit flesh, seeds and peel
respectively are presented in Table 2-4.
Table 2. Data from GC- analysis of combined seed fractions and identified flavour compounds
Peak Retention time Area Compound
(no.) (min) (%)
1 2.797 0.00042 Unidentified
2 4.065 0.00054 Unidentified
3 4.171 0.00096 Unidentified
4 5.462 99.9726 Ethanol
5 22.940 0.00269 2-nonanone
6 30.191 0.01778 Methyl benzoate
7 31.345 0.00425 Ethyl benzoate
8 35.579 0.00083 Geraniol
Table 3. Data from GC- analysis of combined flesh fractions and identified flavour compounds
Peak Retention time Area Compound
(no.) (min) (%)
1 4.148 0.00112 Unidentified
2 5.507 99.97722 Ethanol
3 20.318 0.00088 Cis-3-hexenyl acetate
4 22.905 0.00024 2-nonanone
5 25.242 0.00174 Unidentified
6 25.681 0.00101 Unidentified
7 30.151 0.01340 Methyl benzoate
8 31.305 0.00197 Ethyl benzoate
9 39.918 0.00070 Unidentified
10 41.950 0.00182 Unidentified
15Table 4. Data from GC- analysis of combined skin fractions and identified flavour compounds
Peak Retention time Area Compound
(no.) (min) (%)
1 3.240 0.0002 Unidentified
2 4.142 0.00088 Unidentified
3 5.293 99.83523 Ethanol
4 17.615 0.00157 Unidentified
5 22.894 0.00498 Cis-3-hexanol
6 25.245 0.00100 Unidentified
7 25.669 0.00130 Unidentified
8 27.819 0.00468 Linalool
9 30.147 0.01496 Methyl benzoate
10 31.300 0.00444 Ethyl benzoate
11 31.952 0.00393 Unidentified
12 35.537 0.00279 Geraniol
13 39.476 0.00125 Unidentified
14 39.826 0.00170 Unidentified
15 39.927 0.00876 Unidentified
16 40.387 0.00614 Unidentified
17 40.513 0.00153 Unidentified
18 40.642 0.00455 Unidentified
19 40.852 0.00755 Unidentified
20 41.373 0.00248 Unidentified
21 41.495 0.00316 Unidentified
22 41.679 0.00215 Unidentified
23 41.839 0.00300 Unidentified
24 41.960 0.02478 Unidentified
25 42.582 0.00667 Unidentified
26 42.777 0.00621 Unidentified
27 43.103 0.00770 Unidentified
28 43.328 0.00531 Unidentified
29 43.895 0.00541 Unidentified
30 44.026 0.01981 Unidentified
31 44.193 0.00238 Unidentified
32 44.520 0.00149 Unidentified
33 55.491 0.00227 Unidentified
To detect flavour compounds samples of fruit flesh, seeds and skin (see Appendix 1, Table 1)
were analysed separately resulting in 18 GC-chromatograms; six chromatograms per fruit
fraction (see Appendix 4a-c). Using the GC-technique 13 of 23 reference compounds were
identified within the single fractions of flesh, skin and seed extracts (see Appendix 4a-c).
There were several peaks of which there were no matches to the analysed reference
16compounds (see Appendix 1 for analysed reference compounds). Further there were peaks
within the chromatograms of the various samples that were not detected by the GC-
equipment; this was probably due to very low concentrations of volatile flavour compounds
within these samples that could not be identified using this method.
Among the samples of gathered fractions feijoa peel resulted in the highest number of
detected compounds (33 peaks) followed by flesh (15 peaks) and seeds (10 peaks), see
Appendix 4a-c. These results were expected since similar results have been presented by
Shaw et al. (1989) who reported that the skin oil fraction of feijoa fruit was more complex
than the flesh fraction.
3.2.1.1 Seeds
Analysis of the GC - chromatogram presenting the overall content of flavour compounds
within the seed extract (see Table 2) resulted in five identified flavour compounds. Meanwhile
analysis of chromatograms presenting the single fractions resulted in seven detected
compounds in total (see Appendix 4c). This indicates that it is necessary to analyse samples of
higher concentrations to assure detection and identification of as many flavour compounds as
possible. Ethyl acetate was a unique finding in this extract (see Table I, Appendix 4c).
3.2.1.2 Fruit Flesh
Analysis of the GC – chromatogram presenting the overall content of flavour compounds
within the fruit flesh extract (see Table 3) resulted in four identified flavour compounds whilst
analysis of chromatograms of single fractions resulted in nine detected compounds (see
Appendix 4a). Among the detected compounds were cis-3-hexenyl butyrate (see Table I-V,
Appendix 4a) and 2-nonanone (see Table II, Appendix 4a) unique findings to the flesh extract.
3.2.1.3 Skin
Analysis of the GC – chromatogram presenting the overall content of flavour compounds
within the skin extract (see Table 4) resulted in five detected flavour compounds in total
whilst analysis of chromatograms presenting the single fractions (see Appendix 4b) resulted in
17seven detected compounds. Linalool (see Table I-III, Appendix 4b) and ethyl propionate (see
Table VI, Appendix 4b) were unique findings to this extract. The detected compounds within
this extract (see Appendix 4b) have also been identified in a previous study performed by
Shaw et al. (1989) in their analysis of the skin oil of feijoa fruit where they identified 36
flavour compounds using the GC and GC-MS technique.
The low frequency of detected compounds was not expected; results presenting the overall
content of flavour compounds within the skin fractions (see Table 4) indicated a higher
frequency of flavour components in comparison to the extracts of flesh (15 identified
compounds) and seeds (10 identified compounds). This indicates a limitation using reference
compounds and GC as a single method to identify every peak within the chromatograms. This
method is very time consuming.
3.2.2 Gas Chromatography-Mass Spectrometry (GC-MS)
GC-MS analysis was performed to identify flavour compounds of the feijoa fruit extracts of
seeds, skin and flesh. Due to time constraints a limited number of samples were analysed
using the GC-MS technique. Which fractions of the seed, flesh and skin distillates were to be
subjected to further investigation was determined by analysis of GC – results (see Appendix
4a-c). Chosen fractions presented different flavour profiles by showing peaks at different
retention times which is very interesting from a flavour point of view. The criteria was fulfilled
by two fractions of the flesh distillates; K1 and K4 (see Appendix 4a, Table I & IV), one fraction
of the skin distillate; S2 (see Appendix 4b, Table II) and one fraction of the seed distillates; F2
(see Appendix 4c, Table II). Results of the GC-MS analysis were analysed using Kovats Indices
(Kovats, 1958). The identity of compounds that had a similarity match less than 90% was
treated with caution. Data of unidentified compounds were excluded from the results.
3.2.2.1 Seeds
In sample F2 there were 76 compounds identified. The flavour compound dominant in this
fraction was ethyl benzoate which had a peak area of 11.64%. Gas chromatography suggested
that ethyl acetate was present in the seed extract. However, this could not be confirmed as
18GC-MS analysis showed that ethyl acetate was not present in the sample. What seemed to be
ethyl acetate in the GC analysis was probably mistaken for isoamyl alcohol as it has a similar
molar mass which is approximately 88 g/mol. A previous study of the flavour profile of fruit
flesh (including seeds) supports this theory since ethyl acetate was not a reported finding
(Shaw, Allen, Yates & Franich, 1990).
Citronellyl acetate was detected within the seed extract of feijoa fruit, a unique finding since
it was not detected in the extracts of flesh and skin and it has not been previously reported as
a flavour constituent of feijoa fruit (Hardy & Michael, 1970; Shaw et al., 1983; Shaw et al.,
1989; Shaw et al, 1990). Its odour is described as floral, green, rose, fruity, citrus, woody and
tropical fruit (The good scents company, a).
Cis-rose oxide and trans-rose oxide were detected within the seed fraction. It is only the cis-
isomer that contributes to the odour (Alters et al., 2010) which is described as red rose,
green, floral and slightly spicy (The good scents company, b). Cis-rose oxide was only found
within the seed fraction and this is the first time that this flavour compound has been
detected in feijoa fruit.
Geraniol acetate and isoamyl acetate are other compounds that are unique findings to the
seed extract of this study and are further reported for the first time as flavour compounds of
feijoa fruit (Hardy & Michael, 1970; Shaw et al., 1983; Shaw et al., 1989; Shaw et al, 1990).
The great amount of new findings of flavour compounds in feijoa is because it is the first time
extraction and GC-MS analysis have been performed on feijoa seeds separately; in previous
work extracts have been a mix of fruit flesh and seeds (Hardy & Michael, 1970; Shaw et al.,
1983; Shaw et al, 1990). Further the improved concentration of volatile flavour compounds
has enabled detection of flavour compounds which are present in very low concentrations.
193.2.2.2 Fruit flesh
In fraction K1 73 compounds were identified and in fraction K4 80 compounds were
identified. The flavour compound dominant in fraction K1 was ethyl butanoate with a peak
area of 18.04% followed by cis-3-hexenyl acetate (9.23%). In fraction K4 was methyl benzoate
dominant with a peak area of 8.42% followed by 3-hydroxy-2,4,4-trimethylpentyl 2-
methylpropanoate (5.13%). Ethyl butanoate, ethyl benzoate and methyl benzoate are known
to contribute to a green or fruity odour (Shaw et al., 1990) and were all found within the fruit
flesh extract. Methyl benzoate is also associated with the characteristic sweet note of fresh
feijoa fruit (Shaw et al., 1989) and has been found in previous work presented by Hardy &
Michael (1970), Shaw et al. (1989) and Shaw et al. (1990). Ethyl octanoate was detected in
one of the fractions of the flesh (see Appendix 4a, Table I) an unique finding in this study and
this is reported for the first time as a flavour compound of feijoa fruit. Its odour is described
as waxy, sweet, musty, pineapple and fruity with a creamy, dairy nuance and it has similar
taste properties (The good scents company, c).
3.2.2.3 Skin
In the analysed fraction S2, 88 compounds were identified. Acetaldehyde was not found in
this study in contrast to work presented by Shaw et al. (1989) who reported findings within
the skin oil of Feijoa Sellowiana. Shaw et al. (1989) and Shiota, Minami & Tsuneya (1980)
reported finding of octan-3-one which was not found within the peel extract of this study
whilst 1-octen-3 one was detected. This could be explained by an oxidative reaction taking
place during extraction or storage of the extract in this study resulting in a transformation
from octan-3-one to 1-octen-3 one, thus creating an artefact. Differences within the
extraction method used in this study and the study performed by Shaw et al. (1989) and
Shiota et al. (1980) could be another reason to the different results.
The flavour compounds with quantitative dominance within the peel extract were cis-3-
hexenyl benzoate (13.95%) and humulane-1.6-dien-3-ol (11.34%). Cis-3-hexenyl benzoate is
also known to contribute a sweet, floral and spicy flavour (The good scents company, d). It has
20been previously reported within the skin oil of feijoa fruit (Shaw et al., 1989) and within its
fruit flesh (Shaw et al., 1990). Humulane-1,6-dien-3-ol is described to contribute a spicy
flavour (El-Sayed, 2012) and is reported for the first time as a volatile flavour compound of
feijoa fruit. C-5 – C-8 alcohols are known to contribute with a ‘greenish’ odour which was
distinct in the peel extract of this study (Shaw et al., 1989). In sample S2 was five C-5 – C-8
alcohols found: 2-heptanol, 1-hexanol, (Z)-hex-3-en-1-ol, n-octan-3-ol and 2-ethyl-1-hexanol.
3.2.3 GC versus GC – MS
Results of the gas chromatography should only be used to get an indication of which flavour
compounds that can be found within the fruit extracts of this study. This conclusion is based
on the results where the fruit flesh extracts resulted in a higher frequency of detected
compounds in comparison to the seed and peel extract which was found to be incorrect since
results of the GC-MS analysis showed the peel extract to contain the highest amount of
detected flavour compounds. Further D-limonene was detected within the feijoa extracts
performing GC-MS (see Appendix 4a-c) but not by performing GC as a single method. D-
limonene is reported for the first time as a flavour compound of feijoa fruit (Hardy & Michael,
1970; Shaw et al., 1983; Shaw et al., 1989; Shaw et al., 1990).
214. Conclusions
Analysis of results performing gas chromatography (GC) and gas chromatography-mass
spectrometry (GC-MS) indicates that the extraction method used has been successful;
chromatograms obtained contained a great number of peaks which were shown to be
interesting in a flavour point of view. Using GC-analysis 13 of 23 reference compounds was
identified. Results from the GC-MS were shown to be most successful and this technique
presented a great amount of data of which seven flavour compounds are reported for the
first time.
Due to the magnitude of detected compounds using the GC-MS technique analysis of these
results could not be completed since there were time constraints and limitations on the size
of this project. There is a need for further analysis to complete the analysis of results to
determine the extent of compounds that can be classified as flavour compounds and further
determine the extent of unique findings within these results. Further investigation could also
be performed to examine the flavour properties of these compounds and in which extent
they contribute to the flavour of fresh feijoa fruit; more information is needed to produce a
nature identical flavour mix for the food industry.
22References
Acree, T.E. (2005) Smell chemicals. In Wrolstad, E. (Ed) Handbook of Food Analytical
Chemistry: pigments, colorants, flavours, texture and bioactive food components, 223-312.
Alsters, P.L., Jary, W., Nardello-Rataj, W., & Aubry, J.M. (2010) “Dark” Singlet Oxygenation of
β-Citronellol: A Key Step in the Manufacture of Rose Oxide. Org. Process Res. Dev. 14, 259–
262.
Arctander, S. (1960) Perfume and flavour materials of natural origin, 1-736. Carol Stream,
United States of America: Allured publishing corporation.
Bebelmans, J.M.H. (1979) Review of Isolation and Concentration Techniques. In Land, D.G., &
Nursten, H.E. (Ed.) Progress in Flavour Research, 79-98.
Hardy, P.J. & Michael, B.J. (1970) Volatile components of Feijoa Fruits. Phytochemistry 9,
1355-1357.
Kovats, (1958) Gas-chromatographische Charakterisierung organischer Verbindungen. Teil 1:
Retentionsindices aliphatischer Halogenide, Alkohole, Aldehyde und Ketone". Helv. Chim. Acta
41, 1915–1932.
Laing, D.G., & Jinks, A. (1996) Flavour perception mechanism. Trends in Food Science &
Technology, 7, 387-389.
Laing, D.G. (1979) Some Factors Influencing the Perception of Flavour-contributing Substances
in Food. In Land, D.G., & Nursten, H.E. (Ed.) Progress in Flavour Research, 53-66.
National Institute of Standards and Technology (2005). Gaithersburg, MD, USA.
Seidman, M. (1979) Sensory Methods in the Work of the Flavour Chemist. In Land, D.G., &
Nursten, H.E. (Ed.) Progress in Flavour Research, 15-26.
Shaw, G.J., Ellingham, P. E., & Birch, E. J. (1983) Volatile constituents of feijoa – headspace
analysis of intact fruit. J. Sci. Food Agric. 34, 743-747.
Shaw, G.J., Allen, J.M., & Yates, M.K. (1989) Volatile flavour constituents in the skin oil from
Feijoa sellowiana. Phytochemistry 28, 1529-1530.
Shaw, G.J., Allen, J.M., Yates, M.K., Franich, R.A. (1990) Volatile flavor constituents of feijoa
(Feijoa sellowiana) – Analysis of fruit flesh. J Sci Food Agriculture 50, 357-361.
23Shiota, H., Tsuneya, T. (1989) The aroma constituents of strawberry-guava (Psidium
cattelainum sabine), yellow guava (Psidium cattelianum var. Lucidun Hort) and Ananus-guava
(Feijoa sellowiana Berg). Koryo, 128, 25.
Solomons, T.W.G., Fhryle, C.B. (2006) Organic chemistry 8:ed. United State of America.
Williams (1979) The Evaluation of Flavour Quality in Fruits and Fruit Products. In Land, D.G., &
Nursten, H.E. (Ed.) Progress in Flavour Research, 287-305.
Electronic references
a.The good scents company (2012) Citronellyl acetate. (Electronic) Available at:
(2012-03-01)
b.The good scents company (2012) (Z)-rose oxide. (Electronic) Available at:
(2012-03-01)
c.The good scents company (2012) Ethyl octanoate. (Electronic) Available at:
(2012-03-01)
d.The good scents company (2012) (Z)-3-hexen-1-yl benzoate (Electronic) Available at:
(2012-03-10)
El-Sayed, A.M. (2012) Kovats-1,6-humulanedien-3-ol (Electronic) Available at:
(2012-03-10)
24Appendix
Appendix 1 - Identification of flavour compounds
Reference compounds were analysed to be able to detect flavour compounds of the distilled
fruit extracts. The table is presenting results of GC – analysis of chosen reference compounds
with experimental data of retention times.
Standard Retention time Compound
(no.) (min)
1 3.42 Metyl acetate
7.6 Ethyl butyrate
19.22 2-octanone
25.356 Cis-3-hexenyl butyrate
30.186 Methyl benzoate
31.36 Ethyl benzoate
2 4.007 Ethyl acetate
5.26 Ethanol
9.447 Hexanal
15.1 Limonene*
17.063 Ocimene
17.00 Ethyl hexanoate
22.8 Cis-3-hexanol
27.824 Linalool
35.5 Geraniol
3 5.37 Ethyl propionate
13.66 Myrcene
20.44 Cis-3-hexenyl acetate
22.95 2-nonanone
4 14.629 2-heptanone
15.15 Limonene
17.07 Ocimene
21.7 Hexanol
*Impurity of ocimene
25Appendix 2 – GC extraction
Table I. Data from distillation of seed extract
Fraction (no.) Time (min) Temperature (°C)
1 11.33 78
2 11.39 79
3 12.40 80
4 13.28 80
5 14.21 81
6 14.28 82-83
7 14.33 84-85
8 14.36 86-87
9 14.43 88
10 14.48 89-91
11 14.54 92
12 15.01 93-94
13 15.04 96
14 15.10 96-98
15 15.15 99
16 15.22 100
17 16.45 100
18 17.15 *
*The remaining extract
26Table II. Data from distillation of flesh extract
Extract Time Temperature
(no.) (min) (°C)
1 14.58 78
2 15.01 79
3 15.04 80
4 15.24 80
5 15.34 81
6 15.39 82
7 15.48 83.5
8 15.55 84
9 16.00 86
10 16.05 87
11 16.08 89-90
12 16.16 92-96
13 13.26 78
14 13.28 79-80
15 13.29 82-94
16 13.31 96
17 13.36 98
18 13.41 99
19 13.45-14.20 100
20 15.00 *
21 15.00 *
*The remaining extract
27Table III. Data from distillation of skin extract
Extract Time Temperature
(no.) (min) (°C)
1 14.22 78
2 15.49 79-80
3 16.00 80
4 16.21 81
5 16.34 82
6 16.34 83
7 16.36 84
8 16.40 85-86
9 16.44 88
10 16.47 90
11 16.50 91-92
12 16.54 93-94
13 16.59 95-96
14 17.01 97
15 17.04 98
16 17.10 99-100
17 17.50 101
18 18.25-19.00 101
19 >19.00 *
*The remaining extract
28Appendix 3 – GC-analysis results of combined fractions
Methyl benzoate Ethyl benzoate
2-nonanone
Cis-3-hexenyl acetate
Fig. I. Chromatogram presenting results of GC-analysis of combined flesh distillates
Methyl benzoate
Ethyl benzoate
2-nonanone
Geraniol
Fig. II. Chromatogram presenting results of GC-analysis of combined seed distillates
Methyl benzoate
Ethyl benzoate
Cis-3-hexanol Linalool
Geraniol
Fig. III. Chromatogram presenting results of GC-analysis of combined skin distillates
29Appendix 4
Appendix 4a - Experimental data and identified compounds for fractions of
the flesh extract
Table I. Results of GC- analysis for fraction K1 of the flesh extract.
Peak Retention time Area Constituent
(no.) (min) (%)
1 2.550 0.00677 Unidentified
2 2.745 0.00337 Unidentified
3 2.920 0.13147 Unidentified
4 3.313 0.00040 Unidentified
5 3.380 0.00110 Methyl acetate
6 3.615 0.00043 Methyl acetate
7 3.982 0.00499 Unidentified
8 5.585 88.67008 Ethanol
9 5.660 11.17728 Ethanol
10 7.612 0.00210 Ethyl butyrate
11 20.385 0.00053 Cis-3-Hexenyl acetate
12 24.444 0.00071 Unidentified
13 30.113 0.00085 Methyl benzoate
Table II. Results of GC- analysis for fraction K2 of the flesh extract.
Peak Retention time Area Constituent
(no.) (min) (%)
1 4.175 0.00041 Unidentified
2 5.595 93.97350 Ethanol
3 5.629 6.00508 Ethanol
4 20.489 0.00072 Cis-3-hexenyl acetate
5 22.937 0.00151 2-nonanone
6 30.230 0.01474 Methyl benzoate
7 31.385 0.00231 Ethyl benzoate
30Table III. Results of GC- analysis for fraction K3 of the flesh extract.
Peak Retention time Area Constituent
(no.) (min) (%)
1 2.754 0.01938 Unidentified
2 3.328 0.00187 Unidentified
3 3.385 0.00175 Methyl acetate
4 3.634 0.00051 Unidentified
5 4.123 0.00188 Unidentified
6 5.233 39.62101 Ethanol
7 5.339 12.40088 Ethanol
8 5.500 21.94171 Ethanol
9 5.660 26.00954 Ethanol
10 12.027 0.00069 Unidentified
11 25.146 0.00081 Cis-3-hexenylbutyrate
Table IV. Results of GC- analysis for fraction K4 of the flesh extract.
Peak Retention time Area Constituent
(no.) (min) (%)
1 2.745 0.00340 Unidentified
2 4.095 0.00096 Unidentified
3 5.429 99.98262 Ethanol
4 12.057 0.00173 Unidentified
5 22.786 0.00120 Cis-3-hexenol
6 25.129 0.00312 Cis-3-hexenylbutyrate
7 25.592 0.00177 Cis-3-hexenylbutyrate
8 30.091 0.00334 Methyl benzoate
9 57.760 0.00192 Unidentified
Table V. Results of GC- analysis for fraction K5 of the flesh extract.
Peak Retention time Area Constituent
(no.) (min) (%)
1 2.754 0.00209 Unidentified
2 4.113 0.00481 Unidentified
3 4.911 99.98349 Ethanol
4 25.601 0.00394 Cis-3-hexenylbutyrate
5 35.478 0.00570 Geraniol
Table VI. Results of GC- analysis for fraction K6 of the flesh extract.
Peak Retention time Area Constituent
(no.) (min) (%)
1 4.739 100.00 Ethanol
31Appendix 4 b - Experimental data and identified compounds for fractions of
the skin extract
Table I. Results of GC- analysis for fraction S1 of the skin extract.
Peak Retention time Area Constituent
(no.) (min) (%)
1 4.684 1.47951 Ethanol
2 5.012 98.48022 Ethanol
3 17.958 0.00707 Unidentified
4 27.915 0.00548 Linalool
5 30.265 0.01460 Methyl benzoate
6 30.992 0.00744 Unidentified
7 42.035 0.00571 Unidentified
Table II. Results of GC- analysis for fraction S2 of the skin extract.
Peak Retention time Area Constituent
(no.) (min) (%)
1 3.035 0.00068 Unidentified
2 3.411 0.00045 Unidentified
3 3.4162 0.00078 Unidentified
4 5.406 55.51758 Ethanol
5 5.509 14.06192 Ethanol
6 5.645 19.54613 Ethanol
7 5.715 10.70852 Ethanol
8 22.851 0.00537 Cis-3-hexanol
9 26.090 0.00048 Unidentified
10 27.832 0.00578 Linalool
11 30.166 0.02151 Methyl benzoate
12 31.325 0.00446 Ethyl benzoate
13 31.430 0.00097 Unidentified
14 31.957 0.00543 Unidentified
15 34.463 0.00077 Unidentified
16 35.540 0.00215 Unidentified
17 36.277 0.00061 Unidentified
18 36.787 0.00079 Unidentified
19 37.667 0.00083 Unidentified
20 37.895 0.00090 Unidentified
21 38.205 0.00080 Unidentified
22 39.220 0.00047 Unidentified
23 39.473 0.00171 Unidentified
24 39.831 0.00237 Unidentified
25 39.925 0.01230 Unidentified
26 40.268 0.00047 Unidentified
27 40.391 0.00772 Unidentified
28 40.515 0.00177 Unidentified
29 40.638 0.00591 Unidentified
3230 40.855 0.00744 Unidentified
31 41.290 0.00115 Unidentified
32 41.497 0.00304 Unidentified
33 41.680 0.00220 Unidentified
34 41.845 0.00185 Unidentified
35 41.963 0.03592 Unidentified
36 42.166 0.00133 Unidentified
37 42.587 0.00167 Unidentified
38 42.781 0.00375 Unidentified
39 43.115 0.00612 Unidentified
40 43.326 0.00192 Unidentified
41 43.892 0.00212 Unidentified
42 44.027 0.00778 Unidentified
43 44.190 0.00207 Unidentified
44 44.368 0.00038 Unidentified
45 44.518 0.00102 Unidentified
46 44.828 0.0093 Unidentified
Table III. Results of GC- analysis for fraction S3 of the skin extract.
Peak Retention time Area Constituent
(no.) (min) (%)
1 3.388 0.00059 Unidentified
2 3.561 0.00040 Unidentified
3 4.736 4.79989 Ethanol
4 5.552 88.21379 Ethanol
5 5.587 6.87370 Ethanol
6 22.823 0.00359 Cis-3-hexanol
7 25.635 0.00049 Unidentified
8 27.810 0.00168 Linalool
9 30.141 0.01095 Methyl benzoate
10 31.935 0.00405 Ethyl benzoate
11 34.448 0.00054 Unidentified
12 39.456 0.00084 Unidentified
13 29.814 0.00186 Unidentified
14 39.906 0.00265 Unidentified
15 40.366 0.00545 Unidentified
16 40.494 0.00072 Unidentified
17 40.625 0.00320 Unidentified
18 40.831 0.00708 Unidentified
19 41.476 0.00259 Unidentified
20 41.660 0.00196 Unidentified
21 41.825 0.00207 Unidentified
22 41.944 0.01524 Unidentified
23 42.562 0.00361 Unidentified
24 42.760 0.00450 Unidentified
25 43.090 0.00710 Unidentified
3326 43.310 0.00323 Unidentified
27 43.876 0.00418 Unidentified
28 44.006 0.01543 Unidentified
29 44.185 0.00215 Unidentified
30 44.361 0.00134 Unidentified
31 44.504 0.00188 Unidentified
32 44.795 0.00145 Unidentified
33 45.551 0.00076 Unidentified
34 45.615 0.00133 Unidentified
Table IV. Results of GC- analysis for fraction S4 of the skin extract.
Peak Retention time Area Constituent
(no.) (min) (%)
1 4.589 0.86120 Ethanol
2 5.242 58.26046 Ethanol
3 5.370 21.23956 Ethanol
4 5.471 19.56802 Ethanol
5 22.830 0.00284 Cis-3-hexanol
6 30.116 0.00498 Methyl benzoate
7 31.276 0.00030 Ethyl benzoate
8 31.920 0.00223 Unidentified
9 35.505 0.00132 Geraniol
10 40.361 0.00124 Unidentified
11 40.606 0.00120 Unidentified
12 40.826 0.00315 Unidentified
13 41.335 0.00155 Unidentified
14 41.465 0.00145 Unidentified
15 41.650 0.00098 Unidentified
16 41.810 0.00196 Unidentified
17 41.928 0.00328 Unidentified
18 42.554 0.00513 Unidentified
19 42.730 0.00354 Unidentified
20 43.077 0.00350 Unidentified
21 43.240 0.00139 Unidentified
22 43.295 0.00215 Unidentified
23 43.863 0.00404 Unidentified
24 43.997 0.01463 Unidentified
25 44.173 0.00151 Unidentified
26 44.369 0.00120 Unidentified
27 44.485 0.00149 Unidentified
28 46.381 0.00097 Unidentified
29 47.244 0.00194 Unidentified
30 53.365 0.00101 Unidentified
31 55.416 0.00206 Unidentified
34Table V. Results of GC- analysis for fraction S5 of the skin extract.
Peak Retention time Area Constituent
(no.) (min) (%)
1 3.515 0.00105 Methyl acetate
2 4.115 0.00554 Ethanol
3 5.065 99.97402 Ethanol
4 25.620 0.00368 Unidentified
5 35.490 0.00210 Geraniol
6 41.325 0.00436 Unidentified
7 41.799 0.00286 Unidentified
8 42.538 0.00436 Unidentified
9 42.705 0.00207 Unidentified
Table VI. Results of GC- analysis for fraction S6 of the skin extract.
Peak Retention time Area Constituent
(no.) (min) (%)
1 4.771 98.06656 Ethanol
2 5.352 0.06322 Ethyl propionate
3 25.346 0.69802 Unidentified
4 25.753 0.53996 Unidentified
5 48.662 0.63223 Unidentified
35Appendix 4 c - Experimental data and identified compounds for fractions of
the seeds extract
Table I. Results of GC- analysis for fraction F1 of the seeds extract.
Peak Retention time Area Constituent
(no.) (min) (%)
1 2.568 0.00971 Unidentified
2 2.768 0.00703 Unidentified
3 3.404 0.00070 Methyl acetate
4 4.013 0.00908 Ethyl acetate
5 5.430 65.60173 Ethanol
6 5.538 14.85498 Ethanol
7 6.661 19.51156 Ethanol
8 7.644 0.00179 Ethyl butyrate
9 20.437 0.00073 Cis-3-hexenyl acetate
10 30.162 0.00230 Methyl benzoate
11 31.325 0.00045 Ethyl benzoate
Table II. Results of GC- analysis for fraction F2 of the seeds extract.
Peak Retention time Area Constituents
(no.) (min) (%)
1 4.123 0.00061 Unidentified
2 5.452 74.87382 Ethanol
3 5.532 12.80242 Ethanol
4 5.603 12.26990 Ethanol
5 22.809 0.00284 Cis-3-hexanol
6 26.052 0.00056 Unidentified
7 30.127 0.03742 Methyl benzoate
8 31.285 0.00730 Ethyl benzoate
9 31.878 0.00088 Unidentified
10 33.368 0.00035 Unidentified
11 33.528 0.00067 Unidentified
12 36.225 0.00067 Unidentified
13 36.365 0.00061 Unidentified
14 37.112 0.00065 Unidentified
15 41.925 0.00083 Unidentified
16 42.069 0.00060 Unidentified
36Table III. Results of GC- analysis for fraction F3 of the seeds extract.
Peak Retention time Area Constituents
(no.) (min) (%)
1 4.120 0.00224 Unidentified
2 5.159 69.32291 Ethanol
3 5.240 16.99464 Ethanol
4 5.295 13.67020 Ethanol
5 25.610 0.00121 Unidentified
6 30.102 0.00763 Methyl benzoate
7 35.486 0.00119 Geraniol
Table VI. Results of GC- analysis for fraction F4 of the seeds extract.
Peak Retention time Area Constituents
(no.) (min) (%)
1 3.512 0.00094 Methyl acetate
2 4.102 0.00246 Unidentified
3 5.143 99.99110 Ethanol
4 30.075 0.00253 Methyl benzoate
5 35.475 0.00298 Geraniol
Table V. Results of GC- analysis for fraction F5 of the seeds extract.
Peak Retention time Area Constituents
(no.) (min) (%)
1 1.121 0.00803 Unidentified
2 4.119 0.02108 Unidentified
3 4.783 99.86477 Ethanol
4 25.288 0.04687 Unidentified
5 25.679 0.02425 Unidentified
6 35.548 0.03498 Geraniol
Table VI. Results of GC- analysis for fraction F6 of the seeds extract.
Peak Retention time Area Constituents
(no.) (min) (%)
1 4.658 98.17619 Ethanol
2 25.190 1.82383 Unidentified
37You can also read