FOR THE SIX MONTHS ENDED 31 AUGUST 2020 - PRESENTATION / 30 OCTOBER 2020 - Spear ...
←
→
Page content transcription
If your browser does not render page correctly, please read the page content below

UN AUDITED CONSOLIDATED
                                                          INTERI M RESULTS
                                                                 FOR THE SIX MONTHS ENDED 31 AUGUST 2020

                                                          PRESENTATION / 30 OCTOBER 2020

Liberty Life, Century City   Liberty Life, Century City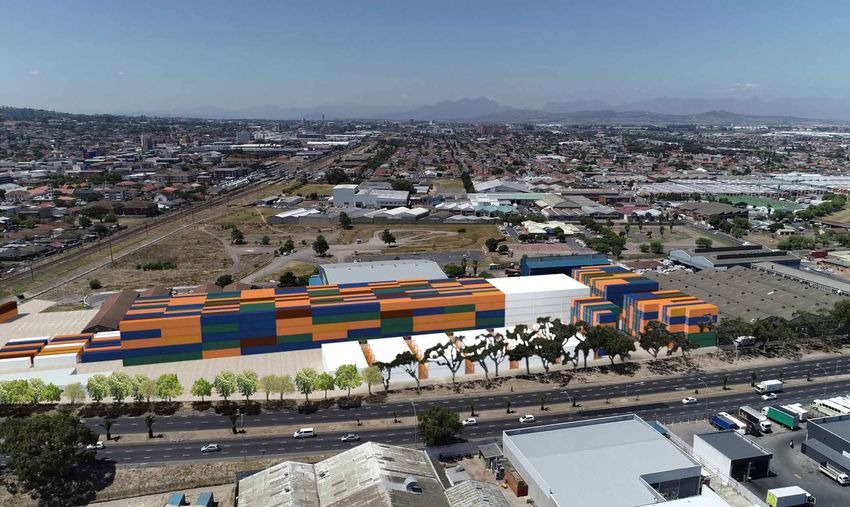
TABLE OF CONTENTS
     I NT RO D U CTIO N AN D
1.
     E N V I R O N ME NTAL U P DAT E

2.   I M PACT O F COV ID - 1 9

3.   I NT E R IM S AL IE NT D E TAI LS FY2 0 2 1

     I NT E R IM F IN AN CI AL
4.
     P E RFO R M AN CE FY 2 0 2 1

5.   P O RT FO L IO OV E RV IE W

6.   S E CTO R AL P E R FO R M AN C E

     D E V E LO P M E NT AN D
7.
     RE D E V E LO P M E NT P R O J ECTS

8.   O U T LO O K AN D P R O S P E CTS

9.   Q U E S TIO N S

          / Unaudited Consolidated Interim Results / for the six months ended 31 August 2020 / 2   Liberty Life, Century City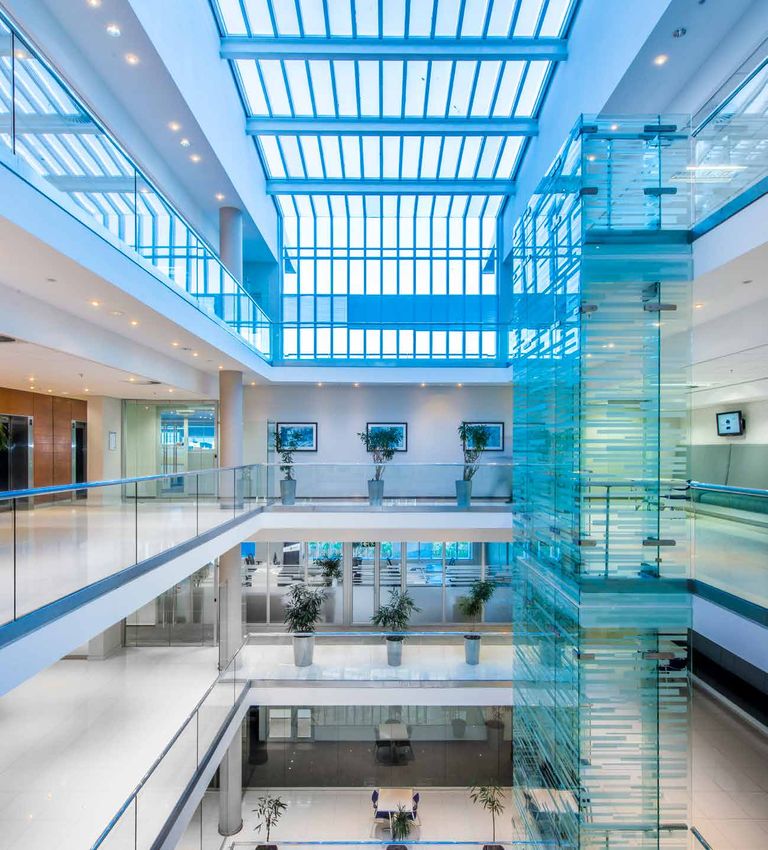
INTRODUCTION AND
                                                                                                            1 /
                                                                                                                ENVIRONMENTAL OVERVIEW

                                                                                                              EMAIL QUESTIONS TO
                                                                                                              INFO@SPEARPROP.CO.ZA

                                                                                  78 on Edward, Bellville

/ Unaudited Consolidated Interim Results / for the six months ended 31 August 2020 / 3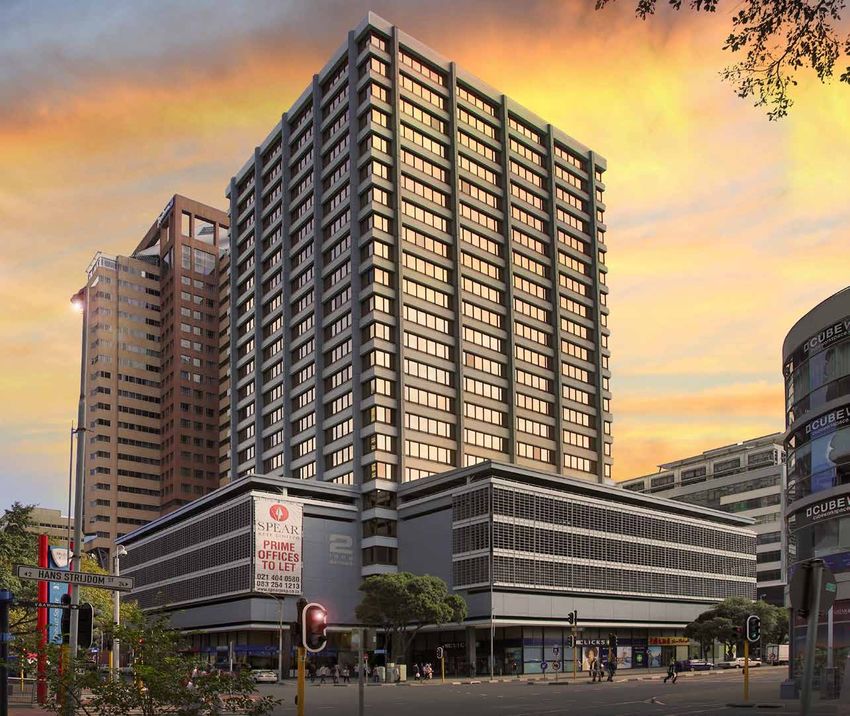
1 / INTRODUCTION AND ENVIRONMENTAL UPDATE /
MISSION STATEMENT AND STRATEGY

                                                                                                                 S TRATEGY
                                                                                                                 S T R AT EG Y AC H I EV ED
                                                                                                                   Successfully adapted to Covid-19 operating environment
                                                                                                                   Capital preservation and liquidity management
                                                                                                                   Maintained income statement consistency and strong rental
                                                                                                                   collections to date
                                                                                                                   Excellent results achieved in letting activity for FY2021
                                                                                  No.2 Estuaries, Century City
                                                                                                                   High level of tenant retention through active asset management
                                                                                                                   Debtors book under control and notable reduction from pre-close
                                                                                                                   Reduce controllable expenses
                                                                                                                   Disposal of non-core assets
   M IS S I ON S TAT E M ENT
                                                                                                                 S T R AT EG I C FO C U S ( M I D TO LO NG T ER M )
   To be the leading Western Cape-focused                                                                          Narrow asset ownership to commercial, convenience retail
                                                                                                                   and industrial
   REIT and to consistently grow our
                                                                                                                   Maintain distribution pay-out ratio between 80% – 90%
   distribution per share ahead of inflation and
                                                                                                                   Prudent recycling of capital through earmarked disposals
   within the top quartile of our peer group.
                                                                                                                   Reduce gearing ratio in line with strategy to 38% – 43%
                                                                                                                   Conservative debt hedged profile
                                                                                                                   Maintain high portfolio occupancy levels
                                                                                                                   Fully comply with REIT legislation

     / Unaudited Consolidated Interim Results / for the six months ended 31 August 2020 / 4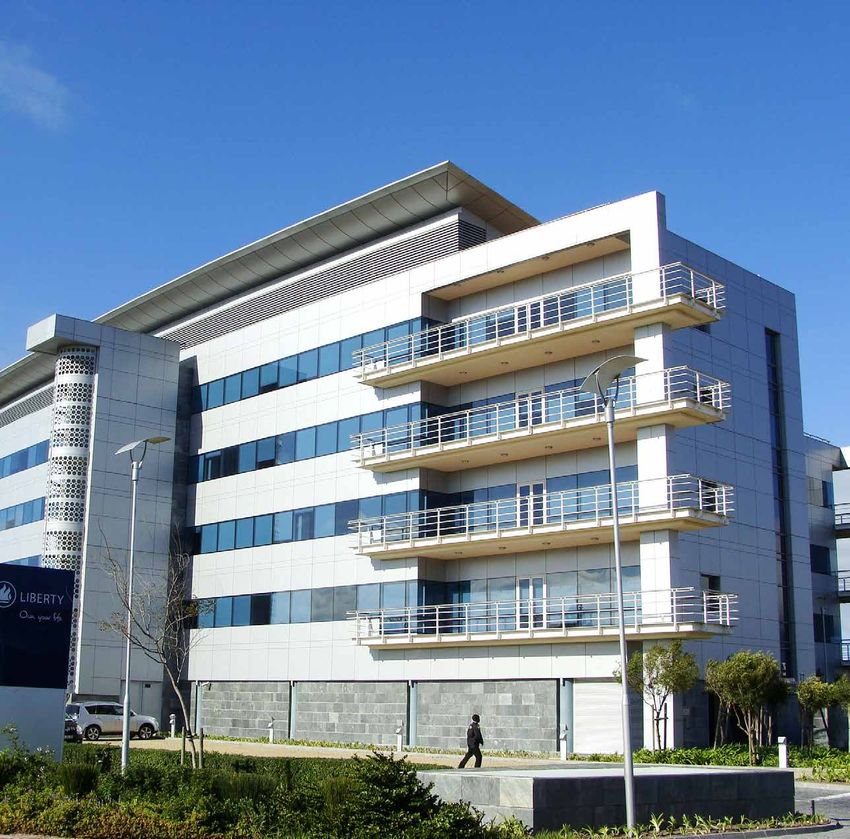
2 / IMPACT OF COVID-19

                                                                            Upper East Side, Woodstock

/ Unaudited Consolidated Interim Results / for the six months ended 31 August 2020 / 5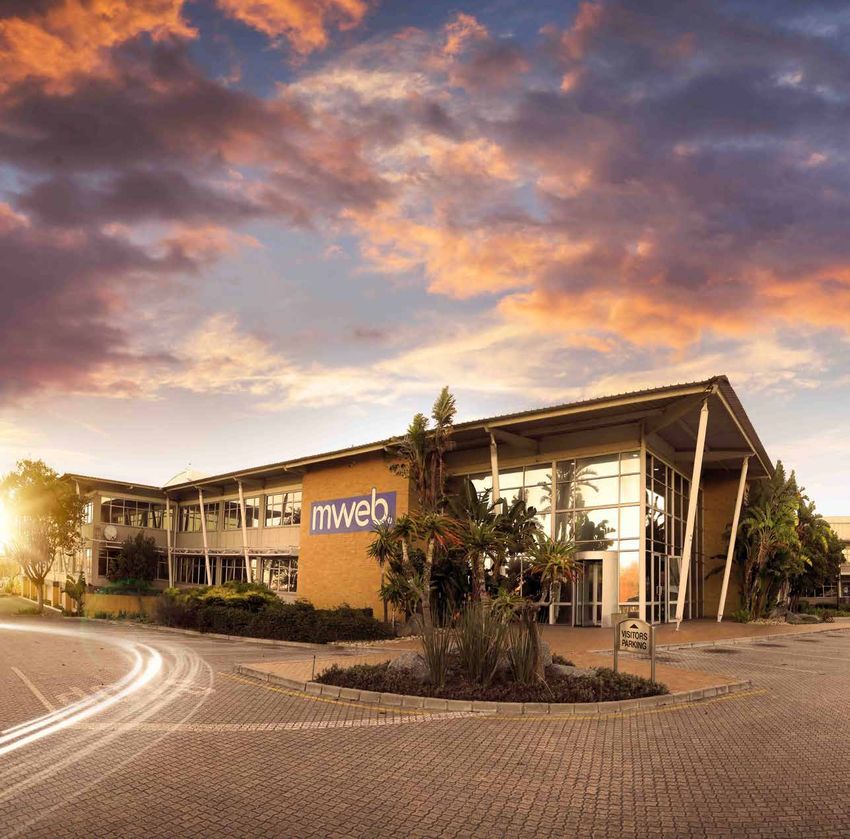
2 / IMPACT OF COVID-19 /
LOCKDOWN OPERATING PERCENTAGES – REVENUE BASED ON RENTABLE AREA

                                                                                              LOC K D O W N O P E R AT I N G P E R C E NTAG E S –
                                                                                              R EVEN UE B AS E D O N R E NTAB L E AR E A
                                                                                              The percentages below illustrate the monthly revenue
                                                                                              contributed to the group under the various lockdown levels:
                                                                                                                                May 2020             Current

                                                                                                   L EV EL         5           20%                20%
                                                                                                   L EV EL         4           50%                50%
                                                                                                   L EV EL         3           86%                93%
                                                                                                   L EV EL         2           91%                99%
                                                                                                   L EVE L         1          100%               100%
                                                                                              * The above levels are based on tenants allowed on premises per regulations and do
                                                                                                 not take into account tenants that could operate from home.
                                                                                              ** Full portfolio was operational from 8 September 2020.
                                                   Mega Park, Bellville South

     / Unaudited Consolidated Interim Results / for the six months ended 31 August 2020 / 6
2 / IMPACT OF COVID-19 /
    FY2021 OPERATING SCEN ARIOS – CURRENT

FY2021 OP ER AT I NG SCE N AR I O S

STATUS Q U O
                                                                                                     Funders remain aligned with Spear strategies
   Challenging trading conditions persist
                                                                                                     Spear sufficiently capitalised to meet short- and long-term
   ±86% of total budget collected set in December 2019*
                                                                                                     commitments
   Spear profitable and operating in the high road scenario plan
                                                                                                     Spear’s FY2021 renewal/relet programmes have been excellent
   (set out May 2020)
                                                                                                     Level 1 travel rules disappointing
   Balance sheet and income statement remain robust and meeting
   covenants**                                                                                       DoubleTree has hosted over 600 people since reopening
   Liquidity availability has remained sufficient to absorb various rental
   credits and deferrals and in addition to covering operating expenditure and
   interest:
      • no going-concern risk                                                                        Both DoubleTree and 15 on Orange operating
      • R180 million in cash availability
                                                                                                     since 8 September 2020
      • zero funders assistance measures initiated
 * Zero hospitality income included in FY2021
** Covenants being met: Strictest covenant 50% LTV and 2 times ICR

            / Unaudited Consolidated Interim Results / for the six months ended 31 August 2020 / 7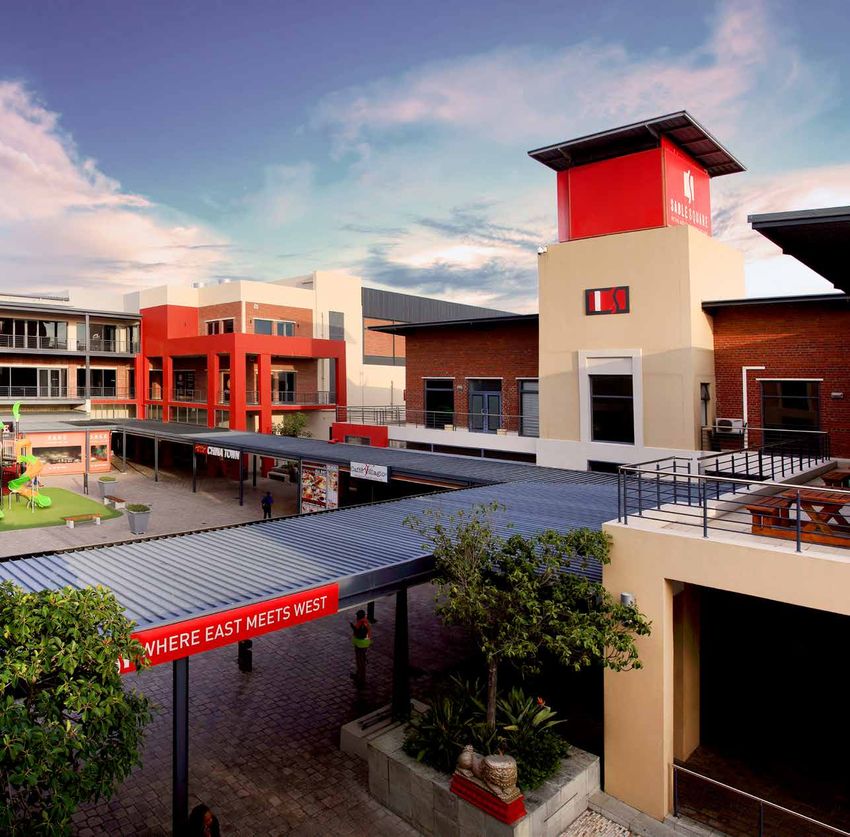
INTERIM SALIENT DE TAILS
                                                                                                           3 /
                                                                                                               FY2021

                                                                                Northgate Park, Brooklyn

/ Unaudited Consolidated Interim Results / for the six months ended 31 August 2020 / 8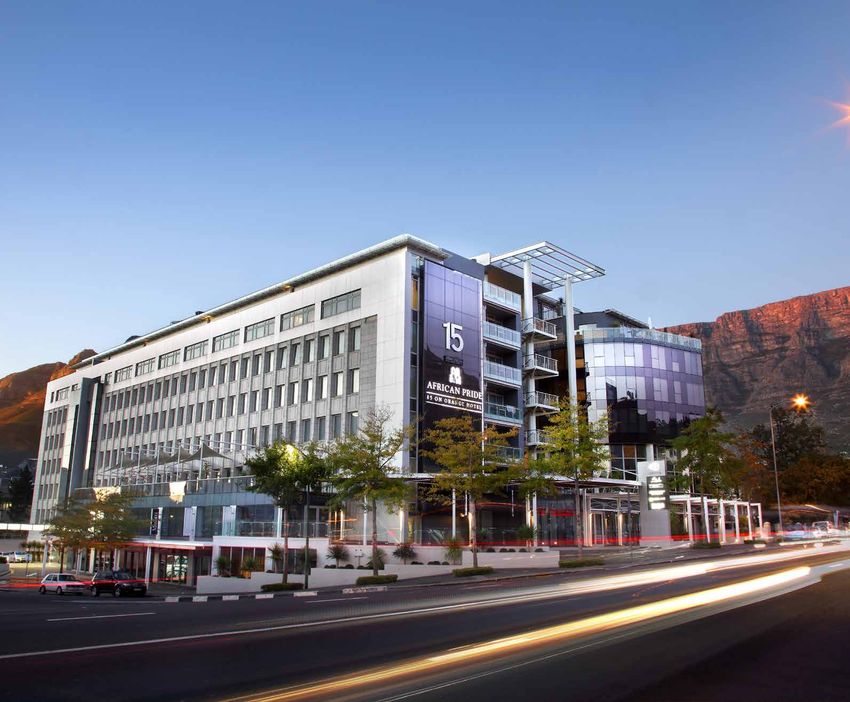
3 / INTERIM SALIENT DE TAILS FY2021 /
              PORTFOLIO SN APSHOT

                                                           32                            ASSE TS
                                                       NUMBER OF
                                                       PROPERTIES
                                                                                         R4.46BN              6.54%           R138M               R9 753/M2
                                                                                         ASSET VALUE          ASSET VALUE     AVERAGE             AVERAGE PROPERTY
                                                                                                              GROWTH          PROPERTY VALUE      VALUATION
                                                                                                              (FY2020)

                                                     7.25%                               LE T TING
                                                       AVERAGE
                                                       IN-FORCE
                                                                                         453 016M2             91.2%          28 MONTHS           R89.33/M2/PM
                                                     ESCALATIONS                         GLA                   OCCUPANCY      WALE                AVERAGE RENTAL
                                                                                                                                                  INCLUDING RATES

                                                                                         COLLECTIONS
                                                      96.9%                                                       ( M EASURED AT 15 OCTOBER 2020)

                                                        INTERIM                          94.03%               86.13%                 83.72%
                                                      COLLECTION                         YEAR-TO-DATE         INTERIM COLLECTION     YEAR-TO-DATE COLLECTION
Radnor Road, Parow                                                                       COLLECTION           TO BUDGET              TO BUDGET
                                                                                                              (SET DEC 2019)         (SET DEC 2019)

                     / Unaudited Consolidated Interim Results / for the six months ended 31 August 2020 / 9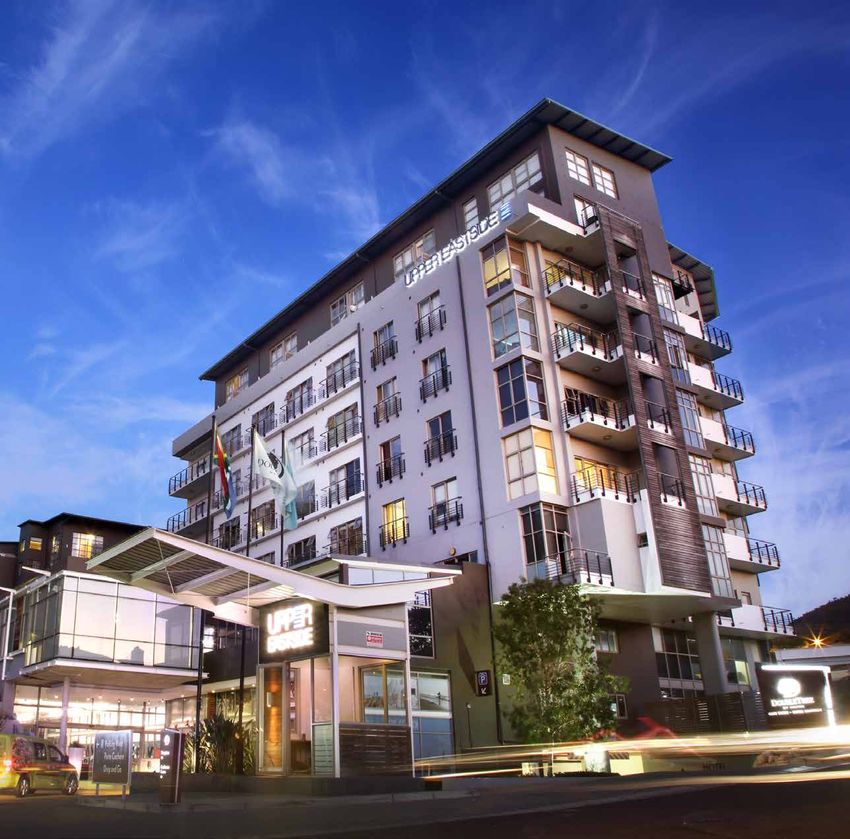
3 / INTERIM SALIENT DE TAILS FY2021 /
              PORTFOLIO SN APSHOT

                                                         29.34                             D I STRI B U TI ON
                                                            CENTS
                                                             FY2021                        80%                         39.14%                 5.65%
                                                            INTERIM                        PAY-OUT RATIO               SA REIT                SA REIT ADMIN
                                                         DISTRIBUTION                                                  COST-TO-INCOME         COST-TO-INCOME
                                                                                                                       RATIO                  RATIO

                                                                                           TANGI B L E NE T ASSE T VALUE (TN AV )

                                                      R11.75                               0.98%                        -3.45%                R11.46
                                                                                           TNAV INCREASE                TNAV DECREASE         TNAV NET DISTRIBUTION
                                                                                           FOR PRIOR                    FROM FY2020
                                                                                           INTERIM PERIOD

                                                                                           D E BT
                                                       45.36%
                                                                                           69.90%                    26 MONTHS          7.56%            8.72%
                                                        LOAN TO VALUE
                                                        (LTV) (SA REIT)                    FIXED DEBT                AVERAGE DEBT       AVERAGE COST     AVERAGE COST
                                                                                           RATIO                     EXPIRY             OF DEBT          OF FIXED DEBT
2 Long Street, Cape Town

                           / Unaudited Consolidated Interim Results / for the six months ended 31 August 2020 / 10
3 / INTERIM SALIENT DE TAILS FY2021 /
COLLECTIONS (AS AT 15 OCTOBER 2020)
ear-to-date collections under the circumstances have been satisfactory and in line with
Y enant arrears as at the end of the interim period amounted to R13.5 million, decreasing
T
management’s high road scenario plan from R16.1 million reported in the pre-close investor update
Billings reflect revenue after all credits and deferments including recoveries t the last date of measurement, arrears for the interim period decreased to
A
R8.1 million per the below table.
riginal budget reflects pre-Covid-19 operating revenue including hotels and recoveries (set in
O
December 2019) Last date of collections for reporting was 15 October 2020.
Zero hospitality income in billings recovered (factored into various scenario plans)
For the interim period March April May June July August Total
Original budget* (R’000) 44 654 44 002 44 320 44 601 46 677 48 409 272 662
Billed** (R’000) 41 333 39 524 37 026 35 231 41 511 47 738 242 364
Collected (R’000) 40 919 38 715 36 311 33 918 39 392 44 974 234 229
Collected vs original budget (%) 91.64 87.99 81.93 76.06 84.54 94.02 86.13
Collected vs billings (%) 99.00 97.95 98.07 96.28 95.06 95.35 96.90
After the interim period - guidance on collections September October Total Total YTD
Original budget* (R’000) 48 350 48 795 97 145 369 807
Billed** (R’000) 43 466 43 425 86 890 329 254
Collected (R’000) 39 907 34 856 74 763 309 606
Collected vs original budget (%) 82.54 71.43 76.96 83.72
Collected vs billings (%) 91.81 80.27 86.04 94.03
* Including utilities and hotels
** Including utilities, excluding hotels
/ Unaudited Consolidated Interim Results / for the six months ended 31 August 2020 / 113 / INTERIM SALIENT DE TAILS FY2021 /
EXCLUSIONS, CREDITS AND DEFERRALS (EXCLUDING UTILITIES) (AS AT 15 OCTOBER 2020)
Spear has 442 tenants with 196 tenants
provided with Covid-19-related relief.
Interim
96.90%
August 2020 % of YTD budget
Classification (R‘000) (rentable area only) COLLECTIONS
Hospitality1 (12 314) 5.95
VS. BILLED
Credit2 (11 652) 5.63
Deferral3 (6 680) 3.23
Stopped billing4 (1 998) 0.96
Solar payments5 4 491 (2.17)
Total (28 154) 13.59
1
Per May 2020 results presentation zero income forecast for hospitality
2
Internal assumptions are that this number will not increase significantly over the balance of
FY2021
3
R1.3 million of deferrals already billed and collected in August 2020
4
Worst-case scenario this amount increases to R2.4 million for FY2021
5
Solar roof rental payments were received after completion of solar systems and were not
budgeted for FY2021
100 Fairway Close, Parow
/ Unaudited Consolidated Interim Results / for the six months ended 31 August 2020 / 12INTERIM FIN ANCI AL
4 /
PERFORM ANCE FY2021
Liberty Life, Century City
/ Unaudited Consolidated Interim Results / for the six months ended 31 August 2020 / 134 / INTERIM FIN ANCI AL PERFORM ANCE FY2021 /
SUMM ARY INCOME STATEMENT
Group
Unaudited Unaudited Audited
Six months ended Six months ended Year ended
CONSOLIDATED STATEMENT OF August 2020
R’000
August 2019
R’000
February 2020
R’000
COMPREHENSIVE INCOME Property revenue 253 985 250 566 519 710
Other income 113 546 7 496
FOR THE SIX MONTHS ENDED 31 AUGUST 2020 Total revenue 254 099 251 112 527 206
Property operating and management expenses (75 785) (75 688) (156 889)
Net property-related income 178 313 175 424 370 317
Administrative expenses (13 264) (12 107) (28 883)
SPEAR REIT LIMITED AND ITS SUBSIDIARIES Net property operating profit 165 050 163 317 341 434
Fair value adjustment – Investment properties (81 862) (60 497) 9 326
Impairment of investments – (6 647) (750)
Depreciation and amortisation (5 394) (2 543) (7 297)
Listing cost – – (289)
Share-based payment expense (6 182) (4 011) (6 938)
-3.74% -5.79%
Profit from operations 71 611 89 619 335 486
Net interest (69 921) (58 750) (122 969)
– Finance costs (73 629) (64 148) (133 181)
– Finance income 3 708 5 398 10 212
LIKE-FOR-LIKE LIKE-FOR-LIKE Profit before taxation 1 691 30 869 212 517
INCOME DECLINE NET PROPERTY Taxation – 83 74
-2.72%
OPERATING PROFIT Profit for the period 1 691 30 952 212 590
DECLINE Attributable to:
Equity owners of the parent (1 203) 28 342 207 305
Non-controlling interest 2 894 2 610 5 285
PROPERTY OPERATING Total comprehensive income for the period 1 691 30 952 212 590
AND MANAGEMENT
EXPENSES LIKE-FOR-LIKE
DECLINE Basic earnings per share (cents) (0.58) 14.51 103.37
Diluted earnings per share (cents) (0.58) 14.51 103.37
Distribution per share (cents) 29.34 44.64 91.66
/ Unaudited Consolidated Interim Results / for the six months ended 31 August 2020 / 14
Interest cover ratio (times) 2.17 2.58 2.594 / INTERIM FIN ANCI AL PERFORM ANCE FY2021 /
DISTRIBUTION RECONCILI ATION
Year ended
August 2020
SA REIT funds from operations (SA REIT FFO) per share R’000
Profit or loss per IFRS Statement of Comprehensive Income (SOCI)
RECONCILIATION BETWEEN EARNINGS AND attributable to the parent (1 203)
DISTRIBUTABLE EARNINGS
Adjusted for:
Accounting/specific adjustments: 68 243
FOR THE SIX MONTHS ENDED 31 AUGUST 2020 Fair value adjustments to:
– Investment property 81 862
Straight-lining operating lease adjustment (13 619)
COMPANY FUNDS FROM SA REIT FFO 67 040
OPERATIONS RECONCILIATION
Company-specific adjustments 6 182
IFRS 2 Expense – CSP awards with future vesting and issue date 6 182
29.34 Company FFO 73 222
CENTS 80% SA REIT
2019 BPR
Interim company FFO 73 222
INTERIM
DISTRIBUTION
PAYMENT RATIO COMPLIANT Pay-out ratio
Interim distributable company FFO
(%) 80
58 578
Number of shares outstanding at end of period (net of treasury shares) 199 619 857
Company FFO per share (cents) 29.34
/ Unaudited Consolidated Interim Results / for the six months ended 31 August 2020 / 154 / INTERIM FIN ANCI AL PERFORM ANCE FY2021 /
SUMM ARY BAL ANCE SHEE T
Group
CONSOLIDATED STATEMENT OF Unaudited Unaudited Audited
FINANCIAL POSITION Six months ended
August 2020
Six months ended
August 2019
Year ended
February 2020
ASSETS R’000 R’000 R’000
AS AT 31 AUGUST 2020 Non-current assets 4 525 614 3 988 580 4 253 814
Current assets 67 426 49 158 48 039
TOTAL ASSETS 4 593 040 4 037 738 4 301 853
SPEAR REIT LIMITED AND ITS SUBSIDIARIES EQUITY AND LIABILITIES
Shareholders’ interest
Total attributable to owners 2 353 422 2 401 215 2 447 203
Non-controlling interest 73 197 54 155 73 197
Liabilities 2 426 619 2 455 370 2 520 400
205M 199M Non-current liabilities
Current liabilities
1 661 713
504 708
1 335 105
247 263
1 545 445
236 008
TOTAL LIABILITIES 2 166 421 1 582 368 1 781 453
SHARES SHARES NET
ISSUED OF TREASURY TOTAL EQUITY AND LIABILITIES 4 593 040 4 037 738 4 301 853
Number of ordinary shares in issue 205 776 521 205 776 521 205 776 521
Treasury shares (6 156 664) (1 243 205) (5 342 595)
45.36% R4.46BN Net ordinary shares in issue 199 619 857 204 533 316 200 433 926
Gearing ratio (%) 45.36 38.43 39.63
PORTFOLIO Net asset value per share (rands) 11.79 11.67 12.21
LOAN-TO-VALUE
ASSET VALUE Tangible net asset value per share (rands) 11.75 11.64 12.17
Tangible net asset value per share net of distribution* (rands) 11.46 11.19 11.70
* This has been calculated in terms of the SA REIT Best Practice Recommendations of 2019
/ Unaudited Consolidated Interim Results / for the six months ended 31 August 2020 / 164 / INTERIM FIN ANCI AL PERFORM ANCE FY2021 /
TN AV BRIDGE
R12.17
R0.40
R11.75
R0.05
R0.03
14
R11.46
12 Profit for
(R0.47)
Prior period IFRS 2
R0.02)
the year
(R0.41)
treasury expense
(R0.29)
10 (excluding correction
fair value
adjustments) Distributions Treasury
8 Fair value shares
Rands
paid
adjustment acquired FY2021
June 2020
cash distribution
6 based on
100% cash
elected
4
2
0
TNAV per share TNAV per share SA REIT NAV
at Feb 2020 at Aug 2020 at Aug 2020
/ Unaudited Consolidated Interim Results / for the six months ended 31 August 2020 / 174 / INTERIM FIN ANCI AL PERFORM ANCE FY2021 /
FUNDING 7.56%
45.36%
FUNDERS
AVERAGE
COST OF
FUNDING MATURITY FUNDING
LTV 119BPS
69.9%
FY2024
TOTAL GROSS DEBT
Cost
40% R828m
30.1%
R2.09BN
8.72%
Months
22 DEBT EXPIRY
Cost FY2023
5.67% 14%
R2.09BN
Fixed debt R297m
Months R1.46bn
25
FY2025
Variable debt
26-MONTH
AVERAGE MATURITY 13% R260m
R629m
FY2022
30% 3% FY2021
R67m
R635m
* Zero refinance risk
/ Unaudited Consolidated Interim Results / for the six months ended 31 August 2020 / 18 ** Robust maturity profile4 / INTERIM FIN ANCI AL PERFORM ANCE FY2021 /
LT V SENSITIVIT Y AND REDUCTION ROADM AP
LTV FORECAST TO YEAR-END
NOT ES
1
Disposal agreed at R30 million net. Long form
agreement signed and awaiting completion of
conditions precedent
50 2
Offer received of R280 million gross for
AUG 15 on Orange hotel, commercial and retail
2020 Disposal1 Disposal2 sections. Currently in due diligence process
45.36% 12 Pickwick 15 on Orange
18 — 24
MONTHS 3
Disposal agreed at R42 million net. Long-form
(0.36%) Development4 43.11% agreement signed and awaiting completion of
conditions precedent.
1 Beacon Way
Loan to value (%)
0.47% 0.69% 4
10-year lease entered into with Grindrod. Property
(3.54%)
40 (0.56%) 1.05% Development5 Interim will be partially redeveloped for its intended use
Disposal3 Nampak dividend and the expected completion is February 2021.
142 Edward paid6 5
Existing Nampak facility will be expanded by
2 000m² after a 10-year renewal was concluded.
6
Management forecast that 50% of shareholders
will elect to take up the dividend reinvestment plan
and the remaining distribution will be paid in cash.
30
/ Unaudited Consolidated Interim Results / for the six months ended 31 August 2020 / 194 / INTERIM FIN ANCI AL PERFORM ANCE FY2021 /
DISPOSALS
In line with management’s less-is-more strategy to focus on assets valued
WHY OU R R OADM AP I S SO U N D : at R100 million and above the following non-core asset disposal updates
are listed below:
Value Net Yield
Timeframe:18-24 months Property R’000 % Status
3 non-core assets under contract with net proceeds circa R93m 10 Mill Street 55 800 9.5 Sold and transferred
2 of 3 non-core disposals are full cash deals
Registered interest in hospitality assets. Offer received for Value Net
15 on Orange at R280m gross, only subject to due diligence and Property R’000 Yield Status
Competition Commission approval 12 Pickwick 30 000 9.57 Under DD
Spear notes strong investor interest in the price points of its 142 Edward 42 000 9.50 Under DD
earmarked assets for disposal
Island Business Park 21 000 10.00 Under negotiation
All disposals are in relative terms, priced fairly, located in popular
nodes, and with good quality tenants 15 on Orange 275 000 9.00 Under DD
All assets are in the Western Cape (best localised investment 368 000
region)
ALL PROCEEDS FROM DISPOSALS TO BE DEPLOYED INTO SPEAR’S DEBT
FACILITIES (STARTING WITH THE MOST EXPENSIVE DEBT, I.E. 9%).
/ Unaudited Consolidated Interim Results / for the six months ended 31 August 2020 / 20PORTFOLIO
5 /
OVERVIEW
100 Fairway Close, Parow
/ Unaudited Consolidated Interim Results / for the six months ended 31 August 2020 / 215 / PORTFOLIO OVERVIEW / R2.03BN 177 749M2 46%
TOP 5 PROPERTIES BY VALUE PORTFOLIO
TOTAL VALUE TOTAL GLA
GLA
MEGA PARK SABLE SQUARE 2 LONG STREET LIBERTY LIFE NORTHGATE PARK
BELVILLE CENTURY CITY CAPE TOWN CENTURY CITY BROOKLYN
VALUE (R’000) VALUE (R’000) VALUE (R’000) VALUE (R’000) VALUE (R’000)
437 000 436 436 420 000 387 000 346 000
SECTOR SECTOR SECTOR SECTOR SECTOR
INDUSTRIAL MIXED USE COMMERCIAL COMMERCIAL COMMERCIAL
GLA (M2) GLA (M2) GLA (M2) GLA (M2) GLA (M2)
86 195 31 100 25 207 18 244 17 002
TOTAL VALUE (%) TOTAL VALUE (%) TOTAL VALUE (%) TOTAL VALUE (%) TOTAL VALUE (%)
9.80 9.79 9.42 8.68 7.76
VALUATION (R/M2) VALUATION (R/M2) VALUATION (R/M2) VALUATION (R/M2) VALUATION (R/M2)
5 070 14 033 14 033 21 212 20 351
WALE (GLA) WALE (GLA) WALE (GLA) WALE (GLA) WALE (GLA)
29 MONTHS 53 MONTHS 29 MONTHS 46 MONTHS 33 MONTHS
/ Unaudited Consolidated Interim Results / for the six months ended 31 August 2020 / 225 / PORTFOLIO OVERVIEW /
SECTORAL SPLIT BY VALUE, REVENUE & GL A / INTERIM PERIOD
R449m R39m R6m 27 606m2
(1%) (2%) (6%)
(10%)
R40m 44 967m2
R1.14bn (16%) (10%)
R658m (26%) R82m
TOTAL
(15%) TOTAL REVENUE (34%)
VALUE OF PROPERTY SPLIT
PROPERTIES BY SECTOR 243 158m2
BY GLA
(EXCL. LEASE SMOOTHING) (54%)
R4.46BN R241M 453 016M 2
R2.17bn 137 285m2
R113m
(48%) (48%) (30%)
Industrial Commercial Retail Hospitality Development land
/ Unaudited Consolidated Interim Results / for the six months ended 31 August 2020 / 235 / PORTFOLIO OVERVIEW /
LE T TING ACTIVIT Y
T HE TABL E BE LO W REFL ECTS T HE L E T T I NG ACTI V IT Y FOR THE I NTER I M PER I OD:
Gross rental
Expiries and Gross rental Average gross Renewals/ at renewals/ Average gross Average rental
cancellations at expiry expiry rental new lets new lets new rental reversion
GLA R’000 R/m² GLA R’000 R/m² %
Commercial 19 147 2 615 374 136.60 11 589 1 783 625 153.91 12.68
Industrial 102 227 4 528 194 44.30 84 268 3 796 780 45.06 1.72
Retail 5 732 678 110 118.31 5 268 498 123 94.55 (20.08)
127 106 7 821 678 99.73 101 125 6 078 528 97.84 (1.90)
SPEAR’S LEASE EXPIRY PROFILE REM AINS DEFENSIVE WITH A WALE OF 28 MONTHS AND 43 MONTHS IN TERMS
OF WEIGHTED GL A EXPIRY
A total of 130 000m² is due for renewal in FY2021, with a total of 101 125m² which has either been renewed or re-let. The positive commercial rental reversion
is due to No.1 Waterhouse being re-let at 30% above the rental guarantee, which expired in June 2020. Retail reversion relates to two retail tenants and is in
line with management’s expectations and budgets.
Post interim period update: Negotiations regarding the letting of 30 000m² of space to Grindrod Logistics and Nampak Limited have been successully concluded.
Spear’s lease expiry profile remains defensive with a WALE of 28 months.
Spear’s asset and property management team has a hands-on approach to tenant retention and action tenant engagements well in advance of expiry to ensure
business continuity and risk management for the business.
/ Unaudited Consolidated Interim Results / for the six months ended 31 August 2020 / 245 / PORTFOLIO OVERVIEW /
TEN ANT AND VACANCY PROFILE
ANALYSIS OF THE PROPERTY PORTFOLIO AN ANALYSIS OF THE PROPERTY PORTFOLIO IN RESPECT OF
AS AT 31 AUGUST 2020 TENANT PROFILES IS PROVIDED BELOW
TOTAL GLA NUMBER OF TENANTS
VACANCY 39 920M2 = 8.81% 453 016 442
(Due to aggressive letting and successful tenant retention programmes)
12 255M 2 Based on GLA Large national and international tenants,
COMMERCIAL
29% large listed tenants, government and major
franchisees
221M 2 114 Tenants
HOSPITALITY
National tenants, smaller listed
Based on GLA
3 756M 2 tenants, franchisees, medium to
RETAIL
39 920M 2 54% large professional firms
261 Tenants
8.81% 16 170M 2 Based on GLA
Other
7 518M 2
REDEVELOPMENT* 8%
INDUSTRIAL
* 10-year lease signed. Work commenced 67 Tenants
in October 2020 with completion in
March 2021.
* When excluded actual vacancy drops to Based on GLA Vacant AT END
9%
5.4% AUGUST 2020
/ Unaudited Consolidated Interim Results / for the six months ended 31 August 2020 / 255 / PORTFOLIO OVERVIEW /
LEASE EXPIRY BY GL A / L EAS E EX P I RY P R O FI L E B AS ED O N GL A AS AT 3 1 AU GU S T 2020
Total Total Total Total Total Total Total
9% 2% 16% 15% 18% 10% 30%
100%
90%
80%
70%
60%
50%
40%
30%
20%
18%
10% Average
0%
Vacant Monthly Expiries Expiries Expiries Expiries Expiries
09/2020 09/2021 09/2022 09/2023 09/2024
– 08/2021 – 08/2022 – 08/2023 – 08/2024 onwards
Industrial Commercial Retail Hospitality
/ Unaudited Consolidated Interim Results / for the six months ended 31 August 2020 / 265 / PORTFOLIO OVERVIEW /
VALUATIONS
Development
Industrial Commercial Retail Hospitality land Total
Average value per property (excluding land) (R’000) 114 100 155 000 109 739 224 472 – 138 074
Average value per square metre (R) 4 692 15 806 14 643 16 263 – 9 753
Average discount rate (%) 14.15 14.07 14.00 * N/A 14.07
Average exit cap rate (%) 9.65 9.57 9.50 * N/A 9.57
Average prior year exit cap rate (%) 9.03 9.00 8.92 * N/A 8.98
Structural vacancy range (%) 0.5 – 2 0.5 – 2 0.5 – 2 * N/A 0.5 – 2
Void period range (months) 2–4 2–4 2–4 * N/A 2–4
* Hospitality has not been internally valued at interim period. Management has devalued the hospitality assets in three prior consecutive reporting periods and it will be further reviewed
at year-end.
Each property analysed in terms of location, quality, strength of covenant and lease term taking into consideration the Covid-19 operating environment
Adopted a conservative approach to valuations through the increase of capitalisation rates between 0.25% – 0.75%
The average exit capitalisation rate increased by 0.59%:
– Industrial: 0.63%
– Commercial: 0.57%
– Retail: 0.58%
Further prudent adjustments include:
– 2 – 4 months average vacancy void periods provided
– 0.5% – 2% of income structural vacancy and bad debt contigency provided
Portfolio devaluation of R81.2m (-1.81%)
/ Unaudited Consolidated Interim Results / for the six months ended 31 August 2020 / 275 / PORTFOLIO OVERVIEW /
SUSTAIN ABILIT Y UPDATE
RISK MANAGEMENT
Seven new sites will begin construction
RENEWABLE ENERGY within 4–6 weeks of lockdown lifting,
adding another 1 300 kWp of solar to
Six contracts out of 16 properties have solar under the portfolio and a further 2 million kWh.
construction or installed. These are: These properties are:
• Viking Park Phase 1 - complete • Liberty Life Building
• Viking Park Phase 2 - complete • No.1 Waterhouse
• 78 on Edward - complete • MWEB
• No. 2 Estuaries - complete • Manhattan Plaza
• Sable Square - complete • Northgate Park
• Mega Park - complete • Nampak Warehouse
Approximately 4 000 000 kWh of solar energy will be • Radnor Road*
generated over the next 12 months on the above properties
This is a savings of around R4m at current tariffs * The PV solar installation is part of
The average penetration ratio is 25% – 30% the Donate Your Roof Programme
where all income/proceeds
generated from the solar plant
are donated to the Women’s
THIS GIVES A TOTAL GENERATION CAPACITY OF 2 600 KWP OUT OF THE Property Network Educational
Trust. The latter funds a Property
5 400 KWP IDENTIFIED
Studies degree for a previously
disadvantaged female.
/ Unaudited Consolidated Interim Results / for the six months ended 31 August 2020 / 286 / SECTORAL PERFORM ANCE
15 on Orange, Cape Town
/ Unaudited Consolidated Interim Results / for the six months ended 31 August 2020 / 296 / SECTORAL PERFORM ANCE
RE TAIL
RE TAIL (44 967M 2 GL A)
All retail assets are classified as convenience retail
Retail portfolio occupancy: 91.65%
Collections have been 88.32% versus revenue billed for the period to date
Spear provided credits and deferments to retail tenants to the following values: R4.2m (credits)
and R0.5m (deferments)
May – August 2020 credits / deferments have reduced significantly due to tenants reopening
Sable Square, Century City
under Level 4 onwards
During all levels of lockdown our retail assets have performed in line with expectations with all
anchor tenants operating under Level 5 lockdown
R IS K S
Letting activity in line with expectations with the bulk of renewals being concluded per Lower level of income risk as 100% of tenants
management’s budgets for the period are trading and paying rent
No significant retail tenant failures occurred during the interim period, however, Spear has Gyms taking longer to recover to pre-lockdown
elected to not raise rental on gyms of which there are two within the retail portfolio levels requiring longer-term lease restructures
Encouraging tenant feedback received on trading conditions Pressure on consumer spending as SA recession
deepens, potentially impacting convenience
Spear has no exposure to Edcon or Massmart retail sector and tenants’ rental obligations
/ Unaudited Consolidated Interim Results / for the six months ended 31 August 2020 / 306 / SECTORAL PERFORM ANCE
COMMERCI AL
COMMERCI AL (137 285M 2 GL A)
All Spear’s commercial assets are located in highly attractive and established office nodes in
Cape Town
Office portfolio occupancy: 91.07%
Collections have been 95.70% versus revenue billed for the period to date
Spear provided credits and deferments to office tenants to the following values: R3.5m
(credits) and R3.1m (deferments)
No.2 Estuaries, Century City
May – August 2020 credits / deferments have reduced significantly due to tenants reopening
under Level 4 onwards
Spear’s portfolio is attractively positioned to offer expansion and / or contraction space to
R IS K S
third-party tenants due to its attractive lease terms and generally below-market asking rentals
Asking rentals to soften as vacancies may rise
In certain parts of the portfolio tenants have needed to increase their premises to comply with higher than normal
Covid-19 social distancing requirements
Increased vacancy equals increased competition
In other parts of the portfolio headwinds have emerged as kneejerk reactions to cut overheads for tenants
led to non-renewal of certain office premises within the portfolio (the space in reference has
Generally, the potential is high for negative rental
been relet at a higher rental)
reversions across the office sector
The impact of loadshedding has caused tenants to rethink their decisions to work from home
Cost of installation of tenants will increase
/ Unaudited Consolidated Interim Results / for the six months ended 31 August 2020 / 316 / SECTORAL PERFORM ANCE
INDUSTRI AL
INDUSTRI AL (243 158M 2 GL A)
Spear’s industrial portfolio has been exceptionally resilient during the interim period with a
number of new lets and relets taking place in a very challenging market
Industrial portfolio occupancy: 90.26%* (6.65% of vacancy relates to the No.1 Beacon Way
redevelopment)
Collections have been 96.25% versus revenue billed for the period to date
Spear provided credits and deferments to industrial tenants to the following values: R2.5m
(credits) and R2.6m (deferments)
May – August 2020 credits / deferments have reduced significantly due to tenants reopening
under Level 4 onwards
The vast majority of Spear’s industrial tenants were able to operate from Level 4 lockdown
onwards
R IS K S
Loadshedding may have a negative impact on manufacturing tenants
Labour relations / Trade unions
Increased capital requirements to maintain quality of industrial assets
Major market or tenant failures
Radnor Road, Parow
/ Unaudited Consolidated Interim Results / for the six months ended 31 August 2020 / 326 / SECTORAL PERFORM ANCE
HOSPITALIT Y
HOSPITALIT Y (27 606M 2 GL A)
Sector hardest hit by the impact of Covid-19 15 O N O R AN G E HOT E L , C AP E TO WN
Management has eliminated hospitality income from its FY2021 forecasts
FY2020 hospitality comprised ±7% of group revenue 15 on Orange Hotel under lease to Marriott reopened on 8 September 2020
(Total group revenue FY2020 = R503m) Spear has zero exposure to 15 on Orange Hotel property-related expenses
Spear accrues rental on all hotel revenue generated on property
D O UB LE T R E E BY HI LTO N, C AP E TO W N Marriott remains responsible for all sales and marketing of the hotel with numerous
accommodation and conference enquiries already being received for periods from
Generated R2.5m during Level 4 lockdown through repatriation services November 2020 onwards
Prepared and distributed 50 000 meals to the needy and homeless in Woodstock, Salt River R104 000 rental for September 2020
and Cape Town CBD R100 000 estimated rental for October 2020
Since 1 August 2020 corporate travel accommodation and conference bookings for
September 2020 onwards have been received
Post aggressive cost-cutting hotel breakeven achieved at 48% occupancy R I S KS
Operating summary on occupancy forecast: Business travel market recovers slower than expected
November 2020 – forecast 22% occupancy (November) SA borders remain closed for international travel market
December 2020 – forecast 44% occupancy (December) MICE market becomes reluctant to meet in larger groups
January 2021 – forecast 30% occupancy (January) Geopolitical risks increase
February 2021 – forecast 35% occupancy (February)
Safety and security concerns
Average daily rate (ADR) forecast for the above period: R860 – R1 050
Prolonged finalisation of Covid-19 vaccine and global rollout
Rooms forecast to be sold from November 2020 – February 2021
= 11 109 (average monthly rooms sold = 2 800)
/ Unaudited Consolidated Interim Results / for the six months ended 31 August 2020 / 336 / SECTORAL PERFORM ANCE
ALL SE CTORS
GEN ER AL B U SINE SS CONTINUIT Y RISKS (ALL SECTORS)
Tenant cost of occupancy continues (local authority charges) to rise well ahead of inflation
Any new government restrictions that may limit tenant operations
Major market or tenant failures
Civil disobedience and property-related threats
Lack of government relaxation of foreign inbound travellers
Risk of second wave of infections
15 On Orange, Cape Town
/ Unaudited Consolidated Interim Results / for the six months ended 31 August 2020 / 34DEVELOPMENT AND
7 /
REDEVELOPMENT PROJECTS
Sable Square, Century City
/ Unaudited Consolidated Interim Results / for the six months ended 31 August 2020 / 357 / DEVELOPMENT AND REDEVELOPMENT PROJECTS
ORGANIC VALUE ADDITION
1 BEACON WAY
PHYSICAL ADDRESS:
1 BEACON WAY, BELLVILLE
LEASE PERIOD:
10 YEARS
TENANT:
NOVAMARINE (STURROCK GRINDROD)
GLA REDEVELOPED:
16 170m2
SECTOR:
INDUSTRIAL
REDEVELOPMENT COST:
R44.4M
TARGET YIELD:
9.04%
STATUS:
TARGET COMPLETION MARCH 2021
/ Unaudited Consolidated Interim Results / for the six months ended 31 August 2020 / 367 / DEVELOPMENT AND REDEVELOPMENT PROJECTS
ORGANIC VALUE ADDITION
NAMPAK WAREHOUSE
PHYSICAL ADDRESS:
7 HEWETT AVENUE, EPPING
LEASE PERIOD:
10 YEARS
GLA DEVELOPED:
2 000M2 AND NEW ROOF ON 12 500M2
SECTOR:
INDUSTRIAL
REDEVELOPMENT COST:
R34M
TARGET YIELD:
9.33%
STATUS:
TARGET COMPLETION
DECEMBER 2021
/ Unaudited Consolidated Interim Results / for the six months ended 31 August 2020 / 377 / DEVELOPMENT AND REDEVELOPMENT PROJECTS
ORGANIC VALUE GROW TH
MARINE PLACE
PHYSICAL ADDRESS:
MARINE DRIVE, PAARDEN ISLAND
GLA TO BE DEVELOPED:
52 000M2
SECTOR:
MIXED USE
DEVELOPMENT COST:
R1.4BN
TARGET YIELD:
10%
STATUS:
TARGET COMMENCEMENT TBA
/ Unaudited Consolidated Interim Results / for the six months ended 31 August 2020 / 388 / OUTLOOK AND PROSPECTS
2 Long Street, Cape Town
/ Unaudited Consolidated Interim Results / for the six months ended 31 August 2020 / 398 / OUTLOOK AND PROSPECTS
OUTLOOK
Macroeconomic conditions will remain very difficult to navigate Management will remain client-centric and focused on
sustainable cash flows as lease renewals and filling of
The recessionary environment may possibly impact income and growth
vacant space remain priority
opportunities over the balance of FY2021
Management will actively ensure that all health and safety
The core portfolio remains of high quality and defensive in nature,
protocols continue to be implemented across the portfolio
positioning Spear favourably to continue its successful navigation of the
current trading environment Rental recoveries will be maintained at the mid- to high-
Travel restrictions will impact tourism and the general services and road range
hospitality sector, prolonging the recovery armarked assets will be actively and successfully
E
Commercial office vacancies may trend upwards in the short term with disposed of in line with management’s LTV reduction
office user uptake normalising in the medium term as the work-from- strategy
home regime is not a one-size-fits-all solution
Spear will maintain its Western Cape-only focus and hands-on
With the exception of a second wave of Covid-19 infections, significant asset management approach
market or tenant failure or another government-imposed lockdown,
Management’s proximity to assets remains excellent
management is confident cash flow generation will be maintained on a
positive footing for the balance of FY2021.
/ Unaudited Consolidated Interim Results / for the six months ended 31 August 2020 / 408 / OUTLOOK AND PROSPECTS
PROSPECTS
MANAGEMENT WISHES TO PROVIDE GUIDANCE AS FOLLOWS:
P ROS P E CTS Remain in full compliance with all qualifying Regular cash flow analysis to stress test the cash
AN D G U I DAN CE requirements to remain a JSE-listed REIT and will
continue to be a distribution paying operation
flows on a rolling 12-month basis. This includes
a range of scenarios of tenant collections and
creditor requirements
Reduce pay-out ratio to 80% of funds for
It remains difficult to predict operations for the interim period and will advise of Management’s focus and energy remains on rental
the economic outcomes of the any changes in this regard for its final distribution preservation throughout this pandemic, lockdown
pandemic on the Real Estate for FY2021 and beyond
sector and on Spear as South No income forecast from the hospitality portfolio A further trading update and guidance on a final
Africa navigates its way through for FY2021 irrespective of low levels of revenue distribution per share will be made in a pre-close
the aftermath of the Covid-19 being generated post the interim period presentation prior to year-end
pandemic and the severely negative
economic consequences left in Spear continues to meet all its required funding pear to exit its hospitality assets in an orderly
S
covenants and remains sufficiently capitalised. manner over the next 12 – 24 months.
its wake. In the short term we
do not anticipate any significant
macroeconomic improvements in
the trading environment, making
the road ahead extremely tough Any changes in the above assumptions may affect management’s forecast for the year ending 28 February 2021.
and generally difficult to fully chart. The information and opinions contained above are recorded and expressed in good faith and are based upon reliable information provided to management.
No representation, warranty, undertaking or guarantee of whatsoever nature is made or given with regard to the accuracy and/or completeness of such information
and/or the correctness of such opinions.
The forecast for the period ending 28 February 2021 is the sole responsibility of the directors and has not been reviewed or audited by Spear’s independent external
auditors.
/ Unaudited Consolidated Interim Results / for the six months ended 31 August 2020 / 41TH AN K
YOU
QU E STIONS?
EMAIL QUESTIONS TO
INFO@SPEARPROP.CO.ZA
LIVE Q&A WITH CEO
AFTER PRESENTATION
2 Long Street, Cape Town
/ Unaudited Consolidated Interim Results / for the six months ended 31 August 2020 / 42You can also read


