Hibernia REIT plc

Company update July / August 2014
←
→
Page content transcription
If your browser does not render page correctly, please read the page content below
Hibernia REIT plc Company update July / August 2014
DISCLAIMER

This presentation (hereinafter "this document") has been prepared by Hibernia REIT plc (the "Company") and WK Nowlan REIT
Management Limited ("WNRML"), the Company’s investment manager, for information purposes only.
This document has been prepared in good faith but the information contained in it has not been independently verified and
does not purport to be comprehensive. The Company is not undertaking any obligation to provide any additional information or
to update this document or to correct any inaccuracies that become apparent. This document is neither a prospectus nor an
offer nor an invitation to apply for securities. The information contained in this document is subject to material updating,
completion, revision, amendment and verification. This document does not constitute or form a part of any offer for sale or
solicitation of any offer to buy or subscribe for any securities. Any prospective investor must make its own investigation and
assessments and consult with its own adviser concerning any evaluation of the Company and its prospects.
No representation or warranty, express or implied, is given by or on behalf of the Company, its group companies, WNRML or
any of their respective shareholders, directors, officers, employees, advisers, agents or any other persons as to the accuracy,
completeness, fairness or sufficiency of the information, projections, forecasts or opinions contained in this presentation. In
particular, the market data in this document has been sourced from third parties. Save in the case of fraud, no liability is
accepted for any errors, omissions or inaccuracies in any of the information or opinions in this document.
Certain information contained herein constitutes "forward-looking statements", which can be identified by the use of terms
such as "may", "will", "should", "expect", "anticipate", "project", "estimate", "intend", "continue", "target" or "believe" (or the
negatives thereof) or other variations thereon or comparable terminology. Due to various risks and uncertainties, actual events
or results or actual performance of the Company may differ materially from those reflected or contemplated in such forward-
looking statements. No representation or warranty is made as to the achievement or reasonableness of, and no reliance should
be placed on, such forward-looking statements. There is no guarantee that the Company will generate a particular rate of
return.
The Company has not been, and will not be, registered under the US Investment Company Act of 1940, as amended, and
investors are not entitled to the benefit of that Act. This Presentation is available only to persons who are (1) both Qualified
Institutional Buyers as defined in Rule 144A under the US Securities Act of 1933, as amended, as well as Qualified Purchasers
within the meaning of section 2(a)(51) of the US Investment Company Act of 1940, as amended, or (2) outside the United
States and not US persons as defined in Regulation S under the US Securities Act of 1933, as amended.

                                                                                                                                      2
Agenda

Operating and financial highlights

Market update

Acquisitions

Conclusion and outlook

                                     3
OPERATING AND FINANCIAL HIGHLIGHTS
Overview
Highly active period since full year results to 31 March 2014
– Completed eight acquisitions, totalling €267m, primarily of Dublin CBD offices
– Three new hires including CFO, bringing management team to 12
– Support from the wider WKN team of 33 people
Portfolio taking shape
– Have invested €336m, over 90% of net proceeds raised in December 2013, with a further €63m
committed
– Summary of portfolio statistics
– 76% (by cost) in Dublin CBD offices, remainder between residential and logistics, all within
Dublin
– Portfolio NIY 4.1% (4.7% post rent free periods / abatements)
– Strong reversionary potential: weighted average contracted rents for offices of €33 per sq. ft.
– Development project at Wyckham Point and development opportunities at Windmill Lane and
Gateway sites
Outlook
– Very high level of transaction volumes in Dublin office market currently and NAMA to accelerate
portfolio sell-down
– Management are finding attractive acquisition opportunities within the Dublin office market,
particularly in off-market and loan spaces
– Hibernia is considering various funding options: in first instance seeking to put in place debt
4
OPERATING AND FINANCIAL HIGHLIGHTS
Our strategy has not changed since our IPO
Investment criteria Target property types and locations
Balanced portfolio of property types Majority in Grade A or Grade B office buildings that can
be acquired close to or below replacement cost
− Principally institutional quality, well located, income Appropriate allocation to
producing commercial property − Retail assets with low tenant risk e.g. in Dublin’s prime
shopping districts that have historically performed well
− Up to 30% of portfolio allocated to “value-added” − Industrial assets in prime locations close to good
properties e.g. requiring refurbishment or tenanting transport links and leased to strong tenant covenants
− Prime Dublin residential, infill residential schemes in
− Full scale development not envisaged other than in close proximity to public transportation and within 6 miles
special circumstances of limited risk and not above 15% of CBD
of portfolio
Primarily Dublin CBD and Greater Dublin area Illustrative targeted portfolio breakdown
Lot sizes – typically €10m–€50m
Targeting Total Shareholder Return of 10-15% p.a.
(pre-taxation) with a substantial income element when fully
invested
Ability to enter joint ventures
Gearing not to exceed 50% of portfolio (Irish REIT Office Retail Industrial Residential
limit) and not expected to exceed 40% of portfolio at
time of borrowing
5
OPERATING AND FINANCIAL HIGHLIGHTS
Summary of acquisitions to date
Since commencing operations in January 2014, have deployed €336m (over 90% of net IPO proceeds) and have a further
€63m committed
Acquisitions to date
Acquisition Initial Acquisition Acquisition
Name Location completion date investment Type Net initial yield type structure
Dorville Portfolio (key Dundrum, 28‐Feb‐14 €67m Primarily n/a Off‐market Loan
asset: Wyckham Point) Dublin 16 Residential
New Century House Mayor Street, 01‐May‐14 €47m Office c.6%(1) Off‐market Property
Dublin 1
Gateway Site Newlands Cross, 07‐May‐14 €10.1m Industrial c.5%(2) On‐market Property
Dublin 22
Montague House and Hatch Street Upper 16‐May‐14 €18.3m(3) Office c.8% Off‐market Loan
Hardwicke House and Adelaide Road,
Dublin 2
Chancery Building and Chancery Lane, 30‐Jun‐14 €16m Office c.7% Off‐market Loan
Chancery Apartments Dublin 8
Notes
(1) Once rent abatement period ends in September 2015
(2) Gross initial yield
(3) Hibernia REIT has the right to take full ownership for an incremental €41.75m
6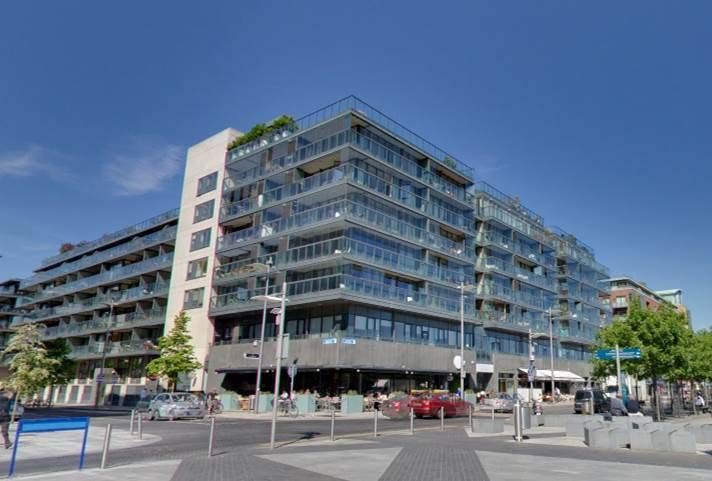
OPERATING AND FINANCIAL HIGHLIGHTS

Summary of acquisitions to date (cont’d)

Acquisitions to date
                                                                        Acquisition       Initial                                             Acquisition   Acquisition
                     Name                         Location              completion date   investment   Type               Net initial yield   type          structure

                     Hanover Building             Hanover Quay,         16‐Jun‐14         €20.2m       Office             c.7%                Off‐market    Loan
                                                  Dublin 2

                     Windmill Lane                Windmill Lane,        13‐Jun‐14         €7.5m        Development site   n/a                 Off‐market    Property
                                                  Dublin 2

                     Observatory                  Sir John Rogerson’s   16‐Jul‐14         €51.5m       Office             c.4%(1)             On‐market     Property
                                                  Quay,
                                                  Dublin 2

                     Guild House and              Guild Street,         18‐Jul‐14         €90.8m       Office             c.7%                Off‐market    Property
                     Commerzbank House            Dublin 1

                     Total                                                                €328m
                     Total including acquisition costs                                    €336m

  Since commencing operations in January 2014, have deployed €336m (over 90% of net IPO proceeds) and have a
                                            further €63m committed

Notes
(1) Once rent free periods end in 2015 and 2016

                                                                                                                                                                          7
Agenda

Operating and financial highlights

Market update

Acquisitions

Conclusion and outlook

                                     8
MARKET UPDATE

Irish economic backdrop supportive of
continued recovery in property market
Domestic demand to contribute to growth in 2014                                                                 Employment growth has picked up
        10%
                                                                                                                2%                                                                                        6%
         8%
                                                                                                                                                                                                          4%
         6%                                                                                                     1%
         4%                                                                                                                                                                                               2%
         2%                                                                                                     0%
                                                                                                                                                                                                          0%
         0%
% YoY

                                                                                                                -1%                                                                                       -2%
         -2%
                                                                                                                                                                                                          -4%
         -4%                                                                                                    -2%
                                                                                                                                                                                              Data
         -6%                                                                                                                                                                              released        -6%
         -8%                                                                                                    -3%                                                                      since IPO
                                                                                                                                                                                                          -8%
        -10%
                                                                                                                -4%                                                                                        -10%
        -12%
                                                                                                                   Q1 2007         Q1 2008   Q1 2009   Q1 2010     Q1 2011    Q1 2012   Q1 2013      Q1 2014
                    2003    2004   2005   2006   2007    2008   2009   2010   2011    2012   2013 2014f 2015f

                                             Domestic demand                  GDP                                                                Quarterly (LHS)             Annual (RHS)
Source: CSO, Goodbody                                                                                           Source: CSO

PMIs are well into positive territory                                                                           Consumer confidence has risen since the end of the bailout
65                                                                                                                 100

                                                                                                                        90
60
                                                                                                                        80
55
                                                                                                                        70
                                                                                                                Index

50                                                                                                                      60
                                                                                          Data                          50                                                                       Data
                                                                                      released                                                                                               released
45
                                                                                     since IPO                          40                                                                  since IPO

40                                                                                                                      30
        May   Jul    Sep Nov Jan Mar May         Jul    Sep Nov Jan Mar May     Jul    Sep Nov Jan Mar May                   Jan May Sep Jan May Sep Jan May Sep Jan May Sep Jan May Sep Jan May Sep Jan May
        11    11     11 11 12 12 12              12     12 12 13 13 13          13     13 13 14 14 14                        08 08 08 09 09 09 10 10 10 11 11 11 12 12 12 13 13 13 14 14

                           Services                     Manufacturing                    Composite
Source: Bloomberg, Markit                                                                                       Source: Factset

                                                                                                                                                                                                                  9
MARKET UPDATE
Commercial property market recovering
strongly, particularly office sector
Commercial property is continuing its recovery Capital values are currently at c.1999 levels
1,600 600
1,400 580
1,200 560
Capital value index
Capital value index
1,000 540
520
800
500
600
480 Data
400
released
460
200 since IPO
440
0
420
1977
1981
1984
1986
1988
1990
1992
1994
1996
1997
1998
1999
2000
2001
2002
2003
2004
2005
2006
2007
2008
2009
2010
2011
2012
2013
Q1 2012 Q2 2012 Q3 2012 Q4 2012 Q1 2013 Q2 2013 Q3 2013 Q4 2013 Q1 2014 Q2 2014
Source: Jones Lang LaSalle Source: Jones Lang LaSalle
Quarterly change in capital values by sector Quarterly change in rents by sector
7% 8%
Data Data
6%
released 6% released
5% since IPO since IPO
4% 4%
3%
2%
2%
Quarterly change
Quarterly change
0%
1%
0% -2%
-1%
-4%
-2%
-3% -6%
Q1 2012 Q2 2012 Q3 2012 Q4 2012 Q1 2013 Q2 2013 Q3 2013 Q4 2013 Q1 2014 Q1 2012 Q2 2012 Q3 2012 Q4 2012 Q1 2013 Q2 2013 Q3 2013 Q4 2013 Q1 2014
Retail Office Industrial Retail Office Industrial
Source: IPD Source: IPD
10MARKET UPDATE
Dublin residential market also showing
strong growth from depressed levels
Residential prices now growing across the country Average residential property prices
30% 500,000
450,000
20%
400,000
350,000
10%
300,000
% YoY
250,000
0%
200,000
-10% 150,000
100,000
Data Data
-20% released released
since IPO 50,000 since IPO
0
-30%
Jan 07 Jan 08 Jan 09 Jan 10 Jan 11 Jan 12 Jan 13 Jan 14
Dublin ex Dublin Dublin ex Dublin
Source: CSO Source: ptsb/ESRI, CSO, Goodbody
11MARKET UPDATE
Rental market: Dublin office dynamics
Number of Grade A vacant buildings in Dublin IFSC, 2 and 4 Vacant space by geography and quality
10 IFSC 5,000 Grade A
Dublin 2 Grade B
9
Dublin 4 Grade C
8 2 4,000
7
Thousands (sq.ft.)
6 3,000
3
5
4
2,000
7
3 Only 1 building of >50,000 sq. ft.
2
currently vacant, down from 5 at end of
1 Q2 2013
2 4
1 1,000
1 2 2
1 1
0
0 - 9,999 10,000 - 20,000 - 30,000 - 40,000 - 50,000 - 60,000 - 70,000 - 80,000 - 90,000 - 100,000 - 150,000 0
sq.ft. 19,999 29,999 39,999 49,999 59,999 69,999 79,999 89,999 99,999 149,999 sq.ft.+
sq.ft. sq.ft. sq.ft. sq.ft. sq.ft. sq.ft. sq.ft. sq.ft. sq.ft. sq.ft IFSC Dublin 2 Dublin 4 Rest of Dublin
Dublin City
Source: Jones Lang LaSalle Source: Jones Lang LaSalle
Q2 take-up of 0.42m sq. ft. brings the year to date take up to 1.02m sq. ft.
Total take up for 2014 expected to be in line with 2013’s total of 1.92 million sq. ft.
Currently 1.3 million sq. ft. of active requirements in the market
Prime quoted rents in the city centre have increased to €45 per sq. ft. with rents in excess of €40 per sq. ft. being achieved
Evidence of longer leases of 20 – 25 years is more common in the market with first break options at year 10 in the city centre
CBRE forecasting prime rents at c.€60psf by 2020(1)
Source: Jones Lang LaSalle Dublin Office Market Report Q2 2014, (1) CBRE Outlook 2014
12MARKET UPDATE
Rental market: Dublin office dynamics (cont’d)
Dublin office take-up expected to be c.2m sq.ft. in 2014 Dublin geographic take-up
3.0 100%
90%
2.5 36%
80% 44% 41%
48%
2.0 70%
60%
Million sq.ft.
1.5
50%
1.0 40%
30% 59% 64%
0.5 52% 56%
20%
0.0 10%
0%
H1 2014
1994
1995
1996
1997
1998
1999
2000
2001
2002
2003
2004
2005
2006
2007
2008
2009
2010
2011
2012
2013
2011 2012 2013 H1 2014
Forecast Take Up 20 Year Average City Centre Suburbs
Source: Jones Lang LaSalle Source: Jones Lang LaSalle
Vacancy reducing and very limited new supply Q2 2014 Dublin take-up by sector
40 5.0
30 4.0
Suburbs 373,697 sq.ft.
3.0
20
Million sq.ft.
2.0
10 1.0
0 0.0 CBD 650,649 sq.ft.
Q4 2001
Q4 2002
Q4 2003
Q4 2004
Q4 2005
Q4 2006
Q4 2007
Q4 2008
Q4 2009
Q4 2010
Q4 2011
Q4 2012
Q4 2013
Q2 2014
TMT Transport and Storage
Insurance and Pension Funds Banking and Fin.
Occupied Stock Vacant Stock Under Construction Other
Source: Jones Lang LaSalle Source: Jones Lang LaSalle
13MARKET UPDATE
Investment market: volumes of transactions
picking up sharply
5,000
4,500
4,000
3,500
3,000
€ millions
2,500
2,000
1,500 Ø €1,152m
1,000
500
0
2002 2003 2004 2005 2006 2007 2008 2009 2010 2011 2012 2013 2014
Total Investment Volumes Loan Sales Forecast Direct & Loan 12 year average
Note: Excludes IBRC loan sales of €9.3bn nominal value
H1 direct property sales of €1.7bn have already achieved 90% of total volume for 2013, when €1.9bn was transacted
Large supply pipeline in H2 2014, with NAMA, Bank of Ireland and Ulster Bank expected to be the most significant sellers
Source: Jones Lang LaSalle
14MARKET UPDATE
Irish property market recovery leading to
increased disposals by NAMA in Ireland
NAMA’s Irish disposals continue to increase… …as focus shifts away from London back towards Ireland
Cumulative Irish Disposals by NAMA (€m) Irish Disposals as a % of NAMA total
3,000
2,500
2,000
50%
1,500
1,000
22%
500 13%
0
Q1'10 Q3'10 Q1'11 Q3'11 Q1'12 Q3'12 Q1'13 Q3'13 Q1'14 2012 2013 2014 YTD July
“ To date in 2014, our (total) sales are over €5bn. 50% of that has come from Irish sales
”
Frank Daly, NAMA Chairman, 4 July 2014
Senior figures within NAMA and the Irish government are suggesting that the rate of Irish disposals is likely to increase
“ New redemption target of 80% (of NAMA senior debt) by 2016
Michael Noonan, Minister of Finance, 16 July 2014
” “ We currently estimate that we will need to sell about €6bn in Irish
assets over the period from 2014 to 2016
”
Brendan McDonagh, NAMA CEO, 29 May 2014
Sales of NAMA-owned assets in Ireland have accelerated in recent months and this trend looks set to continue
Source: NAMA, Investec, press reports
15MARKET UPDATE
NAMA’s portfolio well suited to Hibernia’s
investment proposition
NAMA loans: split by geography (Dec-13) NAMA loans in Dublin: split by type (Dec-13)
Hotel & Other
Leisure 3%
5%
Rest of World
10%
Office
Land
Rest of 24%
13%
Britain
12%
Dublin 43% of
€19.6bn(1) 38% NAMA’s total €7.5bn(2)
portfolio is
London Dublin based
18% Development
15% Retail
18%
64% of
DCB Industrial NAMA’s
Cork 5% Residential
20% 2% Dublin assets
Rest of 6%
in Hibernia
Ireland
target sectors
4%
Limerick
Northern
1% Galway Ireland
2% 4%
Within the Dublin area, commercial office space and
A significant portion of NAMA’s portfolio is in central
other Hibernia investment priorities make up the
Dublin and the adjacent commuter belt
majority of assets
DCB = Dublin Commuter Belt
Source: NAMA, Investec
Note: Split of AuM in NAMA portfolio as of 31-Dec-2013
(1) NAMA carrying value of loans (total portfolio) as at 31-Dec-13
(2) NAMA carrying value of loans in Dublin as at 31-Dec-13
16MARKET UPDATE
Investment market: availability of assets
Total value of commercial property transactions has increased significantly since IPO
NAMA See prior slides
Acceleration of sales expected to hit new target of redeeming 80% of senior debt (a cumulative €24 billion) by 2016
Banks IBRC: The Residential Mortgage loan sale, completed on 6 June 2014, resulted in the disposal of 64% of IBRC’s
Residential Mortgage book
Ulster Bank: Disposal of £9bn in Irish investment and development loans kicked off in February 2014 with €850m sale
process for portfolio of commercial loans
Permanent TSB: To sell commercial loan book of €2.6bn
Domestic banks: continue to make selective loan sales
Other Private equity funds, active over last 18 months in Ireland, have become increasingly active in other EU markets and
some are exploring opportunities to exit Irish assets particularly where project management expertise is required
JV opportunities – NAMA has confirmed it will engage in JV opportunities with suitable partners, as have some PE
funds, and these opportunities will most likely emerge where project management expertise is required
JLL forecasting direct property and commercial loan transactions totalling €4bn in 2014(1)
(1) Source: Jones Lang LaSalle
17Agenda
Operating and financial highlights
Market update
Acquisitions
Conclusion and outlook
18ACQUISITIONS
Location of Hibernia acquisitions
Office acquisitions all within CBD; ex-CBD acquisitions both
with good transport links Central Dublin acquisitions
Dublin
The Ward Airport Fairview Park
Croke Park
M1
Portmarnock
N2/M2
Northwest
Business Park M50
Northern
Cross
N3/M3 Ballymun
Sutton
Blanchardstown Beaumont
Kings Inns
Howth
Castleknock Drumcondra Clontarf
North Bull
N4/M4 Phibsborough Island 2 9
Palmerstown Alexandra Basin
Dublin River Liffey
92
8
6
8
54
7 7 6
N81
Ballsbridge
Clondalkin Kimmage 5
3 Ballymount
N7/M7 Blackrock
St. Stephens
Rathfarnham 1 Wyckham Point
Green
M50
Dundrum 2 New Century House
1
Tallaght 3 Gateway Site
N11
4 Glenageary
Montague House and Hardwicke House
4
5 Chancery Building and Chancery Apartments
M50
6 Hanover Building
7 Windmill Lane
8 Observatory
Herbert Park
9 Guild House and Commerzbank House
Source: Google Maps, Visit Dublin, Jones Lang LaSalle
Note: Hibernia acquisitions shown in red.
19ACQUISITIONS
Summary of Dorville portfolio loan acquisition
Off–market acquisition of €67m Dorville loan portfolio from Ulster Bank
Gaining access to a portfolio of 16 assets, principally residential
Hibernia to retain three “core” assets and undertake phased disposal of the other assets
Summary
Core assets Ascribed value
Wyckham Point Residential €30m
Cannon Place Residential €6m
South Dock House Office €5m
€41m
Non core assets Ascribed value
8 residential assets €19m
2 office assets €2m
3 development assets €5m
€26m
20ACQUISITIONS
Wyckham Point
Acquisition type Dundrum, Dublin 16
Acquired as part of €67m Ulster Bank loan portfolio
Off-mkt On-mkt
Apportioned value of c. €30m
Property Loan
Comprises:
Dev. opportunity
– Wyckham Point – 213 partially completed apartments
– Mix of one, two and three bed apartments
Property type
– Excellent amenities incl. 3 acre park with lake, gym, creche
Office
Prime south Dublin residential location
Grade A
– Good transport links
CBD
– close to Dundrum Shopping Centre
Income producing
Value-add space
Retail
Low tenant risk
Prime Dublin
Industrial
Prime location
Good transport
links
Strong covenant
Residential
Wyckham Point planned timeline to complete
Infill Q2 2014 Q3 2014 Q4 2014 Q1 2015 Q2 2015 Q3 2015 Q4 2015 Q1 2016
Good transport
links Stage 1 - Pre Construction
Stage 2 - Construction
Stage 3 - Turn-key fit-out
21ACQUISITIONS
Cannon Place
Acquisition type Herbert Road, Dublin 4
Acquired as part of €67m Ulster Bank loan portfolio
Off-mkt On-mkt
Apportioned value of €6m
Property Loan
Comprises 12 two and three-bed apartments in a 22 unit apartment block
Dev. opportunity
Well-located modern estate
– Walking distance from Sandymount and Ballsbridge villages
Property type
– Close to Lansdowne DART station and the Aviva Stadium
Office
Grade A
CBD
Income producing
Value-add space
Retail
Low tenant risk
Prime Dublin
Industrial
Prime location
Good transport
links
Strong covenant
Residential
Infill
Good transport
links
22ACQUISITIONS
South Dock House
Acquisition type 1st Floor Offices, Hanover Quay, Dublin 2
Acquired as part of €67m Ulster Bank loan portfolio
Off-mkt On-mkt
Apportioned value of c.€5m, equating to €530psf capital value
Property Loan
Asset comprises
Dev. opportunity
– One floor of 8,942 sq ft in three office suites with parking for 9 cars
– Let to 3 tenants (Open Hydro Ireland, Collins Stewart, Guggenheim Partners)
Property type
– Annual rent of €312k, average of €35psf
Office
– WAULT of three years
Grade A
CBD
Income producing
Value-add space
Retail
Low tenant risk
Prime Dublin
Industrial
Prime location
Good transport
links
Strong covenant
Residential
Infill
Good transport
links
23ACQUISITIONS
New Century House
Acquisition type Mayor Street, IFSC Dublin 1
Acquisition price €47m: equating to €587psf capital value
Off-mkt On-mkt
Asset comprises
Property Loan
– 80,000 sq ft offices over six storeys with parking for 87 cars
Dev. opportunity
– Let to Bank of Ireland on FRI lease until 2024, with upward-only rent review
in 2019
Property type
– Annual headline rent €2.85m, or €32psf, with rental abatement until
Office October 2015
Grade A – Initial yield (post-abatement period): c.6%
CBD Significant refurbishment work is about to be implemented by the tenant
Income producing
Value-add space
Retail
Low tenant risk
Prime Dublin
Industrial
Prime location
Good transport
links
Strong covenant
Residential
Infill
Good transport
links
24ACQUISITIONS
Gateway Site
Acquisition type Newlands Cross, Naas Road, Dublin 22
Acquisition price: €10.1m
Off-mkt On-mkt
Comprises
Property Loan
– 14.1 acres (5.71 ha) with three large industrial/logistics facilities of 177,960 sq. ft.
Dev. opportunity
– Buildings currently 46% occupied and producing an annual rental income of €517k
or c.€5.5psf
Property type
– Initial yield c.5%
Office
Strategic location adjacent to intersection of Ireland’s two busiest roads and Dublin’s
Grade A light rail system
CBD Significant redevelopment potential
Income producing
Value-add space
Retail
Low tenant risk
Prime Dublin
Industrial
Prime location
Good transport
links
Strong covenant
Residential
Infill
Good transport
links
25ACQUISITIONS
Montague House & Hardwicke House
Acquisition type Hatch Street Upper & Adelaide Road, Dublin 2
Acquisition price: €60m, equating to €692psf capital value
Off-mkt On-mkt
Acquisition from Hardwicke Group in partially deferred transaction structure
Property Loan
– Initial acquisition of €18.25m of loans (giving operational control) with NIY of
Dev. opportunity
7.7%
– Right to take full ownership of the buildings any time up to mid-2016 for
Property type incremental €41.75m
Office Assets comprise
Grade A – 88,483 sq ft of prime Grade A office space in two 5 storey buildings on contiguous
CBD back-to-back sites with 56 basement car parking spaces
Income producing – Both multi-let at avg rent of €30psf (Hardwicke €34psf, Montague €27psf)
Value-add space – WAULT of 7 years
Retail – 100% of rent to be reviewed during or prior to 2018
Low tenant risk
– 28% with break clauses in 2016
Prime Dublin
Industrial
Prime location
Good transport
links
Strong covenant
Residential
Infill
Good transport
links
26ACQUISITIONS
Chancery Building & Chancery Apartments
Acquisition type Chancery Lane, Dublin 8
Acquisition price: €16m
Off-mkt On-mkt
Acquiring loans from Bank of Ireland, giving full ownership of assets
Property Loan
Assets comprise
Dev. opportunity
– a) office building with 33,799 sq. ft. space over 6 stories with 19 parking spaces
– Allocated price of €15m for the offices equates to cap. val. of €445psf
Property type
– Fully let with WAULT of 9 years and 2 years to break
Office
– Average passing rent of €30psf
Grade A – Net initial yield 6.8%
CBD – b) four 2 bed apartments in same building with separate entrance
Income producing – Fully let on 1 year contracts
Value-add space
Retail – Allocated price of €1m for the apartments equates to a net initial yield
Low tenant risk 6.1%
Prime Dublin – c) a small 0.05 acre site with planning consent for a c. 13,900 sq. ft. NIA office
building or a 45 ‘suite’ student accommodation building
Industrial
Prime location
Good transport
links
Strong covenant
Residential
Infill
Good transport
links
27ACQUISITIONS
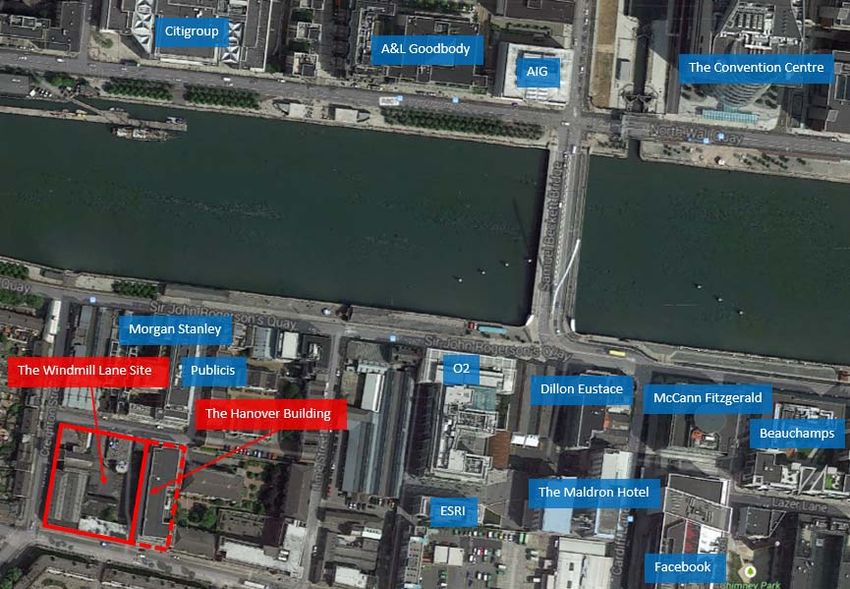
The Hanover Building
Acquisition type Windmill Lane, Dublin 2
Acquisition price: €20.2m, equating to €360psf cap. val. and 7.3% NIY
Off-mkt On-mkt
Asset comprises 5 storey building and 13 underground parking spaces with:
Property Loan
– a) 44,317 sq. ft. of office space on upper floors
Dev. opportunity – Fully let to BNY under leases running to 2026/7 with break clause in 2016
– Average passing rent on office space of €30psf
Property type
– b) 11,614 sq. ft. of retail space on ground floor
Office
– Fully let to Eurospar to 2032 with break clause in 2019
Grade A
– Office and retail income all subject to rent reviews in 2017 and 2018
CBD South Docks area one of most popular office locations in recent years
Income producing
Adjoins the 1 acre Windmill Lane Site acquired in simultaneous transaction from a
Value-add space
separate seller
Retail
Low tenant risk
Prime Dublin
Industrial
Prime location
Good transport
links
Strong covenant
Residential
Infill
Good transport
links
28ACQUISITIONS
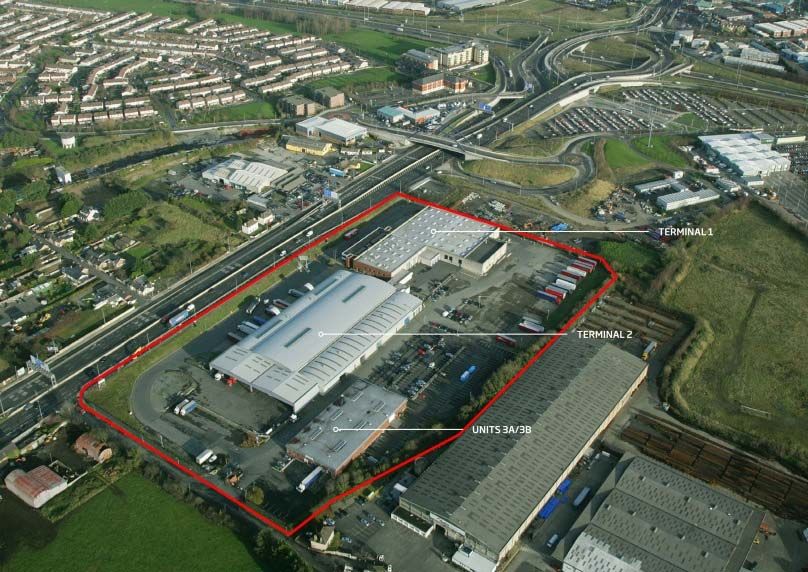
Windmill Lane Site
Acquisition type Windmill Lane, Dublin 2
Acquisition price: €7.5m
Off-mkt On-mkt
1 acre development site adjoining Hanover Building in South Docks area
Property Loan
Existing planning consent for:
Dev. opportunity – 125,000 sq. ft. (net) office space
– 9,000 sq. ft. retail
Property type
– 15 residential units
Office
Price paid for land equates to €50psf on the net developable space
Grade A
12 month option to a party to invest on a side by side, equal cost basis on the
CBD
redevelopment of the Hanover Building and the Windmill Lane Site
Income producing
Value-add space
Retail
Low tenant risk
Prime Dublin
Industrial
Prime location
Good transport
links
Strong covenant
Residential
Infill
Good transport
links
29ACQUISITIONS
The Observatory Building
Acquisition type Sir John Rogerson’s Quay, Dublin 2
Off-mkt On-mkt
Acquisition price €51.5m
Property Loan Asset comprises
Dev. opportunity – a) 84,000 sq ft office over six storeys with parking for 47 cars
– Allocated price of €49.8m for the offices equates to cap. val. of €590 psf
Property type – 95% let with WAULT of 11 years and 4 years to break
Office – Tenants include Riot Games, Publicis, Morgan Stanley & Realex Payments
Grade A – Low average rent of €26psf
CBD – Annual headline rent of €2.2m, with rent frees on €1.2m ending in 2015 and
Income producing early 2016
Value-add space – Initial yield (post-rent free periods): c.4.1%
Retail – b) Eight partially completed 2 bed “live / work” units and two retail units
Low tenant risk – Allocated price of €1.7m
Prime Dublin
Industrial
Prime location
Good transport
links
Strong covenant
Residential
Infill
Good transport
links
30ACQUISITIONS
Guild & Commerzbank House
Acquisition type Guild Street, IFSC, Dublin 1
Off-mkt On-mkt Acquisition price €90.75m
Property Loan Purchase of two adjoining buildings in the IFSC. The buildings comprise:
Dev. opportunity – 144,250 sq. ft. of office accommodation over five storeys with parking for 148
cars
– Cap. val. of €629 psf
Property type
– 100% let with WAULT of 3 years to break and 11 years to expiry
Office
– Tenants include FBD Holding Ltd, BNY Mellon and Commerz Management
Grade A Services
CBD – Average rent of €39psf
Income producing – Annual headline rent of €6.1m
Value-add space
Retail – Initial yield: 6.6%
Low tenant risk
Prime Dublin
Industrial
Prime location
Good transport
links
Strong covenant
Residential
Infill
Good transport
links
31Agenda
Operating and financial highlights
Market update
Acquisitions
Conclusion and outlook
32CONCLUSION AND OUTLOOK
Conclusion
Highly active period since full year results to 31 March 2014
– Completed eight acquisitions, totaling €267m, primarily of Dublin CBD offices
– Three new hires including CFO, bringing management team to 12
– Support from the wider WKN team of 33 people
Portfolio taking shape
– Have invested €336m, over 90% of net proceeds raised in December 2013, with a further €63m
committed
– Summary of portfolio statistics
– 76% (by cost) in Dublin CBD offices, remainder between residential and logistics, all within
Dublin
– Portfolio NIY 4.1% (4.7% post rent free periods / abatements)
– Strong reversionary potential: weighted average contracted rents for offices of €33 per sq. ft.
– Development project at Wyckham Point and development opportunities at Windmill Lane and
Gateway sites
Outlook
– Very high level of transaction volumes in Dublin office market currently and NAMA to accelerate
portfolio sell-down
– Management are finding attractive acquisition opportunities within the Dublin office market,
particularly in off-market and loan spaces
– Hibernia is considering various funding options: in first instance seeking to put in place debt
33Agenda
Appendix
34APPENDIX
Strong board with mix of property and plc
experience
Hibernia REIT plc Danny Kitchen Stewart Terence Colm Bill Nowlan
Independent Harrington O’Rourke Barrington Non-Executive
Non-Executive Independent Non-Executive Independent Director
Chairman Non-Executive Director Non-Executive
Director Director
Non-Executive Chairman of Non-Executive Director of BWG Non-Executive Director of The Irish Non-Executive Chairman of Aer Previously Head of Property
Workspace Group plc and Group and Stafford Holdings Times and Chairman of Enterprise Lingus plc and CEO and Director of Investment of Irish Life from 1985
Governance Non-Executive Director of LXB Previously a Partner Jones Lang Ireland Fly Leasing Ltd to 1995, the largest property fund
Retail Properties plc Wootton (now Jones Lang LaSalle) Previously Managing Partner KPMG manager in Ireland. Established
Previously Finance Director of Founding Partner of Harrington Ireland WK Nowlan in 1995, one of the
Green Property plc Bannon Chartered Surveyors largest property asset managers in
Ireland
Breadth of skill set and experience encompassing institutional property management and development in prime
WK Nowlan REIT and value add space, with strong relationships with key decision makers in banking and property
Management
Kevin Nowlan Bill Nowlan Frank Kenny Frank O’Neill Tom Edwards-
Chief Executive Investment Portfolio Chief Operations Moss
Officer Director Management Officer Chief Financial
Director Officer
>20 years of experience in the >40 years of experience advising >35 years of experience in the >20 years of experience in the Previously worked for 9 years at
Irish property market on investment in Irish commercial Irish and US property markets Irish property market Credit Suisse in Investment
Management Previous positions include Senior property Founder and CEO of Willett Previously, manager of WK Nowlan Banking Division with a particular
Portfolio Manager at NAMA, Previously Head of Property Companies LLC, boutique Property Management Division, focus on corporate finance in the
Portfolio Manager at Treasury Investment of Irish Life from 1985 investment company which covering Irish and UK properties real estate sector. He qualified as
Holdings and Assistant Manager at to 1995, the largest property fund managed, developed and/or owned a Chartered Accountant at
Anglo-Irish Bank plc manager in Ireland. Established 2 million sq ft of real estate PricewaterhouseCoopers in 2005
WK Nowlan in 1995, one of the
largest property asset managers in
Ireland
WK Nowlan
Property
WK Nowlan is a property asset management company staffed by 33 professional staff with capacity to execute multiple
transactions simultaneously
The team has a broad mix of skills covering all the key professional aspects of property management and development:
surveyors and valuers, architects, engineers, portfolio managers and financial analysts
Support Capacity to execute multiple transactions simultaneously
Ability to manage complex commercial and residential projects
35APPENDIX
Financial highlights as of 31 March 2014
Financial highlights
31 March 2014 Gateway Site acquired [ ]
Balance sheet €’000 Notes
Loans acquired from Ulster Bank (Wyckham assets)
Loans 68,563 Principally cashfrom
Loans acquired + cash equivalents
Ulster of [ ]assets)
Bank (Wyckham
Current assets 303,337 Principally cash + cash equivalents of €291.7m
Current liabilities (934) Principally accrued acquisition costs and other trade payables
Net assets 370,966
EPRA NAV per share 96.4 cents
Income statement 31 March 2014 Notes
Reflects operating expenses of €1.2m and modest interest income on cash
Net loss (846)
deposits
Basic and diluted loss per share (0.22) cents
Financials reflect the fact most of the acquisitions did not close in the first 90 days of operations
36APPENDIX
Overview of the Irish REIT regime
Summary of Irish REIT regime
Summary of Irish REIT regime
Established Introduced by Finance Act 2013
Legal form Irish incorporated PLC company with an allotted share capital of not less than €38,092
Shareholder requirements No closely held company; 10% threshold for corporate shareholders
Listing requirements Listed on the main market of a stock exchange in an EU Member State
Business restrictions >75% of aggregate income derived from property rental business
>75% of portfolio market value must relate to property rental business
Within 3 years of commencement, the REIT must hold at least 3 separate assets, none of which having a market value >40%
of total portfolio
Irish and non-Irish assets
Authorised sectors: commercial properties, industrial properties, residential properties
Leverage restrictions Profit financing ratio of at least 1.25 : 1
Profit financing ratio = property income plus property finance costs divided by property finance costs
Tax Tax exemption for certain income from property rental business, 12.5% for non property rental income
Tax exemption for capital gains, 33.0% for non property rental assets
Dividend withholding tax of 20.0%
Irish stamp duty of 1.0% apply to the purchase of shares in a REIT
Distribution requirements Property income: 85%
Capital gains: no distribution obligation
Source: European Public Real Estate Association
3738
You can also read