Effect of cryogenic freezing on the rheological and calorimetric properties of pasteurized liquid egg yolk
←
→
Page content transcription
If your browser does not render page correctly, please read the page content below
Czech Journal of Food Sciences, 39, 2021 (3): 181–188                                                       Original Paper

https://doi.org/10.17221/37/2021-CJFS

Effect of cryogenic freezing on the rheological and
calorimetric properties of pasteurized liquid egg yolk
Karina Ilona Hidas1*, Csaba Németh2, Lien Phuong Le Nguyen1,3,
Anna Visy1, Adrienn Tóth1, Annamária Barkó1, László Friedrich1,
Attila Nagy2, Ildikó Csilla Nyulas-Zeke1
1
 Institute of Food Science and Technology, Hungarian University of Agriculture and Life Sciences,
  Budapest, Hungary
2
 Capriovus Ltd., Szigetcsép, Hungary
3
 Institute of Biotechnology and Food Technology, Industrial University of Ho Chi Minh City,
  Ho Chi Minh, Vietnam
*Corresponding author: hidas.karina.ilona@phd.uni-szie.hu, hidaskarina@gmail.com

Citation: Hidas K.I., Németh Cs., Le Nguyen L.P., Visy A., Tóth A., Barkó A., Friedrich L., Nagy A., Nyulas-Zeke I.Cs. (2021):
Effect of cryogenic freezing on the rheological and calorimetric properties of pasteurized liquid egg yolk. Czech J. Food Sci.,
39: 181–188.

Abstract: The egg yolk undergoes an irreversible gelation process when freezing to –6 °C or lower. In this experiment,
liquid egg yolk (LEY) was frozen in liquid nitrogen and stored at –18 °C for 150 days. The measurement of pH and co-
lour of LEY were performed. The examination of the rheological and calorimetric properties of samples was also carried
out. The results indicated that the pH of LEY changed significantly during frozen storage, increasing from 6.37 ± 0.02
to 6.58 ± 0.03 over five months. The colour of the samples also showed a significant change compared to the fresh sam-
ple. The rheological properties of the LEY also changed significantly after 1 day of freezing and during frozen storage,
with a clear increasing trend of the yield stress. The results of the calorimetric study showed that freezing and frozen
storage did not affect the denaturation temperature, however, the denaturation enthalpy was reduced by about half after
five months of frozen storage.

Keywords: differential scanning calorimetry; Herschel-Bulkley model; frozen storage; liquid nitrogen; shear test

   Eggs are widely used as food ingredients in the food in-         However, the supply chain of eggs sometimes had
dustry due to their nutritional value. Egg contains high-        a temporary interruption or an increase in prices. Be-
-quality proteins, essential long-chain fatty acids, iron,       tween January 2014 and November 2016, 13 strains
phosphorus, trace minerals and vitamins A, D, E, K,              of avian influenza were identified in 77 countries.
and B (Chambers et al. 2016). Moreover, the coagu-               As a result, hundreds of wild and domestic birds had
lating, foaming, emulsifying, colouring, and flavour-            to be killed (OIE 2020). It is also important to men-
ing properties are prominent (Lai 2016). Nowadays,               tion the 2017 European "poisonous eggs" case caused
the market of processed egg products is on the rise              by fipronil identified in eggs, which affected at least
(Bertechini 2016). The products from the so-called               40 countries. Millions of eggs were recalled, costing
"first processing" are liquid, frozen, and powdered egg          the industry millions of dollars (Tu et al. 2019).
products, which are marketed mainly in the food in-                 During the temporary shortage of eggs, the use
dustry. These products are used for a wide variety               of products with a longer shelf life, such as frozen
of purposes, such as ingredients of pasta, dairy prod-           liquid egg products, as a raw material for various
ucts, mayonnaise, sauces, and salad dressings (Prima-            food products becomes evident. Frozen egg products
cella et al. 2018).                                              can be kept for up to a year under appropriate con-

                                                                                                                          181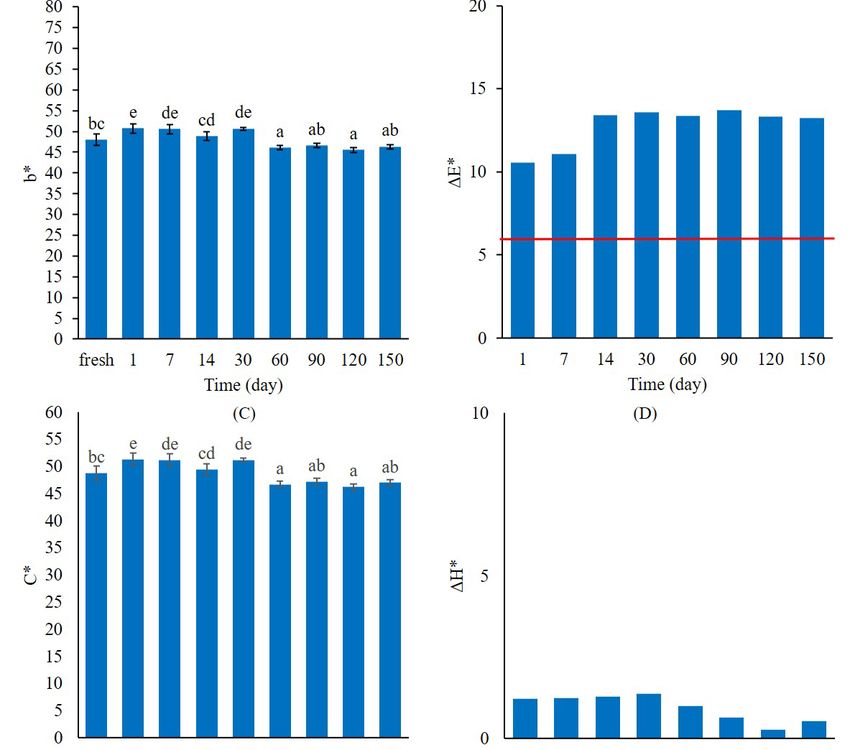
Original Paper                                            Czech Journal of Food Sciences, 39, 2021 (3): 181–188

                                                                                https://doi.org/10.17221/37/2021-CJFS

ditions (Au et al. 2015). While only minor changes                LN (purity: 99.995%; boiling point at atmospheric pres-
in egg white occur during freezing, egg yolk occurs             sure: –196 °C; stored in Dewar container at 0.3–0.5 MPa
a phenomenon called gelation when cooled to –6 °C               overpressure) was provided by Messer Hungarogáz
or below (Lai 2016). The results of the gelation pro-           Ltd. (Hungary).
cess are an irreversible loss of fluidity, an increase
in viscosity and a decrease in the functionality and            Freezing of LEY
dispersibility of the egg yolk (Au et al. 2015).                  Figure 1 shows the cryogenic freezing procedure.
   Au et al. (2015) experimented with freezing egg yolk         Cryogenic freezing was performed on liquid egg drops
at –20 °C for 168 days and studied the gelation process         formed by a steel strainer [Figure 1(3)] (d = 1.5 mm)
and kinetics. They found that the rheological proper-           for 60 s in LN [Figure 1(2)]. The volume of LN was kept
ties were affected significantly by the length of frozen        constant at 10 L during the experiment. 3 L of LEY
storage. Both plasma and granules were found to be in-          [Figure 1(1)] was poured into LN in 100 mL portions.
volved in the gelation process. Fernández-Martín et al.         LN began to boil at a temperature of –196 °C due
(2018) also examined the effect of magnetic assisted            to the temperature difference between the LN and
freezing on the gelation of yolk. According to their            the LEY and the room temperature of 10 °C. Frozen
result, this freezing technique had significant effect          pellets were separated by a strainer [Figure 1(4)] from
on the thermal denaturation, free sulfhydryl content,           LN. Sample pellets were filled into polypropylene bags
emulsifying activity, emulsifying stability, colour, and        and stored at –18 ± 1 °C for 150 days. Figure 2 shows
rheological characteristics.                                    the flowchart of the experiment.
   Researchers concluded that freezing is a time-tem-
perature dependent technique (Lopez et al. 1954). Fast          Measurements
freezing rates can be achieved at very low temperature            Sampling was carried out on day 0 (before cryogenic
[–78.5 °C with CO2 and –195.8 °C with liquid nitrogen           freezing) and 1, 7, 14, 30, 60, 90, 120, and 150 days after
(LN)] (Mulot et al. 2019). Lopez et al. (1954) found            frozen storage. The yolks were thawed at 4 °C for 24 h
that egg yolk frozen in LN and thawed at 54 °C suffers          before analysis.
from a very low degree of gelation, while after thawing
at room temperature, the degree of gelation was me-
dium. Jaax and Travnicek (1968) stated that freezing                (1)
in LN has a significant effect on the apparent viscosity
of egg yolk if thawed at 35 °C.                                                                                      (3)
   In previous studies about cryogenic freezing, sam-
ples were usually thawed at warm temperature, which
                                                                    (4)
is not easy to apply in the industry. In addition, the ef-
fect of frozen storage after cryogenic freezing were not
evaluated. Therefore, the aim of this study was to in-
vestigate the effect of cryogenic freezing and subse-
quent frozen storage on the LEY. The calorimetric and
the rheological properties of LEY were investigated
during the storage.                                                 (5)

MATERIAL AND METHODS
                                                                                                                     (2)
Material
  Pasteurised LEY [pH = 6.37 ± 0.02; dry matter con-
tent: 44.21 ± 0.86% (w/w)] was obtained from a liquid
egg plant (Capriovus Ltd., Hungary). LEY was pasteur-
ized for 600 s at 65 °C with a flow rate of 600 kg h–1          Figure 1. Cryogenic freezing procedure during the experi-
(Actitube; Actini, France) and filled into Elopak carton        ment; (1) sample inlet, (2) polystyrene container filled with
boxes with the filling mass of 1.0 kg. The shelf life of this   liquid nitrogen, (3) steel strainer to form the drops of liquid
product is 3 days, and it should be stored between 0 °C         egg yolk, (4) steel strainer to remove the formed frozen pel-
and 4 °C. Samples were stored at 4 °C until treatment.          lets, (5) the blue oval indicates the level of liquid nitrogen

182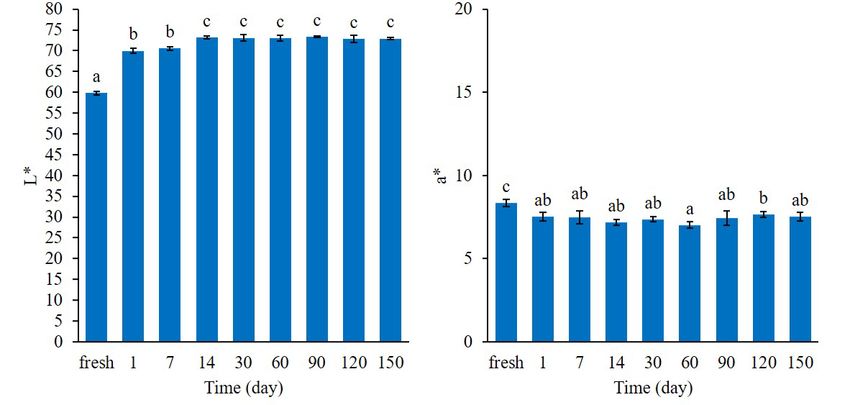
Czech Journal of Food Sciences, 39, 2021 (3): 181–188 Original Paper
https://doi.org/10.17221/37/2021-CJFS
by differential scanning calorimeter MicroDSC III
Liquid egg yolk (Setaram, France). The samples of 210 ± 5 mg were
put into 1 ml aluminium pans and sealed. Samples
were heated from 20 °C to 95 °C with a heating rate
of 1.5 °C min–1, then cooled to 20 °C with a cooling
Cryogenic freezing (liquid rate of 3.0 °C min–1 (MicroDSC III; Setaram, France).
nitrogen 60 s) Distilled water was used as reference sample. All data
were processed with Calisto Processing software (Se-
taram, France). Straight baselines were set to the cool-
ing phase of the thermograms and transition enthalpy
Packaging [ΔH, (J g–1)] was determined from the peak area. De-
naturation temperature [T, (°C)] was also recorded.
Measurement was performed in triplicate.
Storage at –18 °C Examination of rheological properties. Exami-
for 5 months nation of the rheological behaviour of LEY was per-
formed by MCR 92 rheometer (Anton Paar, France)
in rotational mode equipped with a concentric
cylinder (cup diameter 28.920 mm, bob diameter
Sampling Figure 2. Flowchart
26.651 mm, bob length 40.003 mm, active length
of the experiment
120.2 mm, positioning length 72.5 mm). Anton Paar
RheoCompass software (version 1.21.852) was used
Determination of pH and dry matter content. to control the equipment. The temperature of rheo-
The pH of samples was measured at 4 °C using a por- logical measurements was kept constant at 4 °C. Shear
table digital pH meter (206-pH2; Testo SE & Co. stress was measured by increasing and decreasing
KGaA, Germany). shear rate between 1 and 1 000 s–1 for 31 measure-
Moisture was determined by drying of around 2 g LEY ment points with a period of 3 s.
sample in an air-forced oven (Labor Műszeripari Művek, The Herschel-Bulkley model (Equation 1) was used
Hungary) at 105 °C until constant mass. The difference to analyze the flow curves (shear rate-shear stress dia-
between the initial and final dry mass was considered grams). This model was used to describe the rheologi-
as dry matter content and calculated as percentages cal properties of LEY at 4 °C. All R2 values of the fitted
on the initial mass. The measurements were per- model were higher than 0.99.
formed in triplicate.
Colour measurement. Tristimulus colour measure- τ = τ0 + K γ n (1)
ment was performed with a Konica-Minolta CR-410
chromameter (Konica Minolta Sensing Inc., Japan) where: τ – shear stress (Pa); τ 0 – yield stress (Pa);
at 4 °C. L* is the CIE lightness coordinate of the sam- γ – shear rate (s–1), K – consistency coefficient (Pa sn);
ple, a* is the CIE red(+)/green(–) colour attribute and n – flow behaviour index (dimensionless).
the b* is the CIE yellow(+)/blue(–) colour attribute,
respectively (Pathare et al. 2013). Measurements were Statistical analysis. Data were collected, pre-processed
performed in 5 replicates. Euclidean distance (ΔE*) was and visualized on charts using Microsoft Excel (ver-
calculated according to Kim et al. (2014) to compare sion 16.45). The Kolmogorov–Smirnov test was used
the colour of frozen-thawed and fresh LEY. The ranges to test the normality of the pH, dry matter content,
of ΔE* were 0–0.5 (not noticeable), 0.5–1.5 (slightly colour, differential scanning calorimetric, and rheolog-
noticeable), 1.5–3.0 (noticeable), 3.0–6.0 (well visible), ical variables. Levene's test was used to test the homo-
and > 6.0 (great), based on a previous study (Cserhal- geneity of variances. Analysis of variance (ANOVA)
mi et al. 2006). Chroma (C*) was calculated according along with post hoc tests was used to compare the vari-
to Ahn and Lee (2008) and hue difference (ΔH*) was ables of samples examined at different times. In case
calculated according to Perez et al. (2011) to compare of homogeneity of variances (pH, a*, b*, C*, dena-
the hue of frozen-thawed and fresh LEY samples. turation enthalpy, τ0, K and n) Tukey test was per-
Differential scanning calorimetry. Calorimet- formed. Games-Howell test was used in case of not
ric properties of the LEY samples were examined equal variances (L*) to determine different inter-
183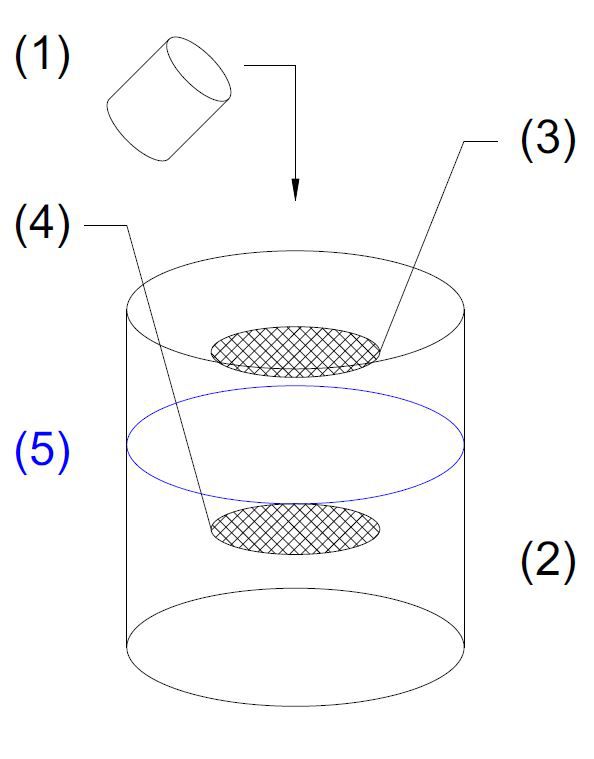
Original Paper Czech Journal of Food Sciences, 39, 2021 (3): 181–188
https://doi.org/10.17221/37/2021-CJFS
vals. Data analysis was carried out by SPSS Statistics The a* values decreased (Figure 3B), which means that
software 22 (IBM, US). the LEY lost its red colour as a result of freezing. Minor
fluctuations in red colour are seen during frozen stor-
RESULTS AND DISCCUSION age. The b* values increased with freezing (Figure 3C),
which means a stronger yellow colour. During long term
Changes in pH. The results of the pH measurement storage, by day 60, the b* values decreased significantly.
are shown in Table 1. The pH of the LEY can be high- As a result of freezing, the total colour difference (ΔE*)
er than that of the yolk of the freshly laid egg around between the fresh LEY and the frozen-thawed samples
pH 6.0 (Mine 2008). Huang et al. (1997) observed that was great on each measurement days. The C* value
slow freezing at –15 °C caused a significant change changed significantly during frozen storage (Figure 3D),
after one day of frozen storage. According to the re- its trend was the same as the trend of b*. However,
sults, pH did not alter significantly on day 1, but a slight the ΔH* showed a small difference compared to the con-
decrease can be seen. This study reports an increasing trol sample (Figure 3E). This shows that the main change
trend in pH from day 1 to day 150. Significant change occurred in the L* values.
was observed on day 14 and day 120. The increasing Rheological properties. Rheological behaviour plays
trend in pH during frozen storage was also observed an important role in the industrial practice during ma-
by Huang et al. (1997) during a frozen period of 60 days. terial handling. Figure 4 shows the results of the rheo-
Changes in colour. Colour has a very important logical analysis obtained in this study, where samples
role in the perception of food products, and it is also were examined freshly and after freezing and thawing
a key aspect in case of determination of food quality throughout storage period. LEY has non-Newtonian
(Bovšková et al. 2014). The colour properties of LEY be- flow behaviour even in the fresh and frozen-thawed
fore freezing and during the storage period are shown state. This means that they do not have a constant vis-
in Figure 3. The results show that L* values increased cosity, but apparent viscosity and shear stress values de-
significantly during the 150 days of frozen storage (Fig- pending on flow conditions (Figura and Teixeira 2007).
ure 3A). The increase occurred in the initial phase (in the Among the non-Newtonian fluids, LEY shows pseudo-
first 14 days), and no significant change was seen there- plastic flow behaviour characterized by a convex pro-
after. The effect of cryogenic freezing on lightness is ob- file on the shear rate-shear stress diagram (Severa et al.
vious. Huang et al. (1997) also stated that the L* value 2010). As the shear rate increases in such materials,
of the egg yolk increased after 1 day of frozen storage the shear stress increases due to the attenuation of mo-
at –15 °C, but longer frozen period did not cause signifi- lecular interactions (Figura and Teixeira 2007).
cant change until day 60, when a decrease was observed. The flow behaviour index (n) obtained by fitting
the Herschel-Bulkley model shows that fresh LEY
Table 1. The effect of cryogenic freezing and storage also has pseudoplastic behaviour (n < 1). According
period at –18 °C on the pH of liquid egg yolk to the results in this study, the rheological behaviour
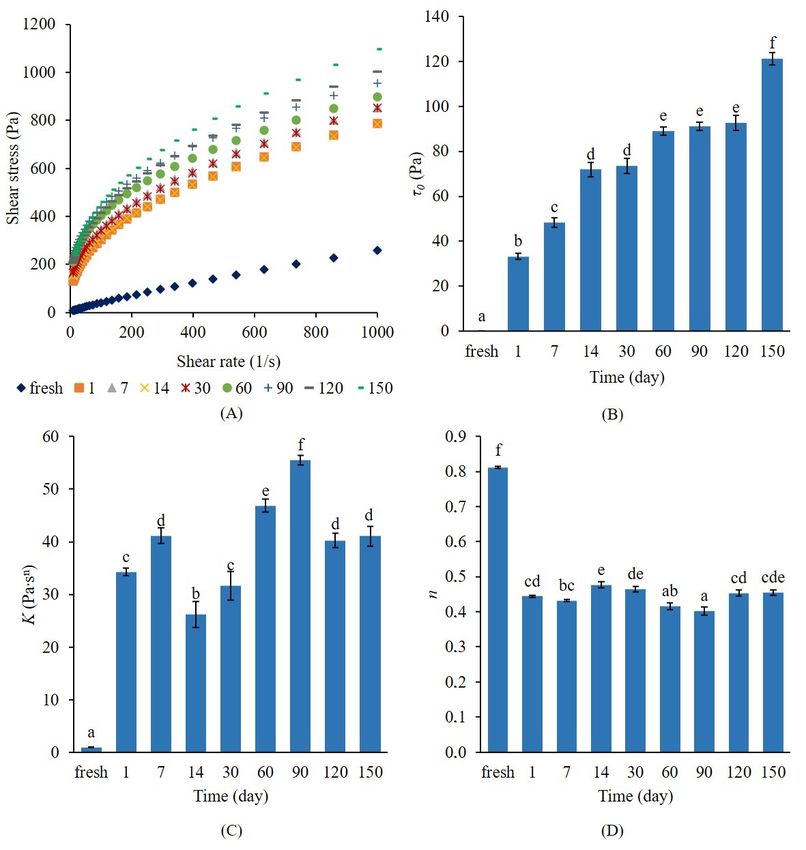
of LEY changed due to freezing and thawing. The shear
pH stress values showed a steady increase during the frozen
Time (day)
mean SD period (Figure 4A). Chang et al. (1977) also reported
0 (before freezing) 6.37 a
0.02 an increase in the shear stress and apparent viscosity
a
values of LEY even after 5 h of frozen storage.
1 6.35 0.03
After freezing and thawing, yield stress has appeared
a
7 6.36 0.03 in the rheological behaviour of LEY. In this case, initial
14 6.45 b
0.02 minimum shear stress is needed for the material to start
30 6.45 b
0.02 flowing (Larsson and Duffy 2013). Defining this parame-
ter is important in many aspects of processing, handling,
60 6.48b 0.03
storage, and performance properties. This study shows
90 6.46b 0.04 an increasing trend of yield stress value due to the fro-
120 6.55c 0.04 zen period from day 0 to day 14 (Figure 4B). No signifi-
150 6.58c 0.03 cant difference was detected between day 14 and day 30.
After a decrease on day 60, no significant change was
a,b,c
different letters show significant differences (P < 0.05) observed until day 120. At the end of the measurement,
in time; SD – standard deviation there was a strong increase in yield stress.
184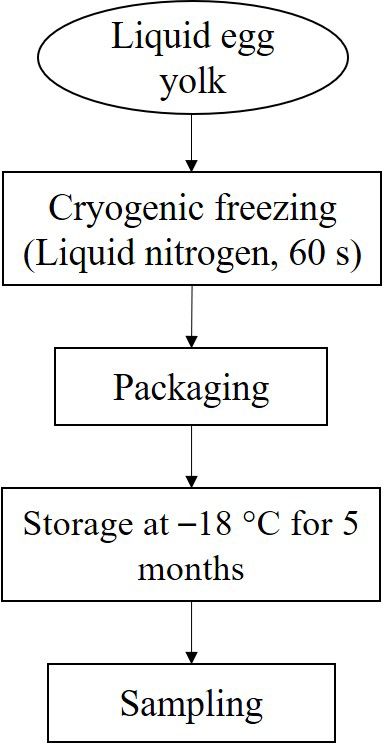
Czech Journal of Food Sciences, 39, 2021 (3): 181–188                                                                   Original Paper

https://doi.org/10.17221/37/2021-CJFS

            (A)     80                                            (B) 20
                    75                 c   c    c    c   c    c
                               b   b
                    70
                    65    a
                    60                                                 15
                    55
                    50
                    45
                    40                                                 10

                                                                  a*
               L*

                                                                                   c
                    35                                                                     ab ab ab ab         a
                                                                                                                   ab   b   ab
                    30
                    25
                    20                                                    5
                    15
                    10
                     5
                     0                                                    0
                         fresh 1   7   14 30 60 90 120 150                        fresh 1        7    14 30 60 90 120 150
            (C)                        Time (day)                   (D)                               Time (day)
                    80                                                    20
                    75
                    70
                    65
                    60                                                    15
                    55         e   de cd   de
                    50    bc                    a   ab   a   ab
                    45
                                                                    ΔL*

                    40                                                    10
               b*

                    35
                    30
                    25
                    20                                                        5
                    15
                    10
                     5
                     0                                                        0
                         fresh 1   7   14 30 60 90 120 150                             1     7       14    30 60 90 120 150
            (E)                        Time (day)                   (F)                                   Time (day)
                    60                                                     10
                    55         e   de cd   de
                    50   bc                         ab
                                                a        a   ab
                    45
                    40
                    35
                    30                                                        5
                                                                     ΔH*
              C*

                    25
                    20
                    15
                    10
                     5
                     0                                                        0
                          0    1   7   14 30 60 90 120 150                             1     7       14     30 60 90 120 150
                                       Time (day)                                                         Time (day)

Figure 3. Results of colour measurements; (A) lightness (L*), (B) redness (a*), (C) yellowness (b*), (D) Euclidean dis-
tance (ΔE*) between the colour of fresh liquid egg yolk and the egg yolk on the days after freezing [red horizontal
line – lower limit of the ΔE* range "great"], (E) chroma (C*), (F) hue difference (ΔH*) between the fresh liquid egg
yolk and frozen-stored samples
a–e
      Different letters show significant differences (P < 0.05) in time

                                                                                                                                   185
Original Paper Czech Journal of Food Sciences, 39, 2021 (3): 181–188
https://doi.org/10.17221/37/2021-CJFS
(A) (B)
1 200 140
f
120
1 000
100 e e
800 e
Shear stress (Pa)
80 d d
τ0 (Pa)
600
60
c
400
40 b
200
20
0 a
0 200 400 600 800 1000 0
Shear rate (1 s—1) fresh 1 7 14 30 60 90 120 150
Time (day)
fresh 1 7 14 30 60 90 120 150
(C) (D)
60 f 0.9
f
0.8
50 e
d 0.7
d d
40 0.6
c c e
K (Pa sn)
0.5 cd bc de cd cde
30 b ab
n
a
0.4
20 0.3
0.2
10
0.1
a
0 0.0
fresh 1 7 14 30 60 90 120 150 fresh 1 7 14 30 60 90 120 150
Time (day) Time (day)
Figure 4. Results of rheological analysis; (A) the effect of time on the flow curves of liquid egg yolk, data series marked
with different notations indicate samples tested on different days, numbers below the figure indicate storage period in days,
(B, C, D) the effect of time on the parameters of the Herschel-Bulkley model fitted to the flow curve of liquid egg yolk
a–f
Different letters show significant differences (P < 0.05) in time; τ0 – yield stress (Pa); K – consistency coefficient (Pa sn);
n – flow behaviour index (dimensionless)
However, for the consistency coefficient and flow be- observed from day 1 to day 28, the second stage between
haviour index values, no such clear trend can be seen. day 28 and day 84.
The value of the consistency coefficient shows the vis- In this study, the flow behaviour index values were
cosity of the material (Primacella et al. 2019). In this less than 1.0 (Figure 4D) like those of pseudoplastic
report, the consistency coefficient of the fresh sample fluids (Figura and Teixeira 2007). Cryogenic freezing
is clearly different from that of the frozen-thawed and thawing at 4 °C resulted in a significant change
samples (Figure 4C). However, during frozen stor- of flow behaviour index value. During the frozen
age, an upward trend is observed until day 7, followed period, a fluctuating trend is observed. However,
by a decline on day 14. From day 14 to day 90, its value as the consistency coefficient increased, the flow
rises again and then decreases on day 120. Au et al. behaviour index decreased and vice versa.
(2015) also reported the fluctuating rheological be- Calorimetric properties. Table 2 shows the results
haviour of LEY frozen at –20 °C and thawed at 25 °C. of the calorimetric measurements. The egg yolk con-
That research proposed a two-stage gelation process tains a large amount of lipoprotein, which DSC can-
during prolonged storage. The first proposed stage was not separate into fractions (Cordobés et al. 2003).
186Czech Journal of Food Sciences, 39, 2021 (3): 181–188 Original Paper
https://doi.org/10.17221/37/2021-CJFS
Table 2. The effect of cryogenic freezing and storage at –18 °C on the denaturation enthalpy and denaturation
temperature of liquid egg yolk
Denaturation enthalpy (J g–1) Denaturation temperature (°C)
Time (day)
mean ± SD mean ± SD
e
0 (before freezing) 1.01 ± 0.05 72.97 ± 0.20
1 0.85d ± 0.01 72.83 ± 0.18
c
7 0.74 ± 0.02 72.92 ± 0.30
14 0.69bc± 0.01 72.96 ± 0.31
b
30 0.65 ± 0.03 73.12 ± 0.19
b
60 0.65 ± 0.02 72.90 ± 0.19
90 0.64b ± 0.02 73.08 ± 0.14
a
120 0.55 ± 0.02 72.74 ± 0.17
150 0.52a ± 0.01 72.76 ± 0.35
a,b,c
different letters show significant differences (P < 0.05) in time; SD – standard deviation
REFERENCES
In this study, one well pronounced endothermic peak
can be seen on the heat flow curves in fresh and frozen-
-thawed samples. The enthalpy of the reaction, that Ahn J.S., Lee Y.K. (2008): Color distribution of a shade guide
is generally accepted as denaturation enthalpy (Arn- in the value, chroma, and hue scale. The Journal of Pros-
tfield and Murray 1981), was significantly reduced thetic Dentistry, 100: 18–28.
by storage time, but denaturation temperature had not Arntfield S.D., Murray E.D. (1981): The influence of process-
changed significantly. The enthalpy of denaturation ing parameters on food protein functionality I. Differential
already shows a large decrease on day 1 after freezing scanning calorimetry as an indicator of protein denatura-
and thawing, and the rate of decrease slows down dur- tion. Canadian Institute of Food Science and Technology
ing storage. After 5 months of storage, the denaturation Journal, 14: 289–294.
enthalpy of frozen-thawed yolk decreased half com- Au C., Acevedo N.C., Horner H.T., Wang T. (2015): Deter-
pared to that of fresh sample. According to Au et al. mination of the gelation mechanism of freeze–thawed
(2015), freezing in the first stage (from day 1 to day 28) hen egg yolk. Journal of Agricultural and Food Chemistry,
causes an aggregation of lipoprotein particles via hydro- 63: 10170–10180.
phobic interactions caused by water removal. In the sec- Bertechini A.G. (2016): Economic and cultural aspects
ond stage (from day 28 to day 84) of the gelation process of the table egg as an edible commodity. In: Hester P. (ed.):
the proteins are released. These protein interactions are Egg Innovations and Strategies for Improvements. Cam-
responsible for the decreasing denaturation enthalpy. bridge, United States, Academic Press: 223–232.
Bovšková H., Míková K., Panovská Z. (2014): Evaluation
CONCLUSION of egg yolk colour. Czech Journal of Food Sciences,
32: 213–217.
In this study, it was found that the gelation pro- Chambers J.R., Zaheer K., Akhtar H., Abdel-Aal E.-S.M.
cess also occurs after cryogenic freezing and thawing (2016): Chicken eggs. In: Hester P. (ed.): Egg Innovations
at cold temperatures. LEY underwent a clear discolou- and Strategies for Improvements. Cambridge, United
ration, and denaturation enthalpy decreased half due States, Academic Press: 3–11.
to protein interactions after freezing and frozen stor- Chang C.H., Powrie W.D., Fennema O. (1977): Studies
age. The rheological properties also changed as a result on the gelation of egg yolk and plasma upon freezing and
of cryogenic freezing, and they also changed continu- thawing. Journal of Food Science, 42: 1658–1665.
ously during frozen storage. Cordobés F., Partal P., Guerrero A. (2003): Rheology and
microstructure of heat-induced egg yolk gels. Rheologica
Acknowledgement. The authors acknowledge Acta, 43: 184–195.
the Doctoral School of Food Science of the Hungarian Cserhalmi Zs., Sass-Kiss Á., Tóth-Markus M., Lechner N.
University of Agriculture and Life Sciences for the sup- (2006): Study of pulsed electric field treated citrus juices. In-
port of this study. novative Food Science & Emerging Technologies, 7: 49–54.
187Original Paper Czech Journal of Food Sciences, 39, 2021 (3): 181–188
https://doi.org/10.17221/37/2021-CJFS
Fernández-Martín F., Pérez-Mateos M., Dadashi S., Gómez- Mulot V., Benkhelifa H., Pathier D., Ndoye F.-T., Flick D.
-Guillén C.M., Sanz P.D. (2018): Impact of magnetic assisted (2019): Measurement of food dehydration during freezing
freezing in the physicochemical and functional properties in mechanical and cryogenic freezing conditions. Interna-
of egg components. Part 2: Egg yolk. Innovative Food Sci- tional Journal of Refrigeration, 103: 329–338.
ence & Emerging Technologies, 49: 176–183. OIE (2020): Avian Influenza. World Organisation for Animal
Figura L., Teixeira A.A. (2007): Food Physics: Physical Health. Available at https://www.oie.int/en/animal-health-
Properties – Measurement and Applications. Heidelberg, in-the-world/avian-influenza-portal/ (accessed July 20, 2020).
Germany, Springer-Verlag Berlin Heidelberg: 117–206. Pathare P.B., Opara U.L., Al-Said F.A.J. (2013): Colour
Huang S., Herald T., Mueller D. (1997): Effect of electron measurement and analysis in fresh and processed foods:
beam irradiation on physical, physiochemical, and func- A review. Food and Bioprocess Technology, 6: 36–60.
tional properties of liquid egg yolk during frozen storage. Perez M. del M., Ghinea R., Herrera L.J., Ionescu A.M.,
Poultry Science, 76: 1607–1615. Pomares H., Pulgar R., Paravina R.D. (2011): Dental ceram-
Jaax S., Travnicek D. (1968): The effect of pasteurization, se- ics: A CIEDE2000 acceptability thresholds for lightness,
lected additives and freezing rate on the gelation of frozen- chroma and hue differences. Journal of Dentistry 39: 37–44.
defrosted egg yolk. Poultry Science, 47: 1013–1022. Primacella M., Wang T., Acevedo N.C. (2018): Use of re-
Kim E.J., Purswell J.L., Evans J.D., Branton S.L. (2014): constitued yolk systems to study the gelation mechanism
Production characteristics of Hy-Line W36 laying hens of frozen-thawed hen egg yolk. Journal of Agricultural and
hatched from white and tinted eggs. Poultry Science, Food Chemistry. 66: 512–520.
93: 2123–2128. Primacella M., Wang T., Acevedo N.C. (2019): Characteri-
Lai L.-S. (2016): Quality and safety of frozen eggs and egg zation of mayonnaise properties prepared using frozen-
products. In: Sun D.-W. (ed.): Handbook of Frozen Food thawed egg yolk treated with hydrolyzed egg yolk proteins
Processing and Packaging. Florida, United States, CRC as anti-gelator. Food Hydrocolloids, 96: 529–536.
Press: 529–548. Severa L., Nedomová Š., Buchar J. (2010): Influence of stor-
Larsson M., Duffy J. (2013): An overview of measurement ing time and temperature on the viscosity of an egg yolk.
techniques for determination of yield stress. Annual Trans- Journal of Food Engineering, 96: 266–269.
actions of the Rheology Society, 21: 125–138. Tu Q., Hickey M.E., Yang T., Gao S., Zhang Q., Qu Y., Du X.,
Lopez A., Fellers C.R., Powie W.D. (1954): Some factors af- Wang J., He L. (2019): A simple and rapid method for de-
fectin gelation of frozen egg yolk. Journal of Milk and Food tecting the pesticide fipronil on egg shells and in liquid eggs
Technology, 17: 334–339. by Raman microscopy. Food Control, 96: 16–21.
Mine Y. (2008): Egg Bioscience and Biotechnology. John
Hoboken, United States, Wiley & Sons: 307–325.
Received: January 4, 2021
Accepted: April 12, 2021
188You can also read