Neurotransmitter excitatory amino acids in synovial fluids demonstrate distinct temporal fluctuations in active arthritis - OAText
←
→
Page content transcription
If your browser does not render page correctly, please read the page content below
Rheumatology and Orthopedic Medicine

    Research Article                                                                                                                       ISSN: 2399-7370

Neurotransmitter excitatory amino acids in synovial
fluids demonstrate distinct temporal fluctuations in active
arthritis
Terry A McNearney1, Niti Goel2, Jeffrey R Lisse3 and Karin N Westlund4*
1
 Department of Internal Medicine, University of Texas Medical Branch, Galveston, TX
2
 Kesar Life Sciences, San Francisco, CA
3
 Eli Lilly and Co., Indianapolis, IN
4
 Department of Anesthesiology & Critical Care Medicine, University of New Mexico School of Medicine, Albuquerque, NM

Abstract
Objective: This case study presents concentrations of synovial fluid (SF) neurotransmitter excitatory amino acids (EAA) glutamate (Glu) and aspartate (Asp) and
tumor necrosis factor-alpha (TNFα) in patients with acute onset and chronic arthropathies over time.
Methods: SF samples were sequentially obtained daily from both knees of a patient with acute clinically distinct flares of pseudogout. Two SF samples (same knee)
were also obtained from 3 rheumatoid arthritis (RA) patients during active flares. SF EAA and other amino acids (AA) were measured by HPLC, TNFα levels by
immunoassay, and SF WBC counts by hemocytometer. SF EAA, other AA and TNFα levels are presented as ratios derived from matched cadaveric SF samples with
no antemortem history of active arthritis.
Results: Sequential SF Glu and Asp levels from 3 of 4 patients demonstrated impressive fluctuations over time spans from days to years. SF Glu, Asp and serine (Ser)
levels were several-fold to higher than other SF AA levels from the patient with pseudogout flares and demonstrated fluctuations over days. Increases in SF WBC
counts and Glu levels preceded increases in SF TNFα levels and WBC counts also showed temporal fluctuations.
Conclusion: SF neurotransmitter Glu and Asp level fluctuations were independent of other AA levels or other joint compartments. SF EAA Glu and Asp may
reflect and/or further impact ongoing inflammatory intra-articular processes. Further studies will elucidate their utility in arthritis as biomarkers or as novel anti-
inflammatory targets. An understanding of their fluctuations in acute arthritis could inform the management of joints in the immediate post-trauma setting.

Introduction                                                                          when she abruptly developed acute, de novo, bilateral, knee synovitis.
                                                                                      These arthritic pseudogout flares diagnosed for each knee were
     Neurotransmitter excitatory amino acids (EAA) glutamate (Glu)                    clinically distinct from the other knee for which she underwent daily,
and aspartate (Asp) may play a role as initiators or potentiators of the              sequential, bilateral knee arthrocenteses. The arthritic flares resolved
adaptive immune responses leading to inflammation in experimental                     within two weeks of presentation. Additionally, two SF samples from 3
and human synovitis [1-3]. In a previous study using single time                      patients during active RA flares, collected at time point ranges spanning
point collections of repository fluids, we found mean synovial fluid                  months to years were assessed to represent concentration fluctuations
(SF) neurotransmitter Glu and Asp levels corrected to age matched                     over time in the setting of a human chronic arthropathy.
nonarthritic cadaveric SF samples (Patient: Cadaver concentration
ratios) were 4.61-fold and 2.15-fold above other nonspecific amino                    Materials and Methods
acids (AA), respectively, for all reported arthritis categories [4].
Mean SF Glu and Asp concentrations were highest in the robustly                       Patients
inflammatory arthropathies, e.g., Reiter’s syndrome, systemic lupus                      Synovial fluid samples were collected and stored from patients
erythematosus, septic arthritis, rheumatoid arthritis (RA) and acute                  who underwent diagnostic or therapeutic arthrocenteses as part of the
crystal arthropathies (gout). Conversely, the lowest mean SF Glu and                  Gulf Coast Arthritis Registry-Serology, (GCARS) at the University of
Asp concentrations were obtained from arthropathies with generally
lower inflammatory indices, e.g., osteoarthritis (OA) and mild trauma
cases.                                                                                *Correspondence to: Karin Westlund High, Department of Anesthesiology
                                                                                      & Critical Care Medicine, University of New Mexico School of Medicine,
     We hypothesized that SF EAA and tumor necrosis factor alpha
                                                                                      Albuquerque, NM, Tel: 5052727417; E-mail: khigh@salud.unm.edu
(TNFα) levels in flares of active human synovitis would fluctuate,
reflecting dynamic microenvironments of the targeted joint space, as                  Key words: glutamate, aspartate, serine, TNFa. Neuroinflammation
noted in inflammatory arthritis models [2,3,5,6]. In the present study,               Received: November 28, 2018; Accepted: December 05, 2018; Published:
a hospitalized patient was convalescing from an acute medical illness                 December 11, 2018

Rheumatol Orthop Med, 2018         doi: 10.15761/ROM.1000161                                                                                       Volume 3(4): 1-5
McNearney TA (2018) Neurotransmitter excitatory amino acids in synovial fluids demonstrate distinct temporal fluctuations in active arthritis

Texas Medical Branch, Galveston, TX. The samples and medical record                Cadaveric control samples
reviews were obtained under patient consent and IRB approval. The
                                                                                       Synovial fluid was harvested from cadavers to serve as nonarthritic
SF samples were obtained at diagnostic or therapeutic arthrocenteses
                                                                                   controls (4). SF was obtained within 24 hours of witnessed death
of the knee from the case study and three patients with rheumatoid
                                                                                   from patients with no antemortem history of arthritis from clinical
arthritis (RA), diagnosed by ACR criteria [7]. Tissue processing for
                                                                                   examination or medical chart review. Ten cadaveric samples were
synovial fluids has been previously described [4]. Briefly, synovial fluids
                                                                                   selected as age-matched controls for SF amino acid levels. Four samples
were collected, aliquoted in preservative-free tubes and stored at -80°C
                                                                                   were selected for the control average SF TNFα level. SF WBC counts
after cell pelleting.
                                                                                   obtained at arthrocentesis from the nonarthritic cadaveric controls
Acute pseudogout samples                                                           were negligible.

    A 71-year-old female was admitted to the hospital for intravenous              High pressure liquid chromatography (HPLC)
(IV) antibiotic treatment of pneumonia. On hospital day 1, blood
                                                                                        Free amino acid (AA) determinations were obtained with a Waters
cultures grew out Streptococcus viridans and a coagulase negative
                                                                                   717 HPLC system with autosampler (Waters, Milford, MA, USA),
Staphylococcus species. The patient’s symptoms of pneumonia improved               Beckman 114M solvent delivery pumps (Beckman Fullerton, CA,
and on hospital day 7, all antibiotics were discontinued. On day 8,                USA), Bioanalytical Systems FL-45 fluorescence detector (excitation
the patient developed acute arthritis of the left knee, with increased             250 nM, emission 456: Bioanalytical Systems, West Lafayette, LA,
warmth, swelling, erythema and severe pain. Left knee arthrocentesis               USA) and Waters Millennium software. A standard HPLC protocol was
yielded SF WBC count of 54,000/mm3 with 88% polymorphonuclear                      utilized (4). Samples (100 µl) were injected into the HPLC analyzer with
leukocytes. Intravenous antibiotics were re-instituted, and the patient            the reagent solution (sodium borate, 0.01M, pH 8.95, Millipore filtered)
was therapeutically arthrocentesed daily over an additional three days             and run at 25°C.
(Days 9, 10 and 11), to cover the possibility of a septic knee. Synovial
fluid analyses yielded negative bacterial culture results for all samples          Experimental standards and quality control
but intracellular calcium pyrophosphate dihydrate (CPPD) crystals                      A detailed description of standards and quality controls have been
were detected by polarizing microscope examination on Days 9 and 11.               previously published [4]. The internal AA control was norleucine. The
The left knee arthritis demonstrated an improved clinical response to              SF samples were thawed once at the time of the assay. The 6 free AA
reinstitution of IV antibiotics and daily therapeutic arthrocentesis.              assayed and presented are neurotransmitter EAA glutamate (Glu)
    Evidence of swelling of the patient’s right knee was clinically                and aspartate (Asp), inhibitory amino acids (IAA): serine (Ser) and
evident on hospital day 10. Compared to the left knee, the right knee              glycine (Gly) and AA to serve as metabolic controls: arginine (Arg) and
                                                                                   threonine (Thr).
had minimal warmth, less swelling, no erythema and was mildly
painful. Blood and right knee SF cultures obtained were negative for                    The concentrations (µM) of AA measured by HPLC were run
bacterial organisms. On Day 10, the right knee SF had a WBC count                  in triplicate and showed less than 10% variance of free amino acid
of 4,500/mm3 and intracellular CPPD crystals were detected on                      concentrations. SF AA in this study are expressed as Patient: Cadaver
polarizing microscopic examination. On Days 10 and 11, the right                   concentration ratios to correct to concentrations found in normal, non-
knee was treated with daily arthrocentesis and continued IV antibiotic             arthritic joints [4].
treatment. The patient reported worsening pain levels in the right
                                                                                   TNFα quantification
knee and showed no clinical improvement. On Day 12, the patient
was treated for acute pseudogout with low dose oral prednisone and                     The SF TNFα levels were obtained using an immunoassay kit
had prompt resolution of the right knee arthritis. The Rheumatology                (Quantikine, R&D Systems, Minneapolis, MN). Average levels from
inpatient consult service reported the following clinical diagnoses: left          duplicate samples were expressed as the mean SF TNFα Patient:
knee, acute pseudogout and the right knee, acute pseudogout, although              Cadaver concentration ratios. These were derived from the patient SF
the patient was initially covered for the possibility of septic arthritis. At      TNFα concentrations (pg/ml) divided by the mean SF TNFα levels of 4
one year follow up there had been no recurrence of arthritis in either             normal, non-arthritic cadavers. The mean SF TNFα concentration from
knee. The clinical diagnosis and treatment are in agreement with ACR               the cadavers was 1.25 pg/ml, (range: 0-5 pg/ml).
and EULAR recommendations [7-9] and a similar clinical presentation
                                                                                   Cell counts
has been reported for acute pseudogout [10].
                                                                                       WBC counts derived from patient SF at the time of arthrocentesis
Chronic rheumatoid arthritis samples                                               were determined by the hospital laboratory in the course of the patient’s
     Synovial fluid samples from 3 female patients with RA were                    clinical care and were part of the medical record. WBC counts are
collected during active flares. The onset of RA occurred between 1-5               expressed as the cell number/mm3.
years prior to the first SF sample collection and represents a chronic             Data expression and statistical analyses
inflammatory arthritis. Two time points were collected, spanning 0.2
years in RA Patient (Pt) 1; 1.5 years in RA Pt 2 and 9 years in RA Pt 3.               As noted above, mean SF AA and TNFα values are expressed as mean
                                                                                   SF Patient: Cadaver concentration ratios. Analyses and presentation of
Acute reiter’s syndrome samples                                                    SF mediator fluctuations were performed using Statistica (Tulsa, OK)
    A patient with HIV-1 infection admitted to the hospital for                    and SigmaPlot (SPSS, Inc, Chicago, IL) software.
evaluation and treatment of acute onset of fever, severe joint pain and
polyarthritis had 4 days of bilateral arthrocenteses. The patient had a
                                                                                   Results
similar prior history of fever, severe joint pain and polyarthritis. He was            Figures 1A and 1B demonstrate mean SF EAA (Glu and Asp)
diagnosed and treated for reactive arthritis, or acute Reiter’s syndrome.          Patient: Cadaver concentration ratios for serial arthocenteses derived

Rheumatol Orthop Med, 2018       doi: 10.15761/ROM.1000161                                                                                    Volume 3(4): 2-5
McNearney TA (2018) Neurotransmitter excitatory amino acids in synovial fluids demonstrate distinct temporal fluctuations in active arthritis
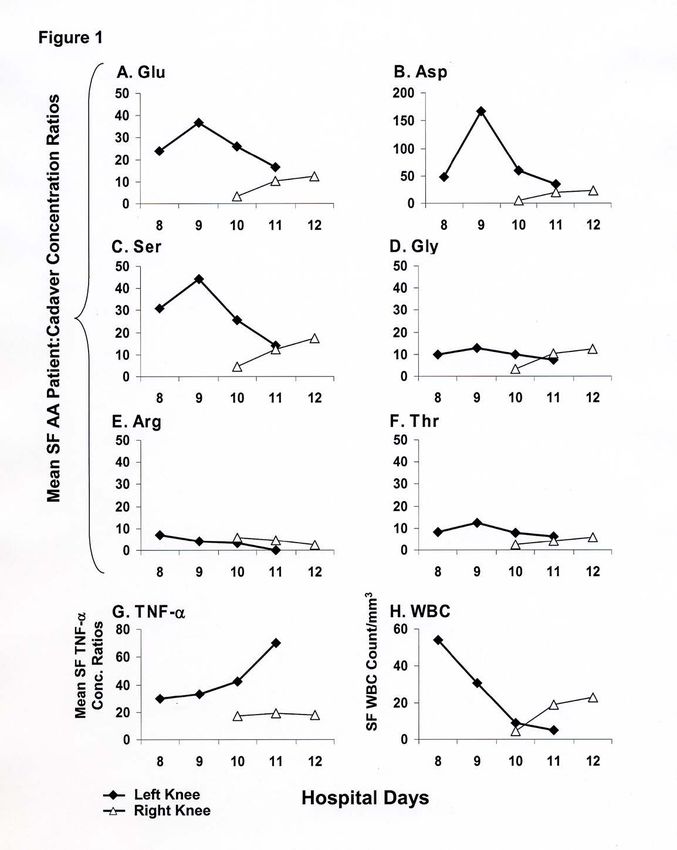
from both knees of the acute pseudogout patient, who had no previous Figure 2 illustrates the mean SF EAA (Figures 2A and 2B) IAA and
history of arthritis. During the active flares, SF EAA Glu and Asp other SF AA (Figures 2C-2F) Patient: Cadaver concentration ratios
concentration ratios and fluctuations were usually 2-3-fold greater from three patients with RA at two time points during flares of clinically
than the fluctuations of Arg and Thr, which served as metabolic AA active arthritis. There were temporal fluctuations in mean SF Patient:
controls. The mean SF EAA concentration ratios were higher in the Cadaver concentration ratios of 1.5-2-fold for Glu and 1.2-5.5-fold for
more clinically symptomatic left knee, on the two days where bilateral Asp (Figures 2A and 2B). The mean SF Ser, Gly and Thr Patient: Cadaver
arthrocenteses were performed. There were increasing and decreasing concentration ratios were much lower and more constant compared
fluctuations in mean SF EAA concentration ratios over the 3 or 4 days to the mean SF Glu and Asp concentration ratios in the patients with
of daily arthrocentesis: left knee, Days 9 vs 11, (Glu: 36.7 vs 18.6 and RA (Figures 2C and 2D). Mean SF Arg Patient: Cadaver concentration
Asp: 167 vs 17.7, respectively) and right knee, Days 10 vs 12 (Glu: 3.34 ratios fluctuated 4-fold in RA Pt 3, although SF concentration ratios of
vs 12.35 and Asp: 4.8 vs 17.3, respectively, Figures 1A and 1B). Also, RA Pts 1 and 2, with less time between SF sample collection, were lower
there were several-fold differences in mean SF EAA concentration and remained more constant between the two arthrocentesis (Figure
ratios between left and right knees from simultaneously drawn same 2E). Mean TNFa Patient: Cadaver concentration ratios fluctuated
day samples (Days 10 and 11). Mean SF Glu concentration ratios severalfold between time points and the RA patients (Figure 2G).
from left and right knees fluctuated 7.8- to 1.8- fold on Days 10 and The SF WBC counts from five time points in the 3 RA patients
11, respectively (Fig. 1A). Mean SF Asp concentration ratios between ranged from 13,000-29,375 cells/cm3, consistent with inflammatory
left and right knees fluctuated 12.29- to 1.71-fold on Days 10 and 11, synovial effusions expected from patients with active RA (Figure 2H).
respectively (Figure 1B). The fluctuations in SF WBC counts were not uniformly consistent with
In the patient with acute pseudogout, mean Patient: Cadaver the SF EAA concentration ratio fluctuations in RA Pts 1 and 3, (Figures
concentration ratios for SF Ser (Figure 1C) had similar sequential 2A, 2B and 2H) or mean SF TNFα concentration ratio fluctuations
fluctuations as those seen for SF Glu (Figure 1A). There were 2-4-fold (Figure 2G).
differences over 4 days in mean SF Ser concentration ratios in the same In comparing Figures 1 and 2, there were noted differences in SF
knee, left knee, Day 9 vs 11, (44.26 vs 14.4, respectively) and right knee, EAA and Ser concentration ratios between the RA patients and the
Day 10 vs 12 (4.65 vs 17.3, respectively). Mean SF Ser concentration patient with acute pseudogout flares. The highest SF Glu concentration
ratios from simultaneously drawn same day samples fluctuated from
5.55- to 1.15-fold on Days 10 and 11, respectively (Figure 1C).
The mean Gly, Arg and Thr Patient: Cadaver concentration ratios
demonstrated more modest fluctuations in both knees, (Figures 1D-
1F). There were 1.5-3.6-fold differences over 4 days in mean SF Gly
concentration ratios in the same knee, left knee, days 9 vs 11, (12.3
vs 7.31, respectively) and right knee, Days 10 vs 12 (4.5 vs 13.3),
respectively, Figure 1D). The mean Patient: Cadaver concentration
ratios for SF Arg ranged between 0.03-13.01 in the left knee and 2.51-
5.74 in the right knee (Figure 1E). The mean SF Thr Patient: Cadaver
concentration ratios ranged between 6.14-12.6 in the left knee and 2.44-
5.76 in the right knee (Figure 1F).
Mean SF TNFα Patient: Cadaver concentration ratios were also
obtained. The mean SF TNFα Patient: Cadaver concentration ratios
were 1.8-3.7-fold higher in the left knee compared to the right (29.4-
70 vs 12.1-13.6, respectively Figure 1G). The highest mean SF TNFα
concentration ratio was noted on Day 11 in the left knee, two days
after the peak SF EAA concentration ratios seen on Day 9. In the right
knee, the lower mean SF TNFα Patient: Cadaver concentration ratios
did not demonstrate a fluctuating pattern over the three days of serial
arthrocentesis.
The left knee SF WBC counts were 54,000/mm3, 30,600/mm3,
9,000/mm3 and 5,000/mm3 on Days 8, 9, 10 and 11, respectively. The
lowest SF WBC value in the left knee was seen on Day 11, (5000/
mm3), four days after parenteral antibiotics were reinstituted and
after serial therapeutic arthocenteses. The SF WBC counts from right
knee SF samples increased over Days 10, 11 and 12 (4,500/mm3,
19,000/mm3 and 23,000/mm3, respectively, Figure 1H). After low dose
corticosteroids were administered on Day 12, the right knee arthritis
Figure 1. SF EAA and TNFα demonstrate distinct and staggered temporal fluctuations
resolved. In the right knee, similar fluctuations and increasing levels in acute arthritis. Mean SF EAA, other amino acids (AA’s), TNFα Patient: Cadaver
were seen in SF Glu, Asp, Ser levels and WBC counts over Days 10-12. concentration ratios and white blood cell (WBC) counts were obtained sequentially from
The fluctuations in SF WBC counts were not uniformly consistent with a patient with acute pseudogout over 3-4 days from both knees. A: glutamate (Glu); B.
aspartate (Asp); C: serine (Ser); D: glycine (Gly); E. Arginine (Arg); F. Threonine (Thr).
the SF EAA concentration ratio fluctuations (Figs. 1A and 1B) or mean Mean SF TNFα Patient: Cadaver concentration ratios (G) and SF WBC counts (x103/cm3,
SF TNFα concentration ratio fluctuations (Figure 1G). H) were also obtained
Rheumatol Orthop Med, 2018 doi: 10.15761/ROM.1000161 Volume 3(4): 3-5McNearney TA (2018) Neurotransmitter excitatory amino acids in synovial fluids demonstrate distinct temporal fluctuations in active arthritis
very unusual presentation of acute de novo onsets and two distinctly
evolving arthritic courses. SF samples were also collected over different
time spans and diagnoses from patients with chronic RA and acute
Reiter’s arthritis to compare fluctuation patterns of SF EAA and TNFα
levels in other acute and chronic inflammatory arthritis. The acute
pseudogout and RA patients demonstrated independent, temporally
and clinically distinct arthritis courses which were reflected in the
different fluctuation level patterns of SF EAA.
The highest SF Glu and Asp concentration ratios in the patients
with chronic RA were greater than those noted in the acute pseudogout
patient. The other SF amino acid levels were sustained at comparatively
much more modest and consistent elevations, possibly reflecting
compensatory mechanisms, or equilibration to a new metabolic baseline
in the chronic setting. These data are in agreement with a previous
report demonstrating higher mean SF Patient: Cadaver concentration
ratios from RA Patients than those of other SF AA or compared to SF
EAA values from patients with acute pseudogout [4]. The mean SF
TNFα concentration ratios obtained over time from the RA patients
were generally several-fold higher than those of the acute pseudogout
patient. Underlying, compensatory or progressive mechanisms of
injury, structural damage, comorbid conditions, or medications
may be contributing to the cytokine levels in chronic inflammatory
arthropathies. The disease course and SF EAA concentration ratios
from the patient with acute Reiter’s polyarthritis further supported the
observation that SF EAA concentration ratios and clinical courses reflect
the microenvironment and local processes of the involved joint, which
may be dependent or independent of systemic influences. Fluctuating
EAA levels between body compartments of plasma and synovial fluid
in the same patient in a variety of arthropathies has been previously
reported [11]. Patients with Reiter’s or psoriatic arthritis flares have
Figure 2. Mean SF EAA, IAA, other AA and TNFα Patient: Cadaver concentration ratios demonstrated the highest SF Glu and Asp concentration ratios [4], a
of 3 RA patients at two independent time points during symptomatic flares were obtained. finding which is generally consistent in this report. In a previous cross-
A-H: Noted as in Figure 1. A: glutamate (Glu); B. aspartate (Asp); C: serine (Ser); D:
glycine (Gly); E. Arginine (Arg); F. Threonine (Thr). The data are presented as mean SF sectional study, elevated SF Glu and Asp levels in patients with RA,
ratios for the ipsilateral knee of each patient over two arthrocenteses, with differing time acute gout and OA correlated with elevated SF levels of RANTES, MIP-
spans: Pt 1: 0.2 yrs, Pt 2: 1.5 yrs and Pt 3: 9 years 1α, and IL-8. SF EAA levels did not directly correlate with SF TNFα
levels [12], as was also reported here.
ratios were 2-fold higher in the RA patients compared to the highest
value noted in the pseudogout patient (left knee, Day 9). The highest SF Addition of Glu to primary human synovial cultures derived from
Asp concentration ratio was twice as high in the pseudogout patient (left RA and acute gout patients results in significantly increased levels of SF
knee, Day 9) as the highest ratios noted in the RA patients. Similarly, TNFα in the culture supernatants [12]. In the present study, the increase
the highest SF Ser concentration ratio in the pseudogout patient was in SF Glu levels preceded SF TNFα elevations in serial collections
2-fold greater than the highest Ser ratio values noted in the RA samples. from the patient with acute pseudogout (Figure 1). Activation of Glu
The ranges of mean SF TNFα Patient: Cadaver concentration ratios, receptors on human cultured clonal human synoviocytes resulted
(range: 16.4–250, Figure 2G) were higher in the RA patients, compared in significantly increased culture supernatant levels of RANTES
to those samples derived from the patient with acute pseudogout (regulated on activation, normal T cell expressed and secreted [13],
(range 29.4-70, Figure 1G). The mean SF TNFα concentration ratio IL-8, [14] and IL-6 [15]. Studies with experimental arthritis models
fluctuations between the two time points in the RA patients were not have demonstrated improved joint inflammatory parameters and
uniformly consistent with the SF EAA concentration ratio fluctuations nociceptive behaviours with Glu receptor antagonist treatments
or SF WBC counts. applied at several specific central and peripheral sites [2,3,16,17]. Taken
The patient with HIV-1 infection had continued fever, polyarthritis together, these studies support direct and indirect consequences of SF
and severe joint pain. Arthrocenteses were performed on both knees and EAA in the human arthritic process that may be independent of some
left ankle. The patient was diagnosed and treated for reactive arthritis, inflammatory mediators.
or acute Reiter’s syndrome and had an earlier episode of fever and The major limitations of this study are the small number of subjects
polyarthritis. Assessment for SF EAA Patient: Cadaver concentration and SF samples that were available with clinical presentations. Also,
ratios indicated more consistent ratios, within 2-fold among knees and there were clinical descriptions of the active arthritis, but no formal
ankle joints over a 4 day period, (SF Glu ratio range=20-25; SF Asp ratio measurements other than mild to severe pain levels reported at physical
range=13-18). exam and mediator levels derived from the SF samples. Additional
studies in human and experimental models will be needed to confirm
Discussion temporal fluctuations of SF EAA and other mediator levels and their
This descriptive study was the result of the opportunity to obtain relevance in human arthritis and clinical disease activity. The patient
daily serial SF samples in a patient with acute pseudogout, having a with acute pseudogout presented with two distinct clinical courses and
Rheumatol Orthop Med, 2018 doi: 10.15761/ROM.1000161 Volume 3(4): 4-5McNearney TA (2018) Neurotransmitter excitatory amino acids in synovial fluids demonstrate distinct temporal fluctuations in active arthritis
of interest, different responses to treatment and resolution. Current 4. McNearney T, Speegle D, Lawand N, Lisse J, Westlund KN (2000) Excitatory amino
acid profiles of synovial fluid from patients with arthritis. J Rheumatol 27: 739-745.
animal models have provided evidence of fluctuating SF mediators, [Crossref]
over short time courses [16-18]. It might be desirable to study and
5. Lawand NB, Reddig WJ, Cashin AE, Westlund KN, Willis WD (2004) NMDA
compare SF EAA levels and receptor activation in distinct arthritic
receptors and associated signaling pathways: a role in knee joint blood flow regulation.
processes from two unrelated experimental arthropathy models at the Eur J Pharmacol 499: 155-161. [Crossref]
same time, e.g. septic joint and meniscal tear in the context of joint
6. Carlton SM, McNearney T, Cairns BE (2003) The role of glutamate receptors in the
measurements, behavioural parameters, inflammatory cytokines and periphery. Proceedings of the 10th World Conference on Pain 24: 125-139.
localized responses to treatment.
7. Primer on the Rheumatic Diseases (2001) In: John H Klippel (Ed) Arthritis Foundation,
Atlanta, GA p. 353.
Conclusion
8. Zhang W, Doherty M, Bardin T, Barskova V, Guerne PA, et al. (2011) European league
This study presented very unique human arthritis courses and against rheumatism recommendations for calcium pyrophosphate deposition. Part I:
provided additional support that the joint microenvironment and terminology and diagnosis. Ann Rheum Dis 70: 563-570.
inflammatory profile can be independent of other joints in the same 9. Zhang W, Doherty M, Pascual E, Barskova V, Guerne PA, et al. (2011) EULAR
patient. This also added to a body of literature that addresses glutamate recommendations for calcium pyrophosphate deposition. Part II: management. Ann
Rheum Dis 70: 571-575.
and other mediators in supportive soft tissues of the joint [19]. A
formal correlation of temporal fluctuations of SF mediators and clinical 10. Brennan KE, McGrory BJ (2011) Monoarticular pseudogout of the hip: a case report.
Hosp Pract (1995) 39: 74-77. [Crossref]
parameters in arthritis would provide insight into development of
novel therapeutic regimens that could more effectively treat pain and 11. McNearney TA, Westlund KN (2013) Excitatory amino acids display compartmental
inflammation and possibly blunt arthritis progression. This might be disparity between plasma and synovial fluid in clinical arthropathies. Int J Clin Exp
Pathol 6: 492-497.
especially relevant in the acute setting.
12. McNearney T, Baethge BA, Cao S, Alam R, Lisse JR, et al. (2004) Excitatory amino
Acknowledgments acids, TNF-alpha, and chemokine levels in synovial fluids of patients with active
arthropathies. Clin Exp Immunol 137: 621-627.
The authors wish to thank Dr. David McAdoo, Director of the 13. McNearney TA, Ma Y, Chen Y, Taglialatela G, Yin H, et al. (2010) A peripheral
Protein Chemistry Laboratory for laboratory support and Pat Gazzoli neuroimmune link: glutamate agonists upregulate NMDA NR1 receptor mRNA and
for assistance in preparation of the figures. protein, vimentin, TNF-alpha, and RANTES in cultured human synoviocytes. Am J
Physiol Regul Integr Comp Physiol 298: R584-598. [Crossref]
Grant support 14. Liu L, Xue Y, Zhu Y, Xuan D, Yang X, et al. (2016) Interleukin 37 limits monosodium
urate crystal-induced innate immune responses in human and murine models of gout.
This work was supported by NIH NS 32778: Central Control of Arthritis Res Ther 18: 268.
Pain and Arthritis (KNW, TAM), NIH NS 32118, Molecular Basis
15. Flood S, Parri R, Williams A, Duance V, Mason D (2007) Modulation of interleukin-6
of Glutamate Receptor Activation, (KNW, TAM), Charles A. Dana and matrix metalloproteinase 2 expression in human fibroblast-like synoviocytes by
Foundation, Clinical Hypotheses in Neuroimmunology, (TAM, KNW), functional ionotropic glutamate receptors. Arthritis Rheum 56: 2523-2534.
and start-up dollars at the University of New Mexico. 16. Ren K, Williams GM, Hylden JLK, Ruda MA, Dubner R (1992) The intrathecal
administration of excitatory amino-acid receptor antagonists selectively attenuated
References carrageenan-induced behavioral hyperalgesia. Eur J Pharmacol 219: 235-243.
1. Sluka KA, Westlund-High KN (2009) Neurologic Regulation of Inflammation. In: 17. Sluka KA, Westlund KN (1993) Centrally administered non-NMDA but not NMDA
Kelley’s Textbook of Rheumatology (8th Edn) Firestein GS, Budd RC, Harris Jr ED, receptor antagonists block peripheral knee joint inflammation. Pain 55: 217-225.
McInnes IB, Ruddy S (Eds) Saunders Elsevier, Philadelphia, PA.
18. Szekanecz Z, Halloran MM, Volin MV, Woods JM, Strieter RM, et al. (2000) Temporal
2. Lawand NB, Willis WD, Westlund KN (1997) Excitatory amino acid receptor expression of inflammatory cytokines and chemokines in rat adjuvant-induced arthritis.
involvement in peripheral nociceptive transmission in rats. Eur J Pharmacol 324: 169- Arthritis Rheum 43: 1266-1277.
177.
19. Alfredson H, Lorentzon R (2003) Intratendinous glutamate levels and eccentric training
3. Lawand NB, McNearney T, Westlund KN (2000) Amino acid release into the knee in chronic Achilles tendinosis: a prospective study using microdialysis technique. Knee
joint: key role in nociception and inflammation. Pain 86: 69-74. [Crossref] Surg Sports Traumatol Arthrosc 11: 196-199.
Copyright: ©2018 McNearney TA. This is an open-access article distributed under the terms of the Creative Commons Attribution License, which permits
unrestricted use, distribution, and reproduction in any medium, provided the original author and source are credited.
Rheumatol Orthop Med, 2018 doi: 10.15761/ROM.1000161 Volume 3(4): 5-5You can also read