Milk Components: Understanding the Causes and Importance of Milk Fat and Protein Variation in Your Dairy Herd
←
→
Page content transcription
If your browser does not render page correctly, please read the page content below
Milk Components:
           Understanding the
       Causes and Importance of
          Milk Fat and Protein
      Variation in Your Dairy Herd

    Jud Heinrichs, Coleen Jones, and Ken Bailey1
1
    Department of Agricultural Economics and Rural Sociology

                                   Department of Dairy and Animal Science
                 DAIRY&            The Pennsylvania State University
                 ANIMAL            324 Henning Building
                                   University Park, PA 16802
                 SCIENCE           (814) 865-5491 • FAX (814) 865-7442
                                   www.das.psu.edu/

                                   Topics include:
                            Average components by breed
                       Components in the Mideast federal order
                          Factors affecting component levels
                  Nutritional strategies to modify milk fat and protein

DAS 05-97                                                                   IVE-1e
INTRODUCTION
Most milk marketing orders in the US Table 1. Average fat and protein content of
now employ a multiple component pricing milk produced by different breeds.
system that pays producers on the basis of Breed % Fat % Protein F:P1
milk fat, true protein, and other dairy solids.
Ayrshire 3.86 3.18 1.21
This new pricing method derives component
Brown Swiss 4.04 3.38 1.20
values from prices for manufactured dairy
Guernsey 4.51 3.37 1.34
products (cheese, butter, nonfat dry milk,
Holstein 3.65 3.06 1.19
and dry whey), which rise and fall with
Jersey 4.60 3.59 1.28
changing market conditions. As a result,
Source: USDA-AIPL summary of herds on DHI
milk component levels have taken on new test during 2004.
importance in herd management. In addition 1
Ratio of fat to protein.
to being indicators of cow health and
nutrition, component levels now directly average for their market and their breed.
impact farm income. This factsheet will This presents an opportunity to improve
describe the variation found in production of component production and income from
milk components, factors that contribute to milk sales.
this variation, and strategies to improve As an example, Table 2 presents some
component production. comparisons of the value of milk sold as the
Generally, fat and protein content of component levels change. If a Holstein herd
milk are positively correlated within a currently produces milk with 3.5% fat and
population of dairy cattle; however, different 2.9% protein, that herd is below the breed
breeds of cattle vary in average component average for components. In addition, if that
levels (Table 1). Holsteins have the lowest herd ships milk in the Mideast federal order,
fat and protein content, while Jersey and it is also below the market average for
Guernsey breeds have the highest. Because component levels. Increasing fat and protein
Holsteins produce more milk, they generally to breed average would increase the value of
have a higher total yield of fat and protein milk sold by 58 cents per hundredweight.
than other breeds. Increasing to market average would gain the
Production of milk fat and protein can herd 72 cents per hundredweight. If the herd
vary tremendously from one herd to another. could increase component percentages by
A recent summary of milk shipped in the 0.32 for fat and 0.19 for protein, an extra 90
Mideast federal order from 2000 through cents per hundredweight would be generated
2002 showed that herd average milk protein (these values are the standard deviations
ranged from 1.57% to 4.66%, with an reported in Figure 1).
average of 3.05%. Milk fat ranged from Increases of this magnitude are possible
1.77% to 5.98%, with an average of 3.76%. with changes in nutrition and management.
These data represent real herds and What’s more, if nutritional changes are
actual production. While these data do not implemented it is very likely that milk
provide any information about breed, the production will increase along with
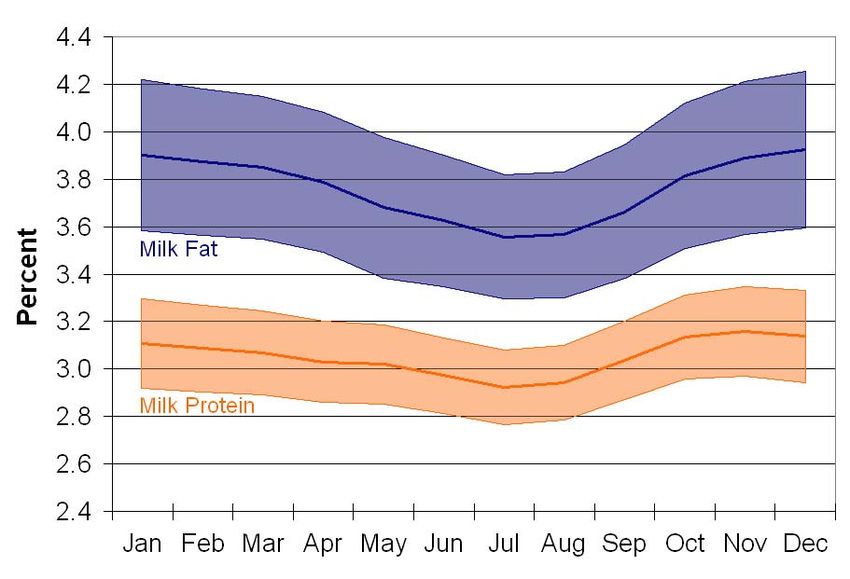
range in herd performance is huge. Figure 1 component levels, which would add even
shows information from the same study, but more income. We have developed a simple
presents the range that includes 68% of the spreadsheet to help you calculate the gross
population. Even when the extremes are milk price for various component levels. It is
eliminated, this study indicates that many available at www.das.psu.edu/dairynutrition.
herds are producing components below
DAS 05-97 Milk Components: Understanding Causes and Importance of Variation 2Figure 1. Level of fat and protein varies across herds and seasonally. Ranges represent one
standard deviation above and below the average. The solid line in the center of each range
indicates the average for that month. For the three years studied, milk fat% averaged 3.76 ±
0.32 (blue), and milk protein% averaged 3.05 ± 0.19 (orange). (Bailey et al., 2005).
Table 2. Comparison of gross milk price at various levels of fat and protein production.1
Fat Protein Gross Price Difference2
% % $/cwt $/cwt
Current test 3.50 2.90 13.41 0.00
Holstein average 3.65 3.06 13.99 -0.58
Mideast average3 3.76 3.05 14.13 -0.72
Increase by 0.5 SD3 3.66 2.98 13.83 -0.42
Increase by 1 SD3 3.82 3.09 14.31 -0.90
1
Assumptions: herd SCC of 150,000 and 5.65% other solids for each case. Component prices
assumed are averages from Jan. 2000 to June 2005 for the Mideast federal order: fat $1.5256/lb,
protein $2.1700/lb, other solids $0.0691/lb, SCC adjustment rate $0.00068. Producer price
differential for each case is $1.25/cwt, an average received since 2000 for milk shipped to
processing plants located in western Pennsylvania.
2
Current gross price minus the gross price for each scenario.
3
Data from summary of milk shipped in the Mideast federal order from 2000 through 2002 (Bailey et
al. 2005). One standard deviation (SD) is 0.32% for fat and 0.19% for protein.
DAS 05-97 Milk Components: Understanding Causes and Importance of Variation 3FACTORS AFFECTING MILK COMPOSITION
There are many factors that can affect value is reduced, plus in some federal orders
milk fat and protein, and many of them can there is a deduction for SCC over 350,000.
be manipulated to enable you to achieve Quality premiums from the milk handler
higher than average levels of milk may be lost as well.
components. Keep in mind that herds that Milk fat and protein depression also can
are below breed average will have more occur from mechanical errors, such as
opportunity to improve component levels. cooling problems in the bulk tank, sampling
Herds that are already above average may problems, and over agitation in the pipeline.
have better success by focusing on Genetics and inheritance account for
increasing milk yield, which will increase 55% of the difference between cows in
the total amount of fat and protein produced. protein and fat content of milk. Table 3
provides heritability estimates for milk and
Factors Other Than Nutrition
its components. Heritability indicates the
Stage of lactation affects milk protein proportion of observed differences that are
and fat percentages very similarly. The due to genetics, while the reciprocal is
highest amount of protein and fat in milk is assumed to be due to environmental factors.
found just after freshening, in colostrum. Protein and fat percentages are more highly
Levels drop to their lowest point between 25 heritable than yield of milk and components.
and 50 days after calving and peak at 250 Milk yield is positively correlated to yield of
days as milk production begins to decrease. fat and protein; however, milk yield is
Age tends to cause both milk fat and negatively correlated to fat and protein
protein to decline as the animal becomes percent. For many years, sires have been
older. Milk fat falls about 0.2% each year selected for high yields of milk, which has
from the first to fifth lactation likely as a resulted in very slow increases in fat and
result of higher production and more udder protein percentages over time. Herds that are
infections. Protein decreases 0.02 to 0.05% more than one standard deviation below the
each lactation as animals age. breed average for fat or protein may benefit
Season dramatically affects milk fat and from including component yields in sire
protein (refer to Figure 1). The hot, humid selection criteria. However, because fat and
months (July and August in the NE) depress protein percentages are negatively related to
fat and protein content. There is a gradual milk yield, changes in herd component
increase of protein and fat in milk through percentages are not likely to be achieved
the fall and peak levels occur in the colder through genetic selection alone.
months of winter. As temperatures increase
through the spring, component levels are Table 3. Heritability (h2) estimates for milk
gradually decreased. These changes may be and its components.
indicative of feed intake patterns, which are Holstein Jersey
lower in summer due to changes in weather Trait h2 SD1 h2 SD1
and temperature. Fat, % 0.58 0.23 0.55 0.28
Mastitis infections reduce fat and casein Protein, % 0.51 0.14 0.55 0.20
but increase blood protein content of milk. Fat, lb 0.30 52 0.35 50
Somatic cell count (SCC) also is elevated Protein, lb 0.30 37 0.35 36
during mastitis. Herds that have continuous Milk, lb 0.30 1444 0.35 1204
1
mastitis and SCC problems take a double or Estimate of genetic standard deviation.
Source: USDA-AIPL yield traits definition (May
triple hit on milk price. The component 2005) and trend estimates for cows born in 2000.
DAS 05-97 Milk Components: Understanding Causes and Importance of Variation 4Nutritional Factors and Feeding breakdown amino acids and convert them to
Practices glucose (a process called gluconeogenesis);
this can reduce the supply of amino acids
Of all the factors affecting milk
available to make milk protein. In addition,
composition, nutrition and feeding practices
some albumin and immunoglobulin protein
are most likely to cause problems; however,
is transferred directly to milk from the
management changes made here are able to
blood.
quickly and dramatically alter production of
Rumen Function. The relative amounts
fat and protein. Milk fat depression can be
of protein and energy that are available in
alleviated within seven to 21 days by
the rumen at a given time is the major factor
changing the diet. Milk protein changes may
affecting rumen fermentation and therefore
take 3 to 6 weeks or longer if the problem
milk components. Any diet or management
has been going on for a prolonged period.
factors that affect rumen fermentation can
Nutrition or ration formulation changes are
change milk fat and protein levels.
more strongly correlated to milk fat content
Consistently providing adequate energy and
than milk protein. Milk fat can be changed
protein and balanced amounts of rapidly
by 0.1 to 1.0 percentage points, while
fermentable carbohydrate and effective fiber
protein is seldom altered more than 0.1 to
are keys to maintaining optimum levels of
0.4 points by nutritional changes. For these
milk components. The challenge in feeding
reasons, nutrition and feeding management
for milk components is that high energy, low
are considered the best solutions to a milk
fiber diets that increase milk protein are
fat or protein problem other than genetics.
likely to reduce fat levels. This may also be
Source of Milk Components. Digestion
the case in some diets with rumen modifiers,
of fiber in the rumen produces the volatile
such as Rumensin®; however, this product
fatty acids (VFAs) acetate and butyrate.
has other ways to affect the rumen that do
Butyrate provides energy for the rumen
not necessarily alter milk components.
wall, and much of it is converted to beta-
Feeding Management. Any situation
hydroxybutyrate in the rumen wall tissue.
that causes cows to eat abnormally or limits
About half of the fat in milk is synthesized
feed intake may affect milk components.
in the udder from acetate and beta-
Examples include: overcrowding at feed
hydroxybutyrate. The other half of milk fat
bunks, housing heifers with older cows in
is transported from the pool of fatty acids
facilities at or near full capacity, feeding
circulating in the blood. These can originate
rations that encourage sorting, feeding
from body fat mobilization, absorption from
infrequently in a conventional system (non-
the diet, or from fats metabolized in the
TMR), failing to push feed up or feed TMR
liver.
often enough, feeding protein feeds before
Rumen microbes convert dietary protein
energy feeds and feeding grain before forage
into microbial protein, which is a primary
in non-TMR systems. These conditions can
source of essential amino acids for the cow.
create slug feeding (one or two meals per
These amino acids are used by the
day versus 10 to 15) or allow cows to eat
mammary gland to synthesize milk proteins.
high grain meals part of the time and high
Glucose is required to provide energy to
forage meals the remainder of the day.
support this protein synthesis. Glucose is
Ensure that fresh feed is available 20 hours
either formed from the VFA propionate in
each day, spoiled feed is removed from
the liver, or absorbed directly from the small
bunks, and shade or cooling is provided
intestine. If too little propionate is absorbed
during hot weather to help maintain normal
from the rumen, the cow will have to
DAS 05-97 Milk Components: Understanding Causes and Importance of Variation 5intake and normal meal patterns. Poor concentrate, may reduce milk fat content
ventilation or cow comfort also can depress and increase milk protein. Normal protein
milk fat and protein production by reducing levels can be expected when energy needs
intake. Finally, make ration changes are being met for most of the cows. Often
gradually to allow rumen microorganisms this is impossible to achieve with high
time to adapt. Any reduction in rumen producing animals.
microbial protein production from nutrition Protein Effects. A deficiency of crude
or feeding management imbalances will protein in the ration may depress protein in
reduce milk protein by way of less microbial milk; marginal deficiency could result in a
protein for the cow to digest and depress fat reduction of 0.0 to 0.2%, while more severe
by limiting VFA production in the rumen. restriction of diet crude protein would have
Body Condition. Proper body condition greater impact. However, feeding excessive
is essential so that high producing cows can dietary protein does not increase milk
draw on body stores of nutrients to support protein, as most of the excess is excreted.
milk production. If body stores are minimal, Dietary protein has little effect on milk fat
yields of milk and milk components will levels within normal ranges.
suffer. On the other hand, excessive body Diet protein type also could affect milk
condition increases the risk of metabolic protein levels. Use of non-protein nitrogen
problems and calving difficulty. Weight loss (NPN) compounds, like urea, as protein
in early lactation can increase milk fat substitutes will reduce protein in milk by 0.1
content for a short period of time. Both thin to 0.3% if the NPN is a main provider of
and fat cows tend to have low milk fat in crude protein equivalent. Rations higher
later lactation. Protein can be depressed at than recommended in soluble protein may
calving if animals are overly obese or lower milk protein by 0.1 to 0.2 points. NPN
underweight. In addition, some research levels in milk will be increased by excessive
shows that underfeeding protein during the protein or NPN intake, heavy feeding of
last three weeks before calving can depress ensiled forages, ensiled grains, immature
milk protein. pasture and lack of rumen undegradable
Energy Effects. In general, as energy protein in the diet. Balance rations for crude
intake or ration energy density increase protein, rumen undegradable protein, rumen
and/or fiber decreases, milk fat content will degradable protein, and soluble protein. For
be reduced, while protein is increased. In high producing cows, balancing for amino
contrast, as ration fiber levels increase acids also may be required.
and/or energy is reduced, milk protein is Concentrate Intake. An increase in the
depressed and milk fat is increased. Lack of intake of concentrates causes a decrease in
energy intake or lower ration digestibility fiber digestion and acetic acid production.
may reduce milk protein by 0.1 to 0.4%. This creates an increase of propionic acid
This reduction may result from underfeeding production. Propionic acid production
concentrates, low forage intake, poor quality encourages a fattening metabolism that is in
forage, failure to balance the ration for opposition to milk fat. Addition of buffers to
protein and minerals, or inadequately ground some rations may help to prevent acidosis;
or prepared grains. Shifting rumen this will not change milk protein, but will
fermentation so that more propionic acid is increase milk fat content. Animals that eat a
produced is apt to increase milk protein and substantial amount of concentrates or a low
decrease fat content. However, excessive ratio of dietary forage to concentrate may
energy intake, such as overfeeding
DAS 05-97 Milk Components: Understanding Causes and Importance of Variation 6develop acidosis even when buffers are laminitis; they do not promote good health
added to the ration. for the rumen or the cow in the long run.
The nonfiber carbohydrate (NFC) Protein and fat content also can be
portion of the diet is highly digestible and changed due to the physical form of forage
can influence both fat and protein in milk. being fed. Much of this is related to ration
Excessive amounts of NFC can depress fiber sorting and failure to provide a consistent
digestibility, which reduces the production diet throughout the day. Coarsely chopped
of acetate and leads to low milk fat (1% or silage and dry hay are the most common
more reduction). At the same time, greater causes of sorting. At the other extreme, very
propionate production allows higher milk finely ground diets negatively affect rumen
protein levels of 0.2 to 0.3%. Generally an metabolism and depress fat and protein
NFC of 32 to 38% of ration dry matter is production. Monitor ration particle size to
recommended to optimize production of ensure that adequate effective fiber is
milk fat and protein. provided, TMRs are mixed properly, rations
Forage Level and Physical Form. are distributed evenly to all cows, and
Balance rations for lactating cows to contain sorting is minimal.
at least 40 to 45% of ration dry matter from Added Fat or Oil. Adding fat to the
forage. This may be altered by the level of ration can affect milk component levels
corn silage in the ration and the level of depending on the amount and source of fat.
high-fiber by-product feeds in the ration. Fat is generally toxic to rumen microbes and
Low forage intake can cause a major may reduce fiber digestibility when fat from
reduction in the fat content of milk due to natural sources exceeds 5% of ration dry
low fiber levels. Several potential reasons matter. If rumen inert or bypass fat is used,
for low forage intake are inadequate forage total fat content may safely reach 6 to 7%.
feeding, poor quality forage, and low neutral At low levels of dietary fat, milk fat content
detergent fiber (NDF) content in forage that could increase slightly or show no change at
was cut too young or late in the fall. Target a all. Milk fat is reduced at higher levels,
forage NDF intake of 0.9% of bodyweight especially with polyunsaturated oils. If fat or
daily. Although low forage (high energy) oil is rancid, milk fat content decreases even
diets increase milk protein production, this at low levels of consumption. Milk protein
strategy is not recommended. The low content may be decreased by 0.1 to 0.3% in
forage levels contribute to acidosis and high-fat diets. This may occur due to
reduced blood glucose levels.
EXTREMELY HIGH MILK FAT
High milk fat content often occurs in income would be better served to increase
herds that are off in feed and may have total milk yield and keep fat percentage
ketosis problems. Percent fat may be somewhat below the attainable maximum.
reduced for sick animals, but total fat may Herds with unusually high milk fat are
be higher for the herd. This may occur in encouraged to reduce forage intake if it is on
herds fed large amounts of good quality the high side, increase concentrate feeding,
forage combined with moderate concentrate and manage the nutrition of dry and
levels. Producing an abnormally high level transition cows more closely to control
of fat is not economically feasible, because problems with low intakes and ketosis.
it usually indicates that total milk production
is low. Herds that depend primarily on milk
DAS 05-97 Milk Components: Understanding Causes and Importance of Variation 7MAINTAINING COMPONENT LEVELS
Recommendations for normal fat and Monitor milk component percentages
protein content can be achieved by feeding a from your milk handler or DHI records by
balanced ration that meets the chemical and month. Over time this will allow you to
physical needs of the cow. Key management develop a normal range. If components
practices to accomplish this goal include: suddenly drop out of their normal range,
regular forage tests for energy, minerals and investigate and find the cause. Paying close
protein; regular tests of TMR and attention to component levels may also
concentrates to see if they meet herd allow you to make nutritional changes in
requirements; evaluation of forage and TMR response to market conditions. Any
particle size; use of production records to decisions of this kind should be analyzed to
track component yields; and use of body determine the additional cost compared to
condition scoring to evaluate the success of the additional revenue.
nutritional programs.
Reference
Bailey, K. E., C. M. Jones, and A. J. Heinrichs. 2005. Economic returns to Holstein and Jersey
herds under multiple component pricing. J. Dairy Sci. 88:2269-2280.
For additional information, see the Dairy and Animal Science fact sheet “Trouble-shooting
Problems with Milkfat Depression” (DAS 99-2) by V. A. Ishler and R. S. Adams. Available at
http://www.das.psu.edu/dairynutrition/documents/lowmilkfat.pdf.
Visit Penn State's College of Agricultural Sciences on the Web: http://www.cas.psu.edu/
Penn State College of Agricultural Sciences research, extension, and resident education programs are funded in part
by Pennsylvania counties, the Commonwealth of Pennsylvania, and the U.S. Department of Agriculture.
Where trade names appear, no discrimination is intended, and no endorsement by Penn State Cooperative Extension
is implied.
This publication is available in alternative media on request.
The Pennsylvania State University is committed to the policy that all persons shall have equal access to programs,
facilities, admission, and employment without regard to personal characteristics not related to ability, performance, or
qualifications as determined by University policy or by state or federal authorities. It is the policy of the University to
maintain an academic and work environment free of discrimination, including harassment. The Pennsylvania State
University prohibits discrimination and harassment against any person because of age, ancestry, color, disability or
handicap, national origin, race, religious creed, sex, sexual orientation, or veteran status. Discrimination or
harassment against faculty, staff, or students will not be tolerated at The Pennsylvania State University. Direct all
inquiries regarding the nondiscrimination policy to the Affirmative Action Director, The Pennsylvania State University,
328 Boucke Building, University Park, PA 16802-5901, Tel 814-865-4700/V, 814-863-1150/TTY.
DAS 05-97 Milk Components: Understanding Causes and Importance of Variation 8You can also read