JCP Investment Partners - The Aluminium Market Outlook
←
→
Page content transcription
If your browser does not render page correctly, please read the page content below
JCP Investment Partners - The Aluminium Market Outlook

Aluminium - more of a material than a metal.... 				                                                                         August 2012

The outlook for the global aluminium market is tough, with              costs and, most importantly, access to cheap power. Recently
aluminium supply exceeding demand and low barriers to entry.            built Middle Eastern aluminium smelters importing alumina have
                                                                        the best technology and access to cheap energy.
Aluminium demand growth (ex-China) is low at global GDP
minus 1% to 2%. Non-Chinese demand can be met by the                    Chinese production – import relatively cheap low quality bauxite
annual 2% to 3% increase in supply due to capacity creep. The           from Indonesia or transform relatively impure domestic bauxite
world aluminium market could have no new capacity built over            into alumina. Alumina refineries tended to be on the coast, but
the next four years and still be in balance – yet new aluminium         this is changing given the shift west of aluminium smelters to
capacity continues to be added. New capacity utilising best             take advantage of cheap power. Chinese aluminium plants tend
technology, often cheap capital and stranded energy will push           to be smaller using replicated technology. Despite on average
down the global cost curve.                                             being a smaller size, Chinese plants tend to be efficient and new
                                                                        by global standards. Innovation is driven by the fact that new
China will meet their aluminium demand with Chinese supply. The
                                                                        capacity has been brought on line in many small increments so
move west by China’s aluminium industry, plus the flexible and
                                                                        new designs can be readily changed and tinkered with to gain
innovative nature of production (a Chinese trader not a Western
                                                                        marginal improvement. Chinese feedstock of bauxite tends to be
miner mentality) will continue to keep a lid on Chinese costs of
                                                                        lower and variable in quality. Therefore Chinese alumina plants
aluminium production. Expensive Chinese coastal aluminium
                                                                        have had to be more adaptable and flexible than their Western
capacity, relying on imported bauxite, will close.
                                                                        counterparts. China also enjoys far lower capital costs than
As a result of these factors we anticipate aluminium prices will        Western alumina refineries and aluminium smelters.
be relatively stable tending to hug the 75% to 85% percentile of
                                                                        The real price of aluminium has been falling for 40 years
the global cost curve. China’s relatively low capital cost allows
Chinese producers to operate much closer to the aluminium cost          Low barriers to entry and the recent rise of new low-capex based
curve for a larger percentage of time.                                  Chinese production has kept aluminium prices relatively low.
                                                                        The real price of aluminium has been declining since the 1970s
History and multiple proprietary contacts point JCP’s aluminium
                                                                        (see Chart 1). However, during that period there have been
price forecasts well under cost-push based consensus
                                                                        several price spikes. Price spikes pre-2000 were mainly the
forecasts.
                                                                        result of oil price shocks. Over time as more aluminium supply
JCP’s relatively low aluminium price outlook is the reason behind       became tied to stranded non-oil based power, changes in oil
our short position in AWC. JCP’s long-run aluminium price of            prices have had a smaller impact on the aluminium price. Post
US$1.05 a pound is 16% under forecast long-run consensus                2003, price increases to US$1.30 to US$1.40 a pound were the
aluminium prices of around US$1.22. Increasing our long-run             result of large increases in Chinese demand. Since 2008, large
aluminium prices to match consensus forecasts would increase            increases in Chinese demand have been swamped by even
our AWC and RIO valuations by (a whopping) 80% and 10%                  larger increases in Chinese supply.
respectively.
The weak outlook for the aluminium sector has broader                           Chart 1: Real and nominal aluminium prices, 1970 to 2011
implications for the Australian energy market with a strong
likelihood two to three of the existing four aluminium smelters will
close on the Australian East coast by 2015.
(Bauxite + energy) = (alumina + energy*2) = aluminium
Aluminium production is more of an industrial than a mining
process. Bauxite is mined and energy (plus caustic soda) is
added to produce alumina. A lot more energy is then added to
the alumina to produce aluminium. Cheap energy is essential to
produce competitively priced aluminium.
The global aluminium industry can be divided into two types of                                  Source: Morgan Stanley

production. Namely:
“Western” production – ideally aluminium smelters would be              Between 1980 and 2000, aluminium demand grew at global
located by large bauxite deposits, then transformed into alumina        GDP-like growth rates of around 3%, spiking to nearly 6%
and then aluminium using cheap power. Unfortunately such                between 2001 and 2010, on the back of strong demand from
operations do not exist. A typical production chain is large bulk       China. To better understand the global aluminium industry it is
mining of bauxite, (ideally) short haul distance to alumina refinery,   important to differentiate between Chinese demand and supply
followed by transport to aluminium smelter typically making use         and the rest of the world.
of cheap or stranded power. Western alumina refineries and              Global aluminium demand, ex-China has grown at around
aluminium smelters tend to be older, large scale plants, often          1% - 3% a year for the last 30 years. Supply can easily meet
with relatively dated technology. Key determinants to profitability     increases in demand for two reasons:
are relatively low transport costs, low tax regime, low labour

1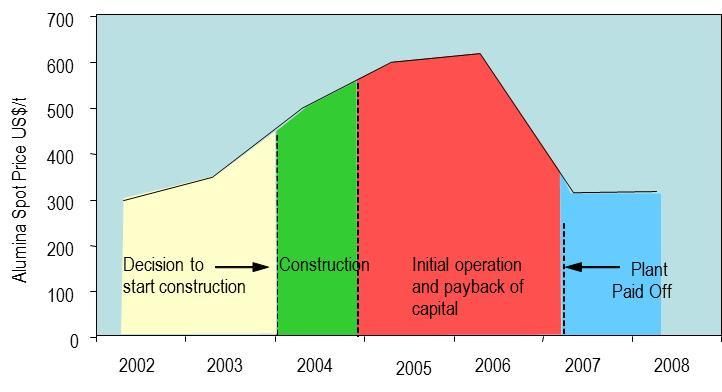
JCP Investment Partners - The Aluminium Market Outlook

Aluminium - more of a material than a metal.... 				                                                                                                                                 August 2012

1.   Supply creep is ~ 2% to 3% a year, whilst improvements in                                 Chart 3: The Chinese Alumina and Aluminium Industry is Based on a Trader
     process and technology have allowed aluminium supply to                                                                  Mentality
     increase based on no additional capacity. If supply creep is
     roughly equal to global demand it is not surprising aluminium
     prices have remained low.
2.   Few barriers to entry enabled new players to enter the
     industry and compete for market share (typically based on
     new stranded power supply). Competition for market share
     has pushed down the cost curve and resulted in falling real
     aluminium prices.
                                                                                                       Source: Bespoke work for JCP Investment Partners, Anthony Kjar, Gibson Crest Pty Ltd

China has taken the aluminium market by storm over the
last few years...                                                                He also highlighted the importance of replication in reducing
                                                                                 the capital costs of aluminium in China, estimating that the
In 2000, China was roughly 20% of global aluminium capacity                      capital costs of building aluminium capacity in China are less
(5 million tonnes). By 2011, China was over 45% of global                        than half of Western costs. Roughly half the capital savings are
production (20 million tonnes). Over the same period, rest of                    associated with replication of project management, procurement
world production remained relatively flat (Chart 2). New capacity                and technology fees (see Chart 4).
additions in China are expected to add an additional 7 to 15
million tonnes by 2015 which would see China representing 60%
                                                                                          Chart 4: Indicative capital costs of aluminium plant in China, India and the Middle East
of global aluminium capacity.

            Chart 2: Chinese and rest of world aluminium capacity, 2000 & 2011
                                       (milliontonnes)

                                                                                                       Source: Bespoke work for JCP Investment Partners, Anthony Kjar, Gibson Crest Pty Ltd

                                                                                 … and flattened the global cost curve
A long-time JCP proprietary aluminium industry expert charac-
                                                                                 The increase in Chinese aluminium production has flattened the
terises the two types of production as the Western miner versus
                                                                                 global cost curve (Chart 5). Costs of aluminium production are
Chinese trader mentality:
                                                                                 roughly the same despite different input costs across regions.
“With low capital costs, small increments of capacity, and a                     Companies like Chalco have the advantage of relatively high
much faster construction schedule, Chinese plants can be built,                  quality local bauxite but are less efficient. Coastal aluminium
operated and if needed shut down in one price cycle, providing                   producers mostly import bauxite but are relatively new and
a return on investment. This contrasts to Western plants,                        more efficient, however they are now being hit by higher energy
managed under a miner mentality, which are justified over a 20                   prices. Chinese producers tend to be at the top end of the cost
year horizon and do not often catch the price cycle in the early                 curve, but with much lower capital costs. The red area circled in
years (see Chart 3).                                                             Chart 5 below, represents where Chinese production sits on the
                                                                                 aluminium cost curve.
It is easy and cheap to shut down high cost Chinese plants during
low prices/high power costs as the plants are small, technology
is more forgiving and labour costs are low. This contrasts to                                     Chart 5: Global Aluminium Cost Curve (US$/tonne)
                                                                                  Cost (US$/tonne)
Western plants which are usually larger, have high fixed cost and                 2,800

are difficult to shut. The trader mentality leads to high use of spot             2,400
                                                                                                 1st Quartile                     2nd Quartile                    3rd Quartile                  4th Quartile

contracts for raw materials (bauxite, alumina, power) and ready                   2,000

acceptance and use of replicated technology, often provided by
                                                                                  1,600

others. The trader is willing to operate the business in the top
end of the cost curve, while the miner tries (but is not always
                                                                                  1,200

successful) to operate at the bottom end of the cost curve.”
                                                                                   800

                                                                                   400

                                                                                     0

                                                                                           0           5,000          10,000        15,000            20,000     25,000          30,000       35,000           40,000   45,000

                                                                                                                                             Cumulative Production (000 t)

                                                                                                                                             tonne)

2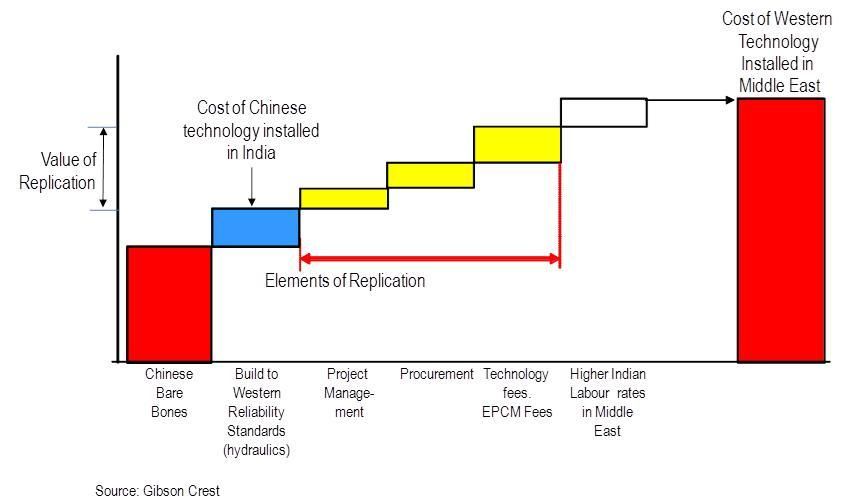
JCP Investment Partners - The Aluminium Market Outlook

Aluminium - more of a material than a metal.... 				                                                                                                                     August 2012

While Chinese production operates primarily in the 3rd and 4th          Contrast this with AWC’s Point Henry smelter in Victoria and the
quartile of the cost curve, the costs of aluminium production for       Kurri Kurri smelter in NSW that are conducting multiyear reviews
western producers have been increasing relative to Chinese              and may or may not close by 2014.
costs. Western aluminium labour costs, caustic soda, sustaining
                                                                        Higher labour costs in China – labour costs in China are also
capital, and most importantly, energy prices have been
                                                                        increasing. As part of Chinese Government social cohesion
increasing. In the case of AWC and RIO, both companies are
                                                                        measures and the latest five year plan, minimum wages have
being hurt by a high Aussie and Canadian dollar. Both face and
                                                                        increased by up to 40% over the last two years. In order to
will continue to face increasing power prices:
                                                                        counteract higher wage costs, Chinese aluminium producers
• AWC – the sweetheart electricity price deal struck between            have embraced increased automation and technological
  Loy Yang B and AWAC (the Alcoa-AWC JV) thirty years ago               improvements. Innovations such as different cathode designs
  ends in 2014. We estimate AWAC will face an electricity price         have helped decrease electricity consumption and compensate
  increase of 10% to 20% . Higher electricity prices, a carbon tax      for higher wage costs.
  and high Aussie dollar means the likelihood of the Point Henry
                                                                        Higher RMB – the RMB has appreciated against the USD and
  smelter remaining open after 2015 is very low. The Portland
                                                                        euro over recent years. But given the changing nature of China’s
  smelter may remain open over the medium term given it is
                                                                        trade balance and current account, continued RMB appreciation
  more modern and larger scale.
                                                                        is no longer a one-way bet. The RMB will continue to appreciate
• RIO – the rationale behind RIO’s bid for Alcan was access to          against other global currencies but change will be incremental,
  low cost, carbon-lite hydro assets providing cheap power to           not a step change.
  the associated aluminium smelters. However, 40% - 50% of
  RIO’s Canadian hydro assets pay full grid prices. A shortage          China’s aluminium industry push West is driven by cheap
  of power as a result of recent drought (by Canadian standards)        coal and Government incentives
  and community pressure means RIO has had less access to               The focus of new aluminium production in China is the Xinjiang
  power than expected.                                                  province. It’s estimated that Xinjiang province alone may add
A flat cost curve and low barriers to entry means aluminium prices      10 to 15 mtpa of new aluminium capacity in the next five years.
will be relatively stable and tend to hug the 75% - 85% percentile      Production costs in the Xinjiang province are 20 to 30 cents a
of the global cost curve. The relatively lower capital cost of          pound cheaper than coastal China. Xinjiang also enjoys:
Chinese aluminium producers also allows Chinese producers               • Lower labour costs.
to operate closer to the cost curve for a greater percentage of
time.                                                                   • Government support and subsidies – Xinjiang is exempted
                                                                          from restriction on new aluminium capacity. Smelters receive
Cost push inflation in China will be balanced by the shift                a two year tax holiday, and a 50% corporate tax discount in
of production west and innovation                                         years three to five. Assistance takes other forms – for instance,
                                                                          we were told that one company planning a 1 mtpa smelter in
Given the relatively flat Chinese cost curve, most market partic-
                                                                          Xinjiang was given a one billion tonne coal resource.
ipants believe cost inflation in China, coupled with other structural
changes, will push long-run aluminium prices 30% - 40% above            Taking the above into account and as shown in Chart 6, JCP
current levels. JCP believes that while cost inflation in China will    estimate that China’s marginal cost of production will fall from
occur, the use of technology and the shift west to utilise power,       US$1.15 a pound (US$2,500 a tonne) to US$1.05 a pound
will keep price increases to a minimum.                                 (US$2,300). We believe the market underestimates the ability of
                                                                        China’s aluminium industry to adapt and innovate.
Stepping through some of the rationale behind higher long-run
consensus prices:
Higher power prices in China – power prices in China                              Chart 6: Global Aluminium Cost Curve 2010 (US cents a pound)

are increasing. However, China’s aluminium producers are
somewhat shielded from these power increases.
Firstly, many aluminium smelters have captured power. That is,
vertically integrated producers take coal, convert it into energy
and transmit straight into alumina refineries or aluminium
smelters, eliminating the need to utilise the grid.
Second, much of China’s aluminium production is moving rapidly
west, as producers, particularly on the Chinese coast, have
seen power prices surge by over 100%. To counter the increase,
producers are simply closing down existing plants and moving
west – or to use the preference analogy; the trader mentality
allows relatively small scale flexible producers to shut up shop                  Source: Bespoke work for JCP Investment Partners, Anthony Kjar, Gibson Crest Pty Ltd

and relocate elsewhere where input costs are lower.

3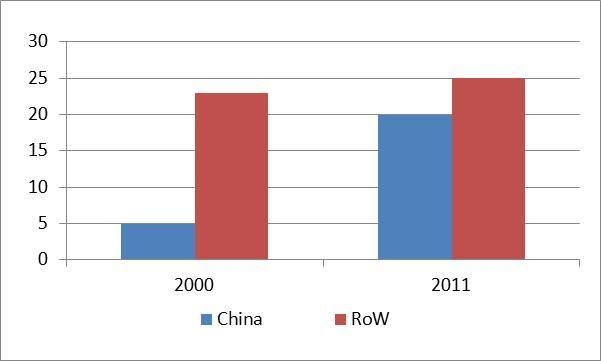
JCP Investment Partners - The Aluminium Market Outlook
Aluminium - more of a material than a metal.... August 2012
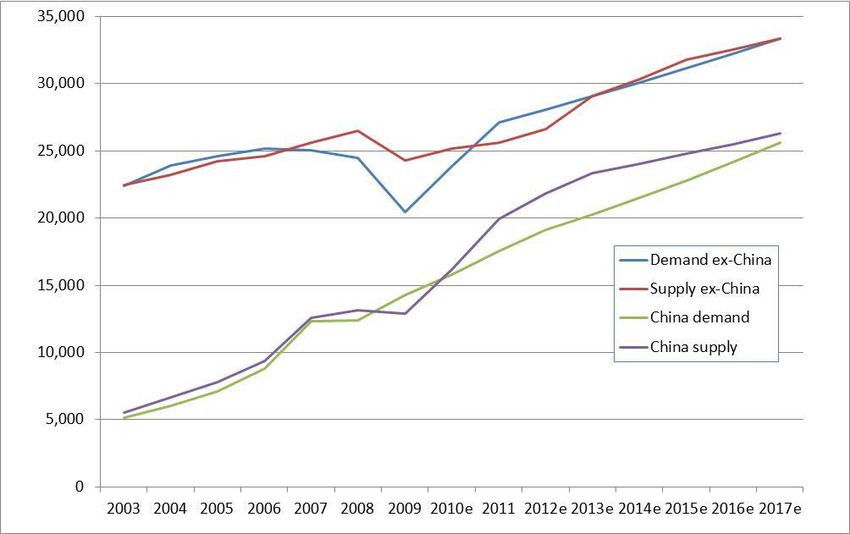
Ex-China global aluminium demand can be met by capacity Chart 7: JCP Aluminium Demand and Supply Forecasts (M.tonnes)
creep
Over the last 30 years, growth in global aluminium demand has
average 3-4%. Ex-China growth has been closer to 2%. Over
the last decade, aluminium demand ex-China has been around
3%. However, global demand actually fell between the start of
the decade and the GFC in 2009. Post GFC, global aluminium
demand has enjoyed a strong rebound with growth of 17% in
2010 and 14% in 2011 (see Table 1).
Table 1: Global Aluminium Demand by Region, 2003 to 2011
Unit 2003 2004 2005 2006 2007 2008 2009 2010 2011
Source: JCP Investment Partners
China Kt 5,178 6,043 7,083 8,790 12,347 12,413 14,300 15,805 17,554
% 25.8 16.7 17.2 24.1 40.5 0.5 15.2 10.5 11.1
BRI (Brazil, Russia, India) Kt 2,189 2,532 2,737 2,900 3,081 3,236 3,007 3,145 3,393
China has moved rapidly up the aluminium consumption to GDP
% 0.8 15.7 8.1 5.9 6.2 5.0 -7.1 4.6 7.9
USA Kt 5,667 5,800 6,114 6,150 5,545 4,906 3,854 4,242 4,060
% 2.9 2.3 5.4 0.6 -9.8 -11.5 -21.4 10.1 -4.3
Europe Kt
%
7,122
5.8
7,360
3.3
7,354
-0.1
7,730
5.1
8,138
5.3
7,794
-4.2
5,740
-26.4
7,506
30.8
7,878
5.0 curve as shown in Chart 8. JCP believes the rapid escalation in
Japan Kt 2,235 2,319 2,276 2,323 2,197 2,250 1,523 2,025 1,946
World Refined Consumption
%
Kt
11.2
27,606
3.7
29,961
-1.8
31,709
2.0
33,995
-5.4
37,409
2.4
36,904
-32.3
34,764
33.0
39,661
-3.9
44,687
aluminium consumption will rebase to a lower growth level as
Chinese aluminium consumption to GDP trajectory corrects to
% 8.8 8.5 5.8 7.2 10.0 -1.4 -5.8 14.1 12.7
World ex-China Kt 22,429 23,918 24,626 25,205 25,062 24,491 20,464 23,856 27,133
% 1% 7% 3% 2% -1% -2% -16% 17% 14%
Source: CRU
be more in line with Taiwan and South Korea.
Chart 8: Aluminium Consumption Per Capita
Setting the base for new aluminium demand forecasts is key
to understanding the global demand and supply balance. Most
market forecasters estimate (conveniently) global aluminium
demand will grow at 7% until 2015 and beyond, half of 2011
growth. JCP believe achieving consistent growth in aluminium
demand more than double historical growth rates is unlikely.
JCP’s aluminium demand and supply forecasts for China and the
rest of the world are set out in Chart 7. It is important to split out
analysis to show China versus non-China forecasts.
• Short-run ex-China demand outstrips supply but inventory
can meet the difference – how can current aluminium demand With supply expected to exceed demand, few barriers to entry,
Source: Morgan Stanley
be greater than supply and prices be so low? The answer a flat cost curve and capacity utilisation at around 80%, JCP
is a mixture of under-utilised capacity and inventory. Current forecast aluminium prices well under consensus. Our long run
aluminium capacity is running at under 85%. Therefore any forecast for aluminium is 1.05/USD pound. This is captured in
increase in demand that causes an increase in price will chart 9, which depicts our ‘cone of uncertainty’ for aluminium
stimulate increased capacity utilisation. There is also three prices to 2040.
months of global demand currently sitting in LME warehouses
or bonded storage as part of the global aluminium carry-trade
Chart 9: JCP Aluminium Price Forecast to 2040 (US cents a pound)
(explained below). Any increase in price will trigger stock
to come out of inventory into the physical market. Over the
medium-term, JCP forecasts non-China aluminium supply will
be increased by six million tonnes by 2015. During the same
time demand will increase by four million tonnes (Chart 7).
• Large increases in new Western Chinese aluminium
supply will force the closure of coastal production – an
additional 10 to 15 million tonnes of aluminium is expected
to start in Xinjiang province alone by 2015. While growth will
remain robust at 7-8%, new supply and a current capacity
Source: JCP Investment Partners
utilisation of under 80% will mean supply can easily match
demand. However, the gap between supply and demand as
Indonesian bauxite supply can be replaced by Chinese and
illustrated in Chart 7 is unlikely to be as large given high cost
Australian supply
coastal capacity is expected to close bringing the net increase
in aluminium supply to under 10 million tonnes. One threat to JCP’s view that innovation and a shift west in China
will balance coastal producers cost pressure, are the recent
changes to Indonesian mining laws.
The legislative shifts are very import as Indonesian bauxite
represents 20% of China’s bauxite needs. Despite the signif-
4JCP Investment Partners - The Aluminium Market Outlook
Aluminium - more of a material than a metal.... August 2012
icance of announced changes JCP believes the potential loss of Potentially, there is up to six to nine months of global aluminium
Indonesian bauxite to China’s production will be limited for three demand tied up in the carry forward trade.
reasons:
Once the term of the contracts expire, if the cost of debt increases
Indonesian laws are likely to be relaxed – recent or the aluminium forward curve moves into backwardation, six to
announcements by Indonesian officials appear to back up recent nine months of global aluminium demand will then need to find
JCP discussions with ex-Indonesian Government officials, a home.
suggesting laws will be relaxed to find “an equilibrium level”.
The implication for the short-run price of such scenarios is ugly.
Indonesian contacts cautioned JCP not to confuse Western
For example, the price of aluminium during the GFC fell to 60
and Indonesian law making processes. Instead of debating,
cents a pound. Using chart 5 as a reference, no aluminium
then law-making (ah-la Western style), Indonesia tends to set
producer is covering their costs at 60 cents a pound.
a law and then debate the impact, timing and enforcement. JCP
believes the enforcement of “value adding laws” to Indonesian Two or three out of four aluminium smelters on the
bauxite exports will be delayed for two practical reasons: Australian East coast will close by 2015
(1) There is simply not enough energy in Indonesia to convert One of the broader implications for JCP’s relatively poor outlook
the bauxite into alumina – the only way to add value to bauxite. for the aluminium market and prices is the potential for aluminium
(2) Such changes would deprive the Government of US$1 billion smelter closures on the Australian East coast, where the four
plus in export revenues. aluminium smelters use between 15% to 18% of New South
Wales’ and Victoria’s combined electricity output. As smelters
As quoted in a recent AFR article, “Indonesia appears to run 24 hours a day, any capacity closures will have a significant
be backtracking after an outcry from foreign investors. The impact on East coast base-load demand. The Bell Bay smelter in
government has decided to grant any miner that can prove it has Tasmania is also a significant user of electricity.
plans to establish smelting or refining capacity in Indonesia an
exemption from the ban on metal ore exports until 2014.” JCP estimates the current cost structure for Australia’s East
coast and Tasmanian smelters:
China’s alumina producers are good at converting low
quality bauxite into alumina – Clark and Marron believe • New South Wales – Kurri Kurri at US$1.00 a pound and
China’s bauxite reserves are significantly larger than official Norsk Hydro US92 cents.
sources suggest. China’s bauxite is typically high grade but also • Victoria – AWC’s Portland US87 cents and Point Henry
high in silica content (resulting in higher caustic soda losses). smelters US85 cents.
However, using an assisted Bayer process Chinese alumina
producers have been able to process bauxite deemed in the • Tasmania – Bell Bay US95 cents.
West as unsuitable. All smelters face relatively high Australian wage costs, a high
Australian, Asian and African bauxite producers are queuing Aussie dollar, a new carbon pricing regime and, most importantly,
up to meet Chinese demand – potential changes in Indonesian a step change in energy prices. JCP believes two to three of the
mining laws have Chinese coastal alumina producers concerned. four mainland smelters will close by 2015. In addition, Bell Bay
But given bauxite is the most common element in the earth’s is unlikely to remain open. Specifically, we see Kurri Kurri, Norsk
crust and there are few barriers to entry, a raft of existing and Hydro and Point Henry as the most likely to close. Closures
green-field producers are lining up to meet potential Chinese of large base-load consuming smelters will keep wholesale
demand. Given most of the new Chinese demand will be in electricity prices low while also helping Australia meet its carbon
the West, JCP believes many new proposed green-field bauxite objectives. Smelters will close with or without a carbon tax.
projects will be disappointed. Implications for JCP Portfolios
“The forward trade in aluminium is risk-free” JCP remain short AWC in our long short fund and underweight in
our other strategies at the time of writing this paper.
Another feature of the global aluminium market is the carry
forward trade based on the current contango in the aluminium
market.
For further information please contact:
Traders, banks, producers and consumers are all selling forward Peter Harris
aluminium based on the upward sloping forward curve and taking Senior Research Analyst
peter.harris@jcpip.com.au
advantage of the arbitrage between the current and future price
of aluminium, less the cost of (cheap) debt and storage.
THIS MATERIAL IS INTENDED FOR USE SOLELY BY INSTITUTIONAL INVESTORS. STRICTLY NOT FOR PUBLIC DISTRIBUTION.
The information contained in this brochure is general information only. It has been prepared without taking into account specific investor objectives. You should
assess whether this investment us suitable for your specific investment objectives and seek professional advice before deciding to invest in the product. JCP
Investment Partners cannot guarantee the success of our return of capital of any investment in this product. Information contained herein is accurate at the date of issue.
JCP Investment Partners LTD, Level 23, 600 Bourke Street, Melbourne, Victoria, 3000. ABN 23 085 400 540. AFSL No. 247132
5You can also read