97th USDA's Agricultural Outlook Forum Building on Innovation: A Pathway to Resilience
←
→
Page content transcription
If your browser does not render page correctly, please read the page content below
United States Department of Agriculture

      USDA’s Agricultural Outlook Forum
      97th Building on Innovation:
      Annual A Pathway to Resilience

           Cotton Outlook

               Friday, February 19, 2021

February 18-19, 2021 • https://www.usda.gov/oce/ag-outlook-forum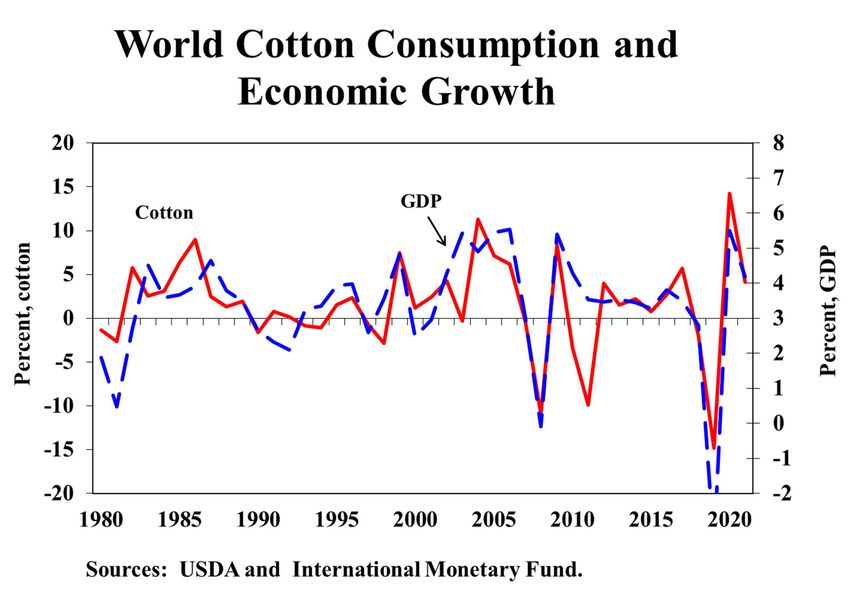
Agricultural Outlook Forum 2021                              Presented Friday, February 19, 2021

               THE WORLD AND UNITED STATES COTTON OUTLOOK
             James Johnson, Stephen MacDonald, Leslie Meyer, and Graham Soley.
                               U.S. Department of Agriculture

                                          Introduction

The U.S. Department of Agriculture’s (USDA’s) first 2021/22 world cotton projections
anticipate that global consumption will exceed production, reducing world stocks by 3.2 million
bales. World cotton production is expected to rise 4.7 percent, with harvested area rising in some
countries. Global consumption is expected to again grow at an above average rate, as the world
economy continues its recovery from the severe downturn in 2020. It is expected that China will
continue importing at the relatively high level forecasted for 2020/21 as its textile use grows and
it maintains government-held stocks. The A Index is forecast to rise 7 cents to average 90 cents
per pound as global stocks continue to decline.

U.S. 2020/21 cotton production is expected to rise to 17.5 million bales, based on a slight decline
in planted area, but higher harvested area, as abandonment declines from 2020/21’s unusually
high level raising harvested area. Domestic mill use is projected slightly higher and exports are
projected largely unchanged from their 2020/21 levels. Ending stocks are projected lower for the
second consecutive year.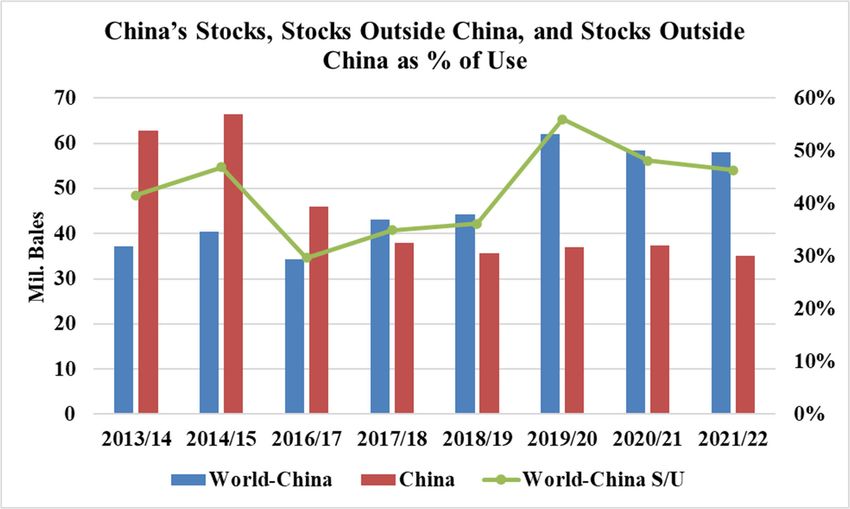
World Cotton Situation, 2020/21

World Cotton Production, 2020/21

                       Estimated Changes in World Production, 2020/21
                                  compared with 2019/20
                 3.0
                 2.0
                 1.0
                 0.0
                -1.0
   Mil. Bales

                -2.0
                -3.0
                -4.0
                -5.0
                -6.0
                -7.0
                -8.0
                -9.0
                       World   United   Brazil Pakistan Turkey        India   China Australia
                               States

Global 2020/21 cotton production is down 6.5 percent from the previous year to 114.1 million
bales, as most major producing countries witnessed decreases, excluding China and Australia.
The United States saw a 24.9 percent decrease with significantly lower area harvested, especially
in Texas. U.S. 2020/21 area harvested was down roughly 25 percent to 3.5 million hectares, and
recorded a yield of 925 kg/hectare, fractionally up from the previous year. Pakistan production
fell 27.4 percent to 4.5 million bales, owed to the lowest yields in nearly 40 years. India and
Brazil production are projected lower on less area harvested and declines in yield.

China’s 2020/21 crop is estimated at 29.0 million bales, up nearly 2 million bales from the
previous year and the highest level in 6 years. This is despite lower area harvested, which is
estimated at 3.25 million hectares and down more than 5 percent from the previous year. Yield is
estimated at a record 1,943 kg/hectare, up 13 percent from last year. Lower area outside of
Xinjiang province is offset by an increasing share of cotton planted in Xinjiang, where yield is
around twice the national average. The 2020/21 season was characterized by favorable
conditions—good irrigation water availability and favorable temperatures throughout the major
part of the season. These conditions facilitated rapid planting and early crop establishment in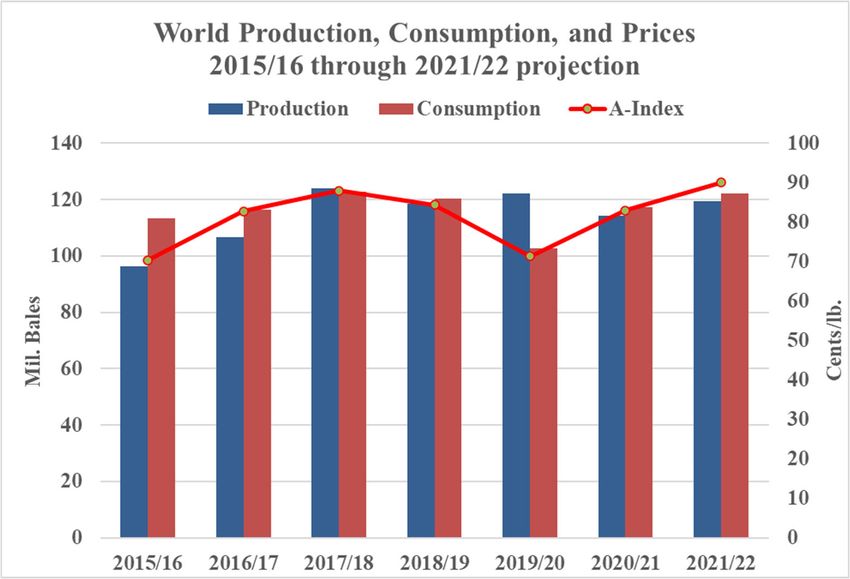
Xinjiang, helping produce above average yields across the region, although the quality is below
last year.

India’s 2020/21 production is estimated at 29 million bales, down roughly 2 percent from the
preceding year on both slightly lower area harvested and yield. Nonetheless, India’s crop
matched the level witnessed three years prior, and is tied for the fourth largest on record.
Harvested area is estimated at 13.3 million hectares, the second highest level and down
marginally from 2019/20’s record of 13.4 million. India’s 2020/21 yield is estimated at 475
kg/hectare, down roughly 1 percent from the previous season.

China first replaced the United States as the world’s largest cotton-producing country in 1980,
and then maintained that rank for nearly 35 years starting in 1982. In 2015, China relinquished
the top rank following significant reforms to its support for producers and as rising wages
reduced the profitability of cotton farming in the Yellow River and Yangtze River basins.
Modernization of India’s cotton production—including the adoption of Bt varieties—propelled
India to the first rank among cotton producing countries in 2015, but variable weather and
developing problems with bollworm resistance helped drop India to the number two spot in
2019, and in 2020 India and China are estimated to be in a tied for the spot of largest cotton-
producer. The United States in the next largest producer after India and China, followed by
Brazil, and Pakistan.

2020/21 China Supply and Demand

                   China Cotton Supply and Demand 2019/20 and
                                     2020/21

                                                                        Change
                     Attribute           Unit      2019/20 2020/21
                                                                         (%)
                 Beginning Stocks     mil. bales      35.7       36.9       3.4
                 Area Harvested       mil. HA          3.5        3.3      -5.8
                 Production           mil. bales      27.3       29.0       6.4
                 Imports                  "            7.1       11.0      54.1
                  Total Supply            "           70.1       76.9       9.8
                 Exports                  "            0.2        0.1     -20.4
                 Use                      "           33.0       39.5      19.7
                  Total Use               "           33.2       39.6      19.5
                 Ending Stocks            "           36.9       37.3       1.0
                  State Reserve           "           11.1       12.0       8.1
                 Stock to Use %           %          110.8       93.8     -15.4
China’s 2020/21 consumption is expected to rebound nearly 20 percent to settle at 39.5 million
bales, the same level witnessed two years prior and pre-COVID 19. Imports are forecast at their
highest level in 7 years at 11 million bales, mainly driven by State Reserve demand. The State
Reserve has increased imports in large part due to lower expected domestic purchases—there
have been no reported purchases to date in 2020/21 as domestic cotton prices in China have
consistently exceeded international prices by a margin above the threshold for permitting
purchases. China’s stocks are expected up nearly 400,000 bales, with State Reserve levels
estimated remaining largely unchanged on a domestic marketing year (Sept.-Aug.) basis.

2020/21 World Consumption, Trade, Ending Stocks, and Prices

World cotton consumption in 2020/21 is expected to reach 117.2 million bales, growing more
than 14 percent from the previous year after falling nearly 15 percent in 2019/20 due to COVID-
19 lowering operating rates in most major consuming countries and temporarily reducing
consumer demand for clothing. Consumption growth is forecast for all major consuming
countries, with China and India accounting for nearly 11 million bales of the world’s 14.6
million bale increase. Outside of China and India, Pakistan and Turkey are expected to witness
the most significant growth of the world’s top 10 consuming countries, with both countries
growing more than 10 percent.

                   World Cotton Supply and Demand 2019/20 and
                                    2020/21

                                                                         Change
                     Attribute            Unit      2019/20 2020/21
                                                                          (%)
                 Beginning Stocks      mil. bales      80.0       98.9       23.7
                 Area Harvested        mil. HA         34.9       32.3       -7.6
                 Production            mil. bales     122.1      114.1       -6.5
                 Imports                   "           40.7       43.9        8.0
                  Total Supply             "          202.1      213.1        5.4
                 Exports                   "           41.3       43.9        6.4
                 Use                       "          102.6      117.2       14.2
                  Total Use                "          102.6      117.3       14.4
                 Ending Stocks             "           98.9       95.7       -3.2
                 Stock to Use %            %           96.4       81.7      -15.3

World trade is expected to increase to 43.9 million bales in 2020/21, the third-highest level and
largest volume since 2012/13’s record. Despite 2020/21 U.S. production falling 5.0 million
bales, U.S. exports are forecast nearly unchanged from the previous year at 15.5 million bales,
owed to large carryin supplies and strong China demand. China’s total imports are expected up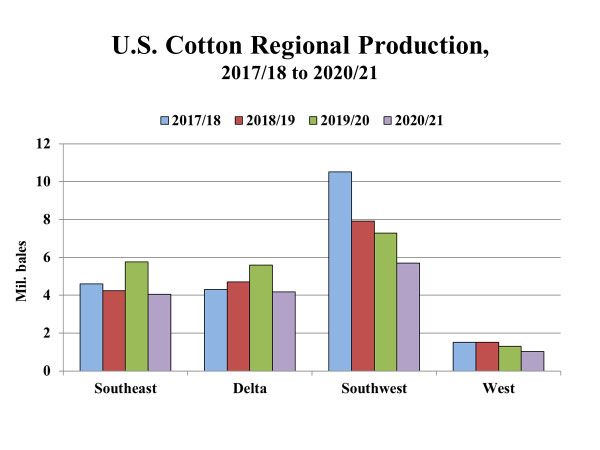
nearly 4 million bales from the previous year led by strong State Reserve demand. Regarding
global importers outside of China, Pakistan is projected to witness the most significant growth,
rising more than 1.0 million bales to a record 5.0 million bales. Despite the growth in China and
Pakistan, imports are expected to fall for half of the top ten global importers. Brazil exports are
projected at a record 10.0 million bales, more than 1.0 million bales higher than the previous
year’s record owed to three consecutive record crops (2017/18 to 2019/20), which has
significantly boosted exportable supplies. India exports are expected at their highest level in 3
years, up more than 50 percent from the previous year amid record carryin supplies.

World ending stocks are estimated at 95.7 million bales, down from the previous year but up
more than 15 million bales from two years ago. Record India stocks coupled with the effects of
COVID-19 from the previous year boosted world beginning stocks more than 20 percent in
2020/21, as countries continue to work off excess supplies despite lower global production.
China and India are forecast to account for more than half of global stocks, with levels projected
up in both countries in 2020/21. The United States is expected to witness the most significant fall
with stocks plunging nearly 40 percent, buoyed by strong export demand.

                                 U.S. Cotton Situation, 2020/21
Area and Production

U.S. all-cotton production in 2020/21 is estimated at approximately 15.0 million bales, 25
percent below last season’s crop. Cotton planted acreage in 2020—at 12.1 million acres—
decreased 12 percent, as relative prices favored alternative crops over cotton. Planted area to
cotton was the lowest in 4 years, but the abandonment rate climbed to 28 percent in 2020—
compared with the previous 3-year average of 19 percent. U.S. harvested area reached only 8.7
million acres in 2020, the lowest since 2015, while the yield was marginally above the previous
season’s at 825 pounds per harvested acre. Upland production is estimated at 14.4 million
bales—4.8 million below 2019—with an average yield of 813 pounds per harvested acre,
compared with the 5-year average of 836 pounds. Extra-long staple (ELS) cotton production is
estimated at 522,000 bales, as both lower area and yield reduced the ELS crop to its smallest in 5
years.
                    U.S. Cotton Area, Abandonment, Yield, and Production
                                    Unit      2016/17 2017/18 2018/19 2019/20 2020/21
    Planted acres                mil. acres       10.1        12.7      14.1       13.7        12.1
    Harvested acres              mil. acres         9.5       11.1      10.0       11.6          8.7
    Abandonment rate                 %              5.6       12.7      29.1       15.5        28.0
    Yield/harvested acre          lbs./acre        867         905       882        823         825
    Production                   mil. Bales       17.2        20.9      18.4       19.9        15.0

Compared with the previous season, 2020 upland cotton production was smaller in each of the
four Cotton Belt regions. In the Southwest, the upland cotton crop decreased 1.6 million bales to
about 5.7 million bales, the lowest in 7 years, accounting for 39 percent of the total U.S. upland
production. Hot and dry conditions—along with a hurricane in south Texas—hampered the crop
this season and pushed abandonment to 44 percent for the region, well above the 5-year average.
The Southwest accounted for more than 60 percent of the U.S. upland planted acreage but only
half of total harvested area. Meanwhile, the Southwest yield increased from 2019’s 8-year low to
641 pounds per harvested acre, but remained considerably below the 5-year average.
Southeast cotton production declined 30 percent in 2020 to 4.0 million bales, the smallest crop
since 2016, contributing 28 percent of the U.S. upland crop. Cotton planted area decreased to
about 2.4 million acres—the lowest in 4 years—as some area shifted to corn, soybeans, and
peanuts. In addition, the effects of hurricanes and tropical storms in 2020 reduced the Southeast
yield to 838 pounds per harvested acre, well below last season and the 5-year average.
Delta cotton production in 2020 decreased 25 percent from the previous year to nearly 4.2
million bales. Similarly, planted area declined to only 1.8 million acres, the lowest since 2016.
With average abandonment, harvested area was also the smallest in 4 years. The Delta yield
reached 1,132 pounds per harvested acre in 2020—slightly above the 5-year average—
contributing to a Delta crop that accounted for 29 percent of the total U.S. upland production.
U.S. Cotton Supply and Demand 2019/20 and 2020/21
Change
Attribute Unit 2019/20 2020/21
(%)
Beginning Stocks mil. bales 4.9 7.3 49.5
Area Harvested mil. HA 4.7 3.5 -25.1
Production mil. bales 19.9 15.0 -24.9
Imports " 0.0 0.0 0.0
Total Supply " 24.8 22.2 -10.3
Exports " 15.5 15.5 -0.2
Use " 2.2 2.4 11.6
Total Use " 17.7 17.9 1.3
Ending Stocks " 7.3 4.3 -40.7
Stock to Use % % 41.0 24.0 -41.4
Farm Price cents/lb. 59.6 68.0 14.1
Upland area and production in the West declined in 2020, despite a rebound in the region’s yield.
In the West, 2020 planted area totaled 202,000 acres, the lowest in 5 years. However, the
region’s yield increased to near the 5-year average to 1,359 pounds per harvested acre and kept
production from falling below the recent low in 2015. Upland production in the West totaled
521,000 bales and accounted for less than 4 percent of the U.S. upland crop in 2020.ELS cotton area—grown mainly in the West—was also lower in 2020, with planted area at 202,500 acres. Coupled with a below-average yield this season of 1,362 pounds per harvested acre, ELS production reached only 552,000 bales, the lowest in 5 years. California accounted for 86 percent of the total ELS crop in 2020. Domestic Mill Use and Consumer Demand U.S. cotton mill use for 2020/21 is forecast at 2.4 million bales, a moderate rebound from the previous season’s recent low that was attributable to the pandemic. Mill use is expected to increase as economic activity expands despite competitive polyester fiber prices. During the first 4 months of 2020/21, cotton mill use reached 800,000 bales, below a year earlier. However, the pace of U.S. cotton mill use during the remaining months of 2020/21 is expected to exceed the year before, with the 2020/21 total surpassing last season’s 2.15 million bales. U.S. consumer demand for textile and apparel products follows the global economy. With the U.S. and global GDP declining in calendar year 2020 as the impacts of COVID-19 unfolded, total U.S. fiber product imports also decreased. Based on the 2020 data, fiber product imports declined 8 percent—compared with a year earlier—with synthetic fiber products accounting for the majority of imports. Meanwhile, total U.S. fiber product exports decreased 23 percent in 2020, with all fiber products indicating considerable declines. In calendar 2020, U.S. cotton textile and apparel imports were 12 percent lower at 16.4 million bale-equivalents—the lowest since 2001—while synthetic product imports slipped 5.5 percent. Competitively-priced synthetic fibers—like polyester—and consumer demand for athleisure
clothing reduced the U.S. cotton product import share in calendar 2020 to 41 percent, while
synthetic product imports accounted for 52 percent. Meanwhile, U.S. cotton product exports
decreased 32 percent during 2020 to about 2.3 million bale-equivalents, the lowest since 1994.
As a result, U.S. domestic consumption of cotton (mill use plus net textile trade) in calendar
2020 is estimated to have declined to 16 million bale-equivalents, well below 2019’s 18.2
million bale-equivalents and the lowest since 1993. In addition, U.S. per capita cotton
consumption in 2020 is also estimated lower than the previous year at approximately 23.5
pounds, compared with the 5-year average of 26.5 pounds.
World Cotton Outlook, 2021/22

World Cotton Production, 2021/22

World cotton production is expected to rise nearly 5 percent from the year before in 2021/22, to
119.5 million bales. This level would be below recent peaks in 2017 and 2019, but above the
average production of the previous 5 years. Global harvested area is expected to rise about 3
percent from the year before, led by increases in the United States and West Africa, but area is
expected to decline slightly in the largest producing countries, India and China.

India’s cotton area is expected to decline slightly from the unusually high levels realized in
2019/20 and 2020/21, and production is expected to decline slightly, less than 2 percent.
India’s MSP for cotton supported domestic cotton prices and sustained grower returns through
intervention buying during 2020/21, but cotton prices still lost ground compared with
alternative crops through the Fall of 2020. Late season rainfall and persistent problems with
bollworms also reduced yields, possibly reducing the attractiveness of cotton for some farmers.
Cotton production is expected to decline 500,000 bales to 28.5 million, but India is expected to
be the world’s largest cotton producer in 2021/22 as China’s crop declines by a larger margin.
Estimated Changes in World Production, 2021/22
                                    compared with 2020/21
                  6.0
                  5.0
                  4.0
                  3.0
     Mil. Bales

                  2.0
                  1.0
                  0.0
                  -1.0
                  -2.0

Cotton area in China is also expected to decline slightly from the year before in 2021/22.
Surveys of growers’ intentions in Xinjiang—where the vast majority of China’s cotton
production occurs—suggest area there is likely to be unchanged. Producers in the Yellow
River and Yangtze River Basins are expected to again reduce area, particularly in the Yangtze
Basin following severe, weather-driven yield reductions there. Yield is expected to fall overall
for China in 2021/22 as Xinjiang’s yield declines after a strong performance in 2020/21.
Production is expected to fall 1.5 million bales from the year before, to 27.5 million.

Pakistan’s cotton crop is expected to rebound significantly in 2021/22, but there is great
uncertainty about the future direction of production there. Pakistan’s reported yields have
declined significantly in recent years, reportedly affected by unfavorable weather, insect
damage, and problems with local planting seed quality. However, credible reports have
emerged that long established metrics of farmers’ deliveries to gins may be less reliable than in
past years due to tax avoidance strategies. USDA’s estimate of Pakistan’s 2020/21 cotton
production includes adjustment in response to those reports, and the issue is expected to
continue to be a factor. Assuming a partial rebound in yields, to close to the already below-
average level realized in 2019/20, Pakistan’s cotton production is expected to rise 1.3 million
bales to 5.8 million.

Low yields relative to the global average mean that rising area in West Africa will have less of
an impact on world production than on global area. Cotton production in West Africa’s Franc
Zone is expected to rise 500,000 bales to 5.3 million due to improvement in expected producers’ prices. The sharp decline in the region’s output in 2020/21 was largely driven by a 79 percent decline in Mali, the second largest producer there. Southern Hemisphere plantings for 2021/22 will occur months after the Northern Hemisphere areas discussed above, making forecasts there more uncertain. Brazil’s area is assumed to be unchanged from USDA’s current estimate, and Australia’s is assumed to continue rising as normal weather continues to replenish the reservoirs necessary for this largely irrigated crop. Higher area is expected to lift Australia’s output, while a return to trend yields raises Brazil’s in the 2021/22 forecast. USDA Projections for China, 2021/22 USDA’s China outlook is based on the policies outlined in the Appendix. Production is forecast down slightly, while stocks are expected to fall to the lowest level since 2011/12. China’s production is projected to decrease slightly, with declines in the east continuing and area in Xinjiang remaining steady. Xinjiang yields are expected to decline from this season’s above average yields on the assumption of average weather conditions. China’s consumption is projected to increase, but at a rate slower than the world average. China saw a relatively strong upturn in 2020/21 due to recovery from the impacts of the COVID-19 occurring earlier than in most other countries and its central role in global textile supply chains. The combined growth in 2020/21 and 2021/22 is expected to return China’s cotton consumption to pre-COVID-19 levels.
China’s State Reserve is expected to both buy and sell cotton during the 2021/22 season.
Programs to purchase both foreign cotton and domestic cotton similar to the programs for the
previous two seasons are expected in 2020/21 as part of the stated rotation policy for the State
Reserve. Likewise, sales from the State Reserve are expected in the spring of 2021 and 2022.
Reserve stocks at the end of 2021/22 are expected to be roughly the same as the beginning level.
Purchases by the State Reserve in 2020/21 heavily favored imported cotton, but in 2021/22 are
expected to be much more heavily weighted to domestic cotton to maintain a balanced mix of in
the Reserve’s stocks.

                   China Cotton Supply and Demand 2020/21 and
                                   2021/22 est.

                                                                          Change
                     Attribute            Unit      2020/21 2021/22
                                                                           (%)
                 Beginning Stocks      mil. bales       36.9       37.3       1.0
                 Area Harvested        mil. HA           3.3        3.2      -0.8
                 Production            mil. bales       29.0       27.5      -5.2
                 Imports                   "            11.0       11.0       0.0
                  Total Supply             "            76.9       75.8      -1.5
                 Exports                   "             0.1        0.1       0.0
                 Use                       "            39.5       40.5       2.5
                  Total Use                "            39.6       40.6       2.5
                 Ending Stocks             "            37.3       35.2      -5.7
                  State Reserve                         12.3       11.7      -4.9
                 Stock to Use %            %            93.8       86.2      -8.0

World Cotton Consumption, 2021/22

World cotton consumption is expected to continue rebounding in 2021/22, rising 4.1 percent
from the year before to 122 million bales. If realized, this would be a 19-million-bale and 19
percent increase from 2019’s sharply-reduced level. An increase of comparable magnitude was
last seen in 2004/05 as cotton mill use soared with the completion of the phase-out of the Multi-
fibre Arrangement and China’s accession to the World Trade Organization. However, unlike the
earlier liberalization-driven gain, the increase expected in 2021/22 is part of the recovery from
the nearly unprecedented downward shock stemming from the onset of COVID-19 in 2019/20.
As result, even with a projected growth rate more than double the long run average in 2021/22,
world consumption is still forecast lower than 4 years earlier, and below its long term trend level.

The volatility of the global macro-economy over the last 2 years, and the still uncertain course of
a global pandemic without recent precedent, highlight the uncertainty concerning this and other estimates of the world economy in 2021/22. The International Monetary Fund’s (IMF) January 2021 forecasts of world economic growth in calendar years 2021 and 2022 are unusually high, at 5.5 and 4.2 percent, compared with the 2014-19 average of 3.5 percent. Experience with the projections of the IMF and other forecasters during the Global Financial Crisis of 2009 suggests these forecasts may be subject to larger than normal amounts of revision over the next two years. There are an unusual number of uncertainties involved in this forecast. Global economic recovery will be determined to some extent by the efficacy and speed of distribution around the world of new vaccines against the virus that causes COVID-19. Economic recovery policies in a number of countries will also be a factor, as will coordination and interaction between countries. Cotton consumption declined from its 2017/18 peak in part due to changes in trade relations between the United States and a number of trading partners, particularly China. Trade and cotton consumption benefitted in 2019/20 and 2020/21 from the Phase One Agreement between these two countries to facilitate trade and these forecasts assume continuation. The trade policies of both China and the United States have continued to evolve—such as the U.S. announcement of a Withhold Release Order (WRO) against cotton products and tomato products produced in Xinjiang in mid-January 2021—and the central role of China in world textile supply chains highlights the importance of these issues. China is expected to maintain its position as the world’s largest cotton consumer by a large margin in 2021/22, despite an increase in mill use at a rate below the world average. China’s early recovery from the first phase of the pandemic helped its consumption grow at a rate above the world average in 2020/21, but slower growth is expected in 2021/22. China’s cotton consumption is expected to grow 2.5 percent from the year before, to 40.5 million bales. Faster consumption growth is expected in India, where a 1.7-million-bale gain to 26.0 million bales is projected. A significant gain is expected in Turkey as well, as that country’s textile industry continues to benefit from its proximity to markets in Western Europe and the Middle East. Continuing the trend seen during 2020/21, much more limited recoveries in use are expected by the textile industries of higher income countries, which are still considered unlikely to recover to pre-COVID levels by the end of 2021/22.
World Trade, Stocks, and Prices, 2021/22

                  World Cotton Supply and Demand 2020/21 and
                                  2021/22 est.

                                                                      Change
                    Attribute          Unit       2020/21 2021/22
                                                                       (%)
                Beginning Stocks     mil. bales      98.9      95.7       -3.2
                Area Harvested       mil. HA         32.3      33.2        2.9
                Production           mil. bales     114.1     119.5        4.7
                Imports                  "           43.9      43.9        0.1
                 Total Supply            "          213.1     215.2        1.1
                Exports                  "           43.9      43.9        0.1
                Use                      "          117.2     122.0        4.1
                 Total Use               "          117.3     122.0        4.0
                Ending Stocks            "           95.7      93.2       -2.6
                Stock to Use %           %           81.7      76.4       -6.4

World trade in 2021/22 is projected at 43.9 million bales, unchanged from 2020/21. The world’s
largest importer, China, is expected to maintain imports at 11.0 million bales. Increases are
expected for India, Mexico, Vietnam, and Bangladesh. Declines are seen for Pakistan and
Turkey on improved production. Exports from the United States are expected to be flat, while
exports from Brazil, Mexico, and the Franc Zone will be lower. Exports from India are forecast
higher despite lower production and higher use as stocks accumulated in support of India’s
Minimum Support Price (MSP) program for cotton are auctioned back into the market.
A lower global production forecast coupled with higher use will result in a more than 3-percent
reduction in world ending stocks. While most of the reduction will be seen in China, stocks
outside of China are also expected to decline. The reduction in stocks outside of China follows
four consecutive years of higher stocks but will remain at the second highest level on record.
The change in direction of stocks outside of China coupled with a second year of a positive
growth rate in consumption, following two years of lower global demand, will support higher
price levels in 2021/22, in both the United States and in international markets. The A Index’s
marketing year average is forecast up 7 cents at 90 cents/pound.
U.S. Cotton Outlook for 2021/22
Area, Production, and Supply
The early USDA projection for 2021 U.S. cotton planted acreage is 12.0 million acres, just
below 2020’s 12.1 million acres and the smallest area since 2016. Historically, the relationship
between expected harvest prices for cotton relative to corn and soybeans has played a key role in
the cotton area planted. Cotton futures prices from mid-January through mid-February 2021
averaged about 10 cents (nearly 14 percent) above price expectations in early 2020; for the same
period, however price increases were also seen for corn (+13.5 percent) and soybeans (+24.5
percent), indicating that alternative crop prices are relatively the same or more competitive this
year.
U.S. Cotton Area, Yield, and Production
2020/21 and 2021/22 proj.
Change
Unit 2020/21 2021/22 (%)
Planted area mil. acres 12.09 12.00 -0.7
Harvested area " 8.70 10.00 14.9
Abandonment rate % 28.0 16.7 -11.3
Yield/harvested acre lbs./acre 825 840 1.8
Production mil. bales 14.95 17.50 17.1
Other contributing factors to acreage decisions stem from the cotton farmers’ experiences during
the previous season and the soil moisture conditions heading into planting season. While cropyields in 2020 were near average in three of the four Cotton Belt regions, they were significantly lower in the Southwest, where half of the upland cotton area was harvested. Also, relatively dry conditions this winter in the Southwest region add additional uncertainty about 2021 as the spring planting season approaches. The USDA area projection is about 4 percent (500,000 acres) above the recent National Cotton Council (NCC) survey, which indicated 2021 cotton plantings near 11.5 million acres; the NCC survey was released on February 10, reflecting responses received from mid-December through mid-January. Survey respondents reported 2021 upland cotton area decreases for each of the Cotton Belt regions. In the Southeast, the NCC survey revealed that cotton acreage would decline 4 percent in 2021, with decreases indicated mainly for Georgia and Alabama partially offset by an increase for North Carolina. For the Delta region, 2021 intentions also were expected lower across most States, with an area decline of more than 3.5 percent. In the Southwest, the survey indicated a 5.5-percent reduction in cotton acreage as producers in Texas and Oklahoma expect to plant fewer acres, while those in Kansas plant more cotton. In the West, the NCC reported that upland cotton acreage is expected 2.5 percent lower in 2021. In addition, the survey indicated that producers intend to reduce ELS cotton area in 2021 by 21 percent. USDA’s first survey of producer planting intentions—Prospective Plantings—will be conducted in early March and published on March 31, 2021. For the purposes of this analysis, cotton plantings of 12.0 million acres are estimated to result in harvested acreage of 10.0 million acres, about 15 percent above 2020. The projected national abandonment rate of approximately 17 percent is based on regional long-run averages, with the exception of the Southwest, where 2021 abandonment is projected at 25 percent. Southwest abandonment rates are highly variable and conditions there later this spring will have a considerable impact on the U.S. crop. The latest NOAA seasonal outlook for the Southwest indicates that drought is forecast to remain or develop over much of the cotton growing area of the region at least through April. USDA is forecasting a national average yield—based on regional average yields—of 840 pounds per harvested acre, up from the 2020 yield of 825 pounds. The 2021 U.S. cotton crop is projected at 17.5 million bales, as a rebound in harvested area and yield is projected to increase U.S. cotton production 17 percent (2.5 million bales) above 2020. Similar crops to 2020 are anticipated for most of the Cotton Belt regions, with the exception of the Southwest, where 2021 cotton production could rise to its highest in 4 years. Based on lower U.S. carry-in stocks of 4.3 million bales but higher production for 2021/22, the total supply—21.8 million bales—would decrease slightly and would be its lowest level in 5 years.
U.S. Disappearance, Ending Stocks, and Farm Price

                     U.S. Cotton Supply and Demand 2020/21 and
                                     2021/22 est.

                                                                          Change
                     Attribute           Unit       2020/21 2021/22
                                                                           (%)
                 Beginning Stocks      mil. bales        7.3        4.3      -40.7
                 Area Harvested        mil. HA           3.5        4.0       14.7
                 Production            mil. bales       15.0       17.5       17.0
                 Imports                   "             0.0        0.0        0.0
                  Total Supply             "            22.2       21.8       -1.8
                 Exports                   "            15.5       15.5        0.0
                 Use                       "             2.4        2.5        4.2
                  Total Use                "            17.9       18.0        0.6
                 Ending Stocks             "             4.3        3.8      -11.6
                 Stock to Use %            %            24.0       21.1      -12.1
                 Farm Price            cents/lb.        68.0       75.0       10.3

U.S. domestic mill use is projected at 2.5 million bales in 2021/22, slightly above 2020/21, as
U.S. textile mills are expected to recover more slowly to pre-pandemic levels than the leading
cotton spinning countries. Moderate growth in domestic demand and a rebound in semi-
processed textile and apparel product exports for finishing and shipping back to U.S. consumers
support the modest increase.

Exports are projected unchanged at 15.5 million bales, in line with the stable world trade level,
as the United States maintains a 35 percent share of world trade. While Brazilian exports are
expected to decline some from recent record levels, the United States will face additional
competition from much larger crops in Australia and as India’s remaining price-intervention
stocks become available to world markets.

Ending stocks are projected to decline and be at the lowest level in five years. At 3.8 million
bales, U.S. ending stocks in 2021/22 are expected to be 500,000 bales lower than during the year
before. Reduced stocks in the United States and in other countries outside of China are expected
to again reduce pressure on cotton prices in 2021/22, and the average price received by producers
is expected rise to 75 cents per pound, compared with the 2020/21 current forecast of 68 cents.
Appendix: China Cotton Policy and USDA Assumptions
Import Policy: Sliding Scale Quota Issued Starting in 2018
2018
Out-of-quota import duty is 40% ad valorem.
894,000 metric tons (MT) TRQ at 1% duty; calendar year basis, one-third
reserved for State Enterprises.
Sliding scale import licenses, 800,000 MT issued; valid Sept/18-Feb/19, but
licenses were not fully used.
Imports of U.S. cotton faced additional 25% duty starting in June; some
imports by State Enterprises and for processing exempt from additional duties.
Imports of foreign cotton by State Reserve.
2019
Out-of-quota duty, TRQ, and duty-free processing imports same as previous year.
Imports of U.S. cotton face additional 25% duty; some imports by State
Enterprises and for processing exempt from additional duties.
Imports of foreign cotton by State Reserve, but U.S. imports excluded.
Additional access provided; additional Sliding Scale quota of 800,000 tons
issued, but licenses were not fully used.
2020
Out-of-quota duty, TRQ, and duty-free processing imports same as previous year.
Imports of U.S. cotton face additional 25% duty; some imports by State
Enterprises and for processing exempt from additional duties. On Feb. 17,
2020 China announced procedures for other importers to apply for exemptions
from the additional duties.
Imports of foreign cotton by State Reserve.
Additional access provided; 400,000 MT issued September.
2021
Out-of-quota duty, TRQ, and duty-free processing imports same as previous year.
Updated Sliding Scale duty formula lowered expected duty payments around 2
percent.
Imports of U.S. cotton face additional 25% duty; some imports by State
Enterprises and for processing exempt from additional duties.
Large imports of foreign cotton by State Reserve, as high internal prices limit
domestic buying.
Additional access provided; additional Sliding Scale expected to be issued.
2022 Out-of-quota duty, TRQ, and duty-free processing imports same as previous year.
Imports of U.S. cotton face additional 25% duty; some imports by State
Enterprises and for processing exempt from additional duties.
Limited imports of foreign cotton by State Reserve expected.
Additional access provided; additional Sliding Scale expected to be issued.
State Reserve Policy:
2018
Sales from March 12 thru September 30, 2018.
Daily offers of 30,000 MT, 2.49 million MT sold, 58 percent of total amount
offered.
Offer price based on weekly average of internal price and A Index (same as 2016
and 2017).
Purchased 100,000-120,000 MT foreign cotton.
2019
Sales from May 5 thru September 30, 2019.
Daily offers of 30,000 MT, 998,500 MT sold, 91 percent of total amount offered.
Offer price based on weekly average of internal price and A Index (same as 2016,
2017, and 2018).
Purchased 200,000 MT foreign and 35,000 MT domestic cotton.
2020
Sales of 2012 and 2013 stocks.
Purchased 930,000 MT foreign and 330,000 MT domestic cotton
Daily offers of 30,000 MT, 504,000 MT sold.
Stock level at end of year roughly equal to that at beginning of 2018.
2021
Sales of 2012 and 2013 stocks.
Purchases primarily domestic cotton
Sales similar to previous year.
Stock level at end of year roughly equal to that at beginning of 2018.
Domestic Support Policy: Target Price Policy
2016/17 - 2019/20
Target price of 18,600 renminbi (RMB)/MT for Xinjiang.
Xinjiang subsidy level based on difference between target price and average pricereceived by gins during ginning period.
For inland farmers, subsidy equals lesser of 2,000 RMB/MT or 60 percent of
Xinjiang target price payments in given year.
Further shift to payments being linked to production rather than area.
Xinjiang yearly (2017-19) volume entitled for subsidy capped at 85 percent of
2012-14 average China cotton production. Some regions in Xinjiang have set
ceilings on seedcotton yield that can be attributed to individual farmers,
limiting ability of production from unregistered land to receive subsidy
payments.
Subsidy for long staple cotton at 1.3 times base rate.
2020/21
Xinjiang subsidy carried forward with same target price (no formal announcement
yet, no major changes expected).
Cotton subsidy to farmers in inland provinces eliminated.
2021/22
No formal announcement yet, no major changes expected.
Other Support for Cotton
High quality planting seeds subsidy.
Xinjiang transport subsidy: Subsidies are provided to transport cotton lint and
cotton containing yarn from Xinjiang to other regions.
Government support for spinning in Xinjiang: Government provides direct support
for spinning and for investment in spinning capacity in Xinjiang.You can also read