Third quarter 2016 - RenoNorden
←
→
Page content transcription
If your browser does not render page correctly, please read the page content below

Third quarter 2016
 Revenues of NOK 528.6 million in the quarter, an increase of 9.8 % year-over-year

 EBITDA for the quarter of NOK 87.0 million, down from NOK 95.0 million in the 3rd
 quarter 2015

 EBIT for the quarter of NOK 51.2 million, down from NOK 57.9 million in the same
 period last year

 Review and improvement of tender process completed

 Record high order backlog of NOK 7.5 billion

 Continued growth in
 revenues and order backlog,
 operational improvements
 ongoing

      RenoNorden is the Nordic region’s leading domestic waste collection and transportation company, providing
                              services to over five million people across four countries.

                                             www.renonorden.com
Numbers in NOK millions                           Q3 2016   Q3 2015 YTD 2016 YTD 2015   FY 2015

Operating revenues                                 528,6     481,3 1 463,3   1 338,2    1 808,4
EBITDA                                              87,0      95,0   196,0     232,3      291,2
EBITDA %                                          16,5 %    19,7 %  13,4 %    17,4 %     16,1 %
EBIT                                                51,2      57,9  -163,4     133,4      158,4
EBIT %                                             9,7 %    12,0 % -11,2 %    10,0 %      8,8 %
EBIT adjusted                                       46,7      57,9    82,0     133,4      158,4
EBIT adjusted %                                    8,8 %    12,0 %   5,6 %    10,0 %      8,8 %
Net income                                          38,4      34,0  -153,3      76,6       83,4
Earnings per share (NOK)                            1,41      1,25   -5,63      2,81       3,06
Earnings per share adjusted (NOK)                   1,29      1,25    1,99      2,81       3,06
Average number of shares outstanding (millions)     27,2      27,2    27,2      27,2       27,2

    2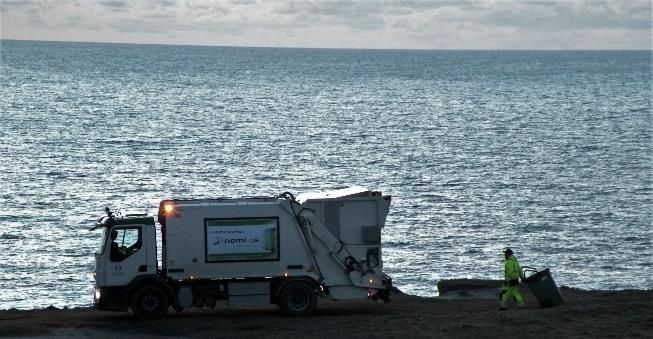
Growth in revenues and record order back                        Group EBITDA in the third quarter was NOK 87.0 million,
                                                                compared to NOK 95.0 million in the same period last year.
log achieved – operational improvements                         The EBITDA margin decreased to 16.5 %, compared to
ongoing                                                         19.7 % in the same period last year, mainly due to
                                                                replacement of high margin contracts by new lower margin
The growth in revenues from the first two quarters              contracts in Norway, operational challenges relating to late
continued into the third quarter. All segments except           delivery of trucks in Denmark and challenging contract
Norway showed increased revenues.                               start-ups in Sweden. On constant currency, the EBITDA
                                                                margin in the second quarter was 16.5 %. Accumulated
The order backlog of NOK 7.5 billion as per the end of q3       adjusted EBITDA was NOK 196.0 million, compared to
2016 is the highest ever. Despite being awarded 7 out of the    NOK 232.3 million last year. As for the quarter, the main
11 Stockholm contracts, these contracts are not included in     reasons for the decline in the year-to-date margin is related
the backlog until a final decision on the court appeal is       to the same issues.
obtained. This would represent an additional contract value
of approx. NOK 1 billion.                                       The previously reported severance payments to executive
                                                                managers have been renegotiated, leading to a positive
As previously reported, profitability in Norway continues to    effect of NOK 3.5 million in the accounts this quarter. No
be affected by a shift in the contract portfolio from expired   more costs will occur for former management.
high-margin contracts that have been replaced by lower
margin contracts.                                               Group EBIT for the period was NOK 51.2 million,
                                                                including NOK 4.4 million in reversal of previous provision
The previously reported delayed delivery of trucks in           for losses.
Denmark was solved during the quarter. The final deliveries
of trucks with the suitable equipment in place enable us to     Net financial items were NOK -4.6 million this quarter,
optimize routes on some of the contracts in Denmark. This       compared to NOK -15.8 million the same period last year.
will have a positive effect on the operation going forward.     Currency effects of NOK 4,9 million related to re-
We have not yet succeeded in reaching local tariff              evaluation of loans had a positive effect on net financial
agreements in two of the Danish contracts under                 items. Accumulated net financial items for the year to date
management, leading to higher personnel costs until an          were NOK -17.5 million, compared to NOK -35.7 million in
agreement is reached.                                           the corresponding period last year. Accumulated currency
                                                                effects from re-evaluation of loans had a positive effect of
Over the past months, RenoNorden has started up several         NOK 9.4 million.
new contracts according to plan. Some of the new contracts
have resulted in higher start-up costs than calculated, which   Net profit for the third quarter 2016 was NOK 38.4 million,
mainly has impacted the margin in Sweden in the 3rd             compared with NOK 34.0 million the same period last year.
quarter.                                                        Accumulated net profit year to date was NOK -153.3
                                                                million, compared to NOK 76.6 million in the
Due to the discovery of loss-making contracts in the            corresponding period last year.
previous quarter, internal procedures, routines and controls
relating to the tender process have been revised and            Cash flow from operations was NOK 71.8 million for the
strengthened. Ingrid Therese Tjøsvold, country head of the      quarter, compared to NOK 60.6 million the same period last
Norwegian operations, has been appointed as chief               year. Changes mainly related to higher activity in operations
operating officer for the group.                                this year. Accumulated cash flow year to date from
                                                                operations was NOK 109.3, compared to NOK 146.8
The award of the 11 Stockholm contracts has been                million last year.
postponed due to complaints from some of the participants.
The district court in Stockholm is expected to announce its     Net cash increase was NOK 29.1 million this quarter, and
judgement by the end of the year. We expect a delayed start-    negative NOK -46.9 million for the year to date. Net debt /
up of the new contracts in Stockholm, but in the meantime,      EBITDA ratio at the end of the quarter was 4.85x. This is
we expect an extension of the existing contract.                mainly due to investments in new trucks in Denmark.

Third quarter
Group operating revenues increased 9.8 % to
NOK 528.6 million in the third quarter 2016, compared to
NOK 481.3 million in the same period last year, of which
NOK 5.4 million was caused by currency impact. On
constant currency, revenues increased by 8.7 %.
Accumulated revenue for the year increased 9.3 % to NOK
1,463.3 million, compared to NOK 1,338.2 million last
year. The accumulated currency effect was NOK 62.8
million.

                                                                                                                              3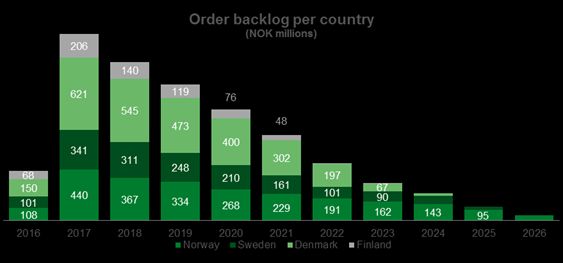
Order backlog

The order backlog on 30 September 2016 was NOK 7.5             Norway and Denmark have increased their order backlog
billion, consisting of NOK 5.0 billion in firm contracts and   with new contracts and several prolongations. Finland has a
NOK 2.5 billion in prolonging options. This is a net           stable backlog while Sweden has seen a decrease in the
increase of NOK 366 million compared to the order backlog      backlog. There are still appeals pending in the district court
presented as per the end of second quarter of 2016. During     regarding the second award of the Stockholm contracts,
the quarter, NOK 458 million of the previous backlog was       hence these are not included in the order backlog. The
turned into revenue and NOK 764 million was added to the       sizable overall backlog provides a strong platform for the
backlog for new contracts won in the quarter. The NOK has      development of the company.
strengthened and we are facing a negative currency effect of
NOK 22 million on the order backlog relative to the
previous quarter.

4
Norway

                              Q3       Q3       YTD      YTD   the increase are the new contracts in Linköping, Ängelholm,
(NOK millions)
                            2016     2015      2016     2015   Vimmerby, Uppsala and Stenungsund.
Operating revenue         154,4     160,6     437,2    466,8
EBITDA                      38,8     45,4     101,5    128,8   EBITDA in the second quarter was NOK 19.2 million,
EBIT                        30,0     34,0   -149,9      98,3   compared to NOK 25.4 million generated in the second
CAPEX                     -14,4      -0,2     -26,1    -49,9   quarter of 2015. The decrease of 24.5 % (25.1 % on
                                                               constant currency) is mainly due to higher than anticipated
Norway generated operating revenues for the quarter of         close-down and start-up costs in some contracts.
NOK 154.4 million, a decline of 3.9 % compared to the
same quarter last year. The main reason for the decline is     CAPEX in the quarter was NOK 17.2 million, mainly
the expired VESAR contract.                                    related to investments in trucks for the new contracts.

EBITDA in the second quarter was NOK 38.8 million,
compared to NOK 45.4 million in the same quarter last
year, reflecting an EBITDA decrease of 14.5 %. EBITDA          Finland
includes a positive effect of NOK 1.6 million from release
of previously accrued severance pay for a former manager                                     Q3       Q3       YTD        YTD
                                                               (NOK millions)
of the Norwegian operation.                                                                2016     2015      2016       2015
                                                               Operating revenue           79,7     73,3     229,4       197,7
CAPEX in the quarter was NOK 14.4 million, mainly              EBITDA                      13,9     12,0      29,1       25,7
related to trucks in Bergen.                                   EBIT                         6,8      5,2       9,2        9,1
                                                               CAPEX                      -16,4     -4,0     -42,8       -23,1

                                                               Finland generated operating revenues for the quarter of
Denmark                                                        NOK 79.7 million, an increase of 8.7 % compared to the
                                                               same quarter last year (6.9 % on constant currency). The
                              Q3       Q3       YTD      YTD   growth is mainly a result of the Rinki contract, with more
(NOK millions)
                            2016     2015      2016     2015   revenues than estimated, and several new smaller contracts.
Operating revenue         173,8     148,2     460,4    393,4
EBITDA                      18,3     16,6      35,5     38,0   EBITDA in the second quarter was NOK 13.9 million,
EBIT                         9,6      8,8     -20,2     15,7   compared to NOK 12.0 million in the same quarter last
CAPEX                     -47,2      -4,1   -132,2     -27,0   year. The increase of 15.4 % (13.6 % on constant currency)
                                                               mainly came from reduced use of subcontractors.
Denmark generated operating revenues for the quarter of
NOK 173.8 million, an increase of 17.3 % compared to the       CAPEX in the second quarter was NOK 16.4 million,
same quarter last year (15.1 % on constant currency). The      related to investment in trucks and compactors for the
main reasons for the increase are the new contracts in         Espoo, Tampere and Kuopio contracts.
Randers, Vejle and Copenhagen.

EBITDA in the second quarter was NOK 18.3 million,
compared to NOK 16.6 million in the same quarter last          Other
year. The increase of 9.8 % (7.8 % on constant currency)
was mainly driven by a good start-up of the new contract in                                  Q3       Q3       YTD        YTD
                                                               (NOK millions)
Copenhagen.                                                                                2016     2015      2016       2015
                                                               Operating revenue            0,0      0,0      -0,2        0,0
CAPEX in the second quarter was NOK 47.2 million,              EBITDA                      -3,1     -4,4     -21,3       -16,6
mainly related to new trucks in Copenhagen and Glostrup.       EBIT                        -3,1     -4,4     -21,3       -16,6
                                                               CAPEX                        0,0      0,0       0,0        0,0

                                                               The Other segment primarily contains administration costs
Sweden                                                         related to the group. EBITDA in the second quarter was
                                                               NOK -3.1 million compared to NOK -4.4 million same
                              Q3       Q3       YTD      YTD   quarter last year. This includes a partial reversal of
(NOK millions)
                            2016     2015      2016     2015   previously accrued severance pay of NOK 1.9 million for a
Operating revenue         120,7      99,2     336,5    280,3   former manager of the Group.
EBITDA                      19,2     25,4      51,2     56,4
EBIT                         7,9     14,2      18,7     26,9
CAPEX                     -17,2      -5,4     -62,2     -6,9

Sweden generated operating revenues for the quarter of
NOK 120.7 million, an increase of 21.7 % compared to last
year (20.8 % on constant currency). The main reasons for

                                                                                                                             5
Definitions of Alternative Performance
Measures
RenoNorden uses the following profit measures in the EBIT adjusted
quarterly statements:
EBIT excluding the line items “Impairment losses” and
EBITDA “Loss on onerous contracts”.
EBITDA is defined as Operating Profit excluding the line EPS adjusted
items “Depreciation and amortization”, “Impairment losses”
and “Loss on onerous contracts” according to the Statement EPS adjusted equals the Net Income excluding the line
of Comprehensive Income. items “Impairment losses” and “Loss on onerous contracts”
and adjusted for tax impact from the losses divided by the
EBIT number of shares outstanding during the third quarter.
EBIT equals the Operating Profit according to the Statement
of Comprehensive Income.
6Financials
Financial items Financial position and liquidity
Net financial items in the quarter were NOK -4.6 million, As of 30 September 2016, total assets amounted to NOK 2.3
compared to NOK -15.8 million in the same quarter last billion. Total equity was NOK 492.2 million, resulting in an
year. The total positive currency effect on net financial equity ratio of 21.1 %.
items was NOK 4.9 million.
In addition to bank loans, the group has guarantees of
Taxation approximately NOK 147 million as of 30 September 2016.
Cash and cash equivalents amounted to NOK 148.7 million,
RenoNorden had an estimated tax expense of NOK and the group has leasing facilities available for truck
8.2 million for the quarter compared to tax expenses of 8.1 financing.
last year.
As of 30 September 2016, net interest bearing debt
Consolidated cash flow amounted to NOK 1,237.4 million. Net debt/ EBITDA is
4.85x.
RenoNorden had a positive net change in cash and cash
equivalents of NOK 29.1 million in the quarter year-over- Risks and uncertainties
year.
RenoNorden’s risks and uncertainties are described in the
The cash generated from operations in the quarter was NOK Annual Report, which is available on
71.8 million compared to NOK 60.6 million in the same www.renonorden.com. No significant changes have taken
period last year. Changes mainly relate to higher activity in place that have altered the view of the risks and
operations. Accumulated figures for the year were NOK uncertainties.
109.3 million compared to NOK 146.8 million. The major
change was increased accounts receivables.
Net cash from investing activities was NOK -93.2 million in
the quarter compared to NOK -7.1 million in same quarter
last year. Accumulated figures for the year to date were
NOK -252.5 million compared to NOK -87.0 million in the
first three quarters last year.
Net cash from financing activities was positive NOK 54.8
million in the quarter compared to negative NOK -20.5
million in the same quarter last year. Accumulated figures
for the year to date were positive NOK 105.7 million
compared to negative NOK -126.5 million in the same
period last year.
7Outlook
Competition in major tenders remains strong, and we expect
Our operation has improved during third quarter with tighter this to continue going forward. We intend to continue to
cost control and better risk management relating to our offer quality services to our customers and our pricing will
tender activities. We expect the extra start-up costs in reflect required capex levels and cost of capital.
Sweden and the operational challenges in Denmark to
gradually improve. Actions to reduce price risk in future tenders have been
implemented. With improved risk assessments and
The contracts in Norway that were accounted for in the procedures, the company should continue to maintain
provision in the second quarter, which represent approx. competitiveness to win new public tenders at acceptable
NOK 830 million in revenues during their lifetime, will not margins.
bring any contribution to future operating profit.
Programs have been put in place to pursue continuous
Due to the market demand for more environmentally improvement in the daily operations, to improve efficiency,
friendly solutions, both trucks and compactors gets more reduce cost and ensure efficient start-up of new contracts.
sophisticated. This will over time drive capex per truck
higher. During the fourth quarter, we expect the district court of
Stockholm to announce its judgement on the complaints
To further build our position as the leading household waste regarding the award of the 11 contracts, of which
service provider, our key priorities will be continuous focus RenoNorden won 7.
on operational excellence, customer satisfaction and
professional bidding on new opportunities.
8th of November 2016
The Board of Directors and CEO of RenoNorden ASA
Erik Thorsen Penelope Kate Briant Charlotte G. Hansson
Chairman
Niklas Nikita Sloutski Markus Metyas Johan Eriksson
Ingvild Huseby Harald Rafdal
CEO
8RenoNorden’s specialist focus and pan-Nordic coverage coupled with operations based on strong local management have
proven successful. Our core values quality, respect, efficiency and environment guide our priorities. Today, tenders are
becoming more complex and the customers are requiring higher environmental standards in the contracts. RenoNorden works
with its customers to identify improvement areas and support their objectives to improve the environmental impact of waste
handling. Equally important is our ambition to conduct our business according to the highest professional, ethical and legal
standards. RenoNorden considers good corporate governance essential for sound sustainable business activities and key to
building trustworthiness, access to capital and value creation.
9Condensed Consolidated Interim Statement of Comprehensive Income
(Unaudited)
Q3 Q3 YTD YTD FY 2015
N O K 1,000 N ote
2016 2015 2016 2015 A udited
O perating revenues and expenses
Totaloperating revenue 2 528,627 481,343 1,463,251 1,338,213 1,808,359
Costofsales 47,464 46,655 136,878 128,551 178,806
Em ployee benefitexpense 282,087 247,705 808,378 700,625 956,278
D epreciation and am ortization 40,245 37,120 114,046 98,945 132,819
Im pairm entlosses 4 - 90,900
O theroperating expenses 112,091 91,992 321,967 276,741 382,028
Loss on onerous contracts 4 (4,448) 154,520
Totaloperating expenses 477,439 423,472 1,626,689 1,204,862 1,649,931
O perating profit 51,188 57,871 (163,438) 133,351 158,428
Financialitem s
Financialincom e 4,995 743 10,198 1,543 1,867
Financialexpense (9,574) (16,539) (27,717) (37,240) (49,941)
N et Financialitem s (4,579) (15,796) (17,519) (35,697) (48,074)
Profit before taxes 46,609 42,075 (180,957) 97,654 110,354
Incom e tax expense (8,174) (8,056) 27,662 (21,059) (26,932)
Profit for the period 38,435 34,019 (153,295) 76,595 83,422
O ther com prehensive incom e
Item s that m ay be subsequently
reclassified to profit or loss
Currency translation differences (8,142) 9,001 (15,321) 10,173 14,441
Totalcom prehensive incom e for the period 30,293 43,020 (168,616) 86,768 97,863
Earnings per share
Basic earnings pershare from profitforthe year(N O K) 1.41 1.25 (5.63) 2.81 3.06
D iluted earnings pershare from profitforthe year
1.41 1.25 (5.63) 2.81 3.06
(N O K)
The accom panying notes are an integralpart ofthe unaudited condensed consolidated interim financialstatem ents.
10Condensed Consolidated Interim Statement of Financial Positions (Unaudited)
31.12.2015
N O K 1,000 N ote 30.09.2016 30.09.2015
A udited
A ssets
N on-current assets
G oodw ill 4 923,004 1,017,339 1,017,942
O therintangibles 13,828 19,373 18,295
Equipm ent 899,980 753,021 810,958
Totalnon-current assets 1,836,812 1,789,733 1,847,195
Current assets
Inventory 6,824 7,588 7,522
A ccounts receivable 284,309 239,911 264,772
O therreceivables 53,103 56,434 29,465
Cash and cash equivalents 148,710 155,387 195,577
Totalcurrent assets 492,946 459,320 497,336
Totalassets 2,329,758 2,249,053 2,344,530
Equity and liabilities
Equity
Share capital 27,248 27,248 27,248
Share prem ium 501,445 501,445 501,445
Retained earnings (36,447) 171,209 182,305
Totalequity 492,246 699,902 710,998
N on-current liabilities
D eferred tax (1,358) 36,039 40,002
N on-currentprovisions 153,530
N on-currentfinance lease obligation 518,778 376,749 416,870
N on-currentliabilities to financialinstitutions 758,568 775,964 781,391
Totalnon-current liabilities 1,429,518 1,188,752 1,238,263
Current liabilities
Currentfinance lease obligation 105,196 60,404 87,490
A ccounts payable 75,802 82,799 80,843
Taxes payable 22,830 27,939 19,390
A ccrued public duties 67,647 55,839 63,758
O thercurrentliabilities 136,519 133,418 143,787
Totalcurrent liabilities 407,994 360,399 395,269
Totalliabilities 1,837,512 1,549,151 1,633,532
Totalequity and liabilities 2,329,758 2,249,053 2,344,530
The accom panying notes are an integralpart ofthe unaudited condensed consolidated interim financialstatem ents.
11Condensed Consolidated Statement of Changes in Equity (Unaudited)
Total
Share Retained
Share capital shareholders
prem ium earnings
N O K 1,000 equity
O pening shareholders Equity 01.01.2015 27,248 501,445 134,442 663,135
Profit/loss forthe period 76,595 76,595
D ividend paid (50,000) (50,000)
O thercom prehensive incom e/(loss)forthe period 10,173 10,173
Shareholder's equity 30.09.2015 27,248 501,445 171,209 699,902
O pening shareholders Equity 01.01.2016 27,248 501,445 182,305 710,998
Profit/loss forthe period (153,295) (153,295)
D ividend paid (50,136) (50,136)
O thercom prehensive incom e/(loss)forthe period (15,321) (15,321)
Shareholders'equity 30.09.2016 27,248 501,445 (36,447) 492,246
The accom panying notes are an integralpart ofthe unaudited condensed consolidated interim financialstatem ents.
12Condensed Consolidated Statement of Cash Flows (Unaudited)
Q3 Q3 YTD YTD FY 2015
N O K 1,000
2016 2015 2016 2015 A udited
Cash flow s from operating activities
Profitbefore incom e taxes 46 609 42 076 (180 957) 97 654 110 354
D epreciation and am ortization 40 245 37 120 114 046 98 945 132 819
Im pairm entloss - 90 900
(G ain)/Loss from sale ofequipm ent 1219 13 2 046 132 (369)
(Increase)/D ecrease in otheritem s
(7 832) (9 875) 115 029 (23 459) 6 011
related to operating activities
Interests received 517 660 752 1520 1867
Interests paid (8 613) (5 566) (24 503) (25 526) (36 324)
Taxes paid in the period (357) (3 854) (8 061) (2 478) (12 606)
N et cash generated from operating activities 71788 60 574 109 252 146 788 201752
Cash flow s from investing activities
Proceeds from sale ofequipm ent 1963 950 10 795 5 876 9 841
Purchase ofequipm ent (95 153) (8 029) (263 277) (82 365) (186 539)
Purchase ofsubsidiaries and otherbusiness,
- - - (10 502) (10 502)
netofcash acquired
N et cash used in investing activities (93 190) (7 079) (252 482) (86 991) (187 200)
Cash flow s from financing activities
N etincrease/decrease in currentliabilities to financial
- - - (89 106) (89 106)
institutions
N ew finance lease obligation 79 793 4 773 230 320 66 209 166 286
Repaym entoffinance lease obligation (25 041) (25 320) (74 513) (53 620) (69 377)
D ividend paid - - (50 136) (50 000) (50 000)
N et cash used in financing activities 54 752 (20 547) 105 671 (126 517) (42 197)
Foreign exchange effecton cash (4 205) 1910 (9 308) 2 465 3 580
N et change in cash and cash equivalents 29 145 34 858 (46 867) (64 255) (24 065)
Cash and cash equivalents atthe beginning ofthe
119 565 120 529 195 577 219 642 219 642
period
Cash and cash equivalents at the end ofthe period 148 710 155 387 148 710 155 387 195 577
13Notes Note 1. Accounting policies and judgments and estimates The Board of Directors of RenoNorden ASA approved these unaudited condensed consolidated interim financial statements on 8 November 2016. The unaudited condensed consolidated interim accounts are prepared in accordance with IAS 34 Interim Financial Reporting. The Group's accounting principles are presented in Note 2 Accounting policies in RenoNorden Group's IFRS Consolidated Financial Statements for the year ending 31 December 2015. The interim financial information should be read in conjunction with the RenoNorden Group 2015 IFRS Consolidated Financial Statements. There was no material effect on the unaudited condensed consolidated interim financial statements from the implementation in 2014 of new or amended IFRS standards or interpretations. New or amended IFRS standards or interpretations with implementation dates on or after 1 October 2016 are not expected to have a material effect on recognition and measurement in the Group consolidated financial statements, but may affect notes disclosures. Judgements and estimates The preparation of the interim financial information requires management to make judgements, estimates and assumptions that affect the application of accounting policies and the reported amounts of assets and liabilities, income and expense. Actual results may differ from these estimates. In preparing these condensed consolidated interim financial statements, the significant judgements made by management in applying the Group's accounting policies and the key sources of estimation uncertainty were the same as those that applied to the consolidated financial statements for the year ending 31 December 2015. Income tax expense is assessed based on annual results and, accordingly, determining the tax charge for the interim period involves making an estimate of the likely effective tax rate for the year for each material tax jurisdiction. The tax effect of 'one-off' items are not included in the estimated effective annual tax rate, but are recognized in the same period as the relevant 'one-off' item. Note 2. Segment information and seasonality RenoNorden Group identifies its reportable segments and discloses segment information under IFRS 8 Operating Segments. This standard requires RenoNorden Group to identify its segments according to the organization and reporting structure used by management. Management considers the business from both a geographic and a service perspective. Geographically, management considers the performance in Norway, Denmark, Sweden and Finland. From a service perspective, all geographic segments have municipal contracts and, additionally, Finland has specific corporate contracts. Management assesses the performance of the operating segments based on a measure of EBITDA and EBIT. This measurement basis excludes discontinued operations and the effects of non-recurring expenditures from the operating segments such as restructuring costs, legal expenses and goodwill impairments when the impairment is the result of an isolated, non-recurring event. The measure also excludes the effects of equity-settled share-based payments and unrealized gains/losses on financial instruments. The Group’s business is seasonal, and has historically realized a higher portion of its operating revenue and EBITDA in the second and third quarter of each year. This seasonality is a characteristic of the business in which it operates. During the warmer summer months, the Group increases the frequency of collection for biodegradable waste matter. Furthermore, the Group also collects from areas where holiday properties require additional collections in the summer holiday season. Note 2. Segment information and seasonality (continued) 14
Total operating revenue specified by segment:
                                                               Q3             Q3          YTD                  YTD         2015
NOK 1,000                                                    2016           2015         2016                 2015      Audited
Norway                                                 154   423      160   647      437 169            466   838      608 100
Sweden                                                 120   718       99   187      336 466            280   303      379 084
Denmark                                                173   775      148   179      460 407            393   395      546 832
Finland                                                 79   689       73   331      229 366            197   676      274 344
Other/Eliminations                                            22                        (157)
Total operating revenues                               528   627      481 344      1 463 251          1 338 212      1 808 359

EBITDA by segment:
                                                               Q3             Q3              YTD              YTD         2015
NOK 1,000                                                    2016           2015             2016             2015      Audited
Norway                                                  38   793       45   371       101    464        128   846      161 786
Sweden                                                  19   158       25   423        51    213         56   386       69 413
Denmark                                                 18   288       16   622        35    465         38   025       50 606
Finland                                                 13   853       11   998        29    145         25   687       34 894
Other                                                   (3   107)      (4   423)      (21    260)       (16   648)     (25 452)
Total EBITDA                                            86   985       94   991       196    027        232   296      291 247
Less depr & amort, impairment and loss on
onerous contracts                                       35 797         37 120         359 466            98 945        132 819
Operating income                                        51 188         57 871        (163 439)          133 351        158 428

CAPEX specified by segment:
                                                               Q3             Q3              YTD              YTD         2015
NOK 1,000                                                    2016           2015             2016             2015      Audited
Norway                                                  14   360            187        26    147         49   917       56 230
Sweden                                                  17   203        5   372        62    211          6   860       13 698
Denmark                                                 47   157        4   108       132    150         27   048       81 635
Finland                                                 15   859        4   000        42    770         23   103       34 977
Total CAPEX                                             94   579       13   667       263    278        106   928      186 540

Non-current operating assets specified by segment:
                                                                                                                     31.12.2015
NOK 1,000                                                                          30.09.2016         30.09.2015        Audited
Norway                                                                               240 696            248 994        244 355
Sweden                                                                               234 919            224 499        230 611
Denmark                                                                              321 218            201 305        248 502
Finland                                                                              103 146             78 223         87 489
Total equipment                                                                      899 979            753 021        810 958

Note 3. Bank borrowings and net debt

The Group’s bank borrowings consist of a term loan facility of NOK 620.0 million and an RCF facility of NOK 350.0
million. Both facilities are 5-year bullets.

In addition to the bank loans, the Group has guarantees of approximately NOK 147 million.

                                                                                              Carrying value
                                                                                                                      31.12.2015
N O K 1,000                                                                   30.09.2016            30.09.2015         A udited
N on-currentliabilities to financialinstitutions                                758,568               775,964            781,391
Capitalized origination fee                                                       3,556                 4,468              4,376
Totalbank borrow ings                                                           762,124               780,432          785,767

N on-current/currentfinance lease obligation                                      623,974               437,153        504,360
Cash and cash equivalents                                                          148,710             155,387          195,577
N et debt                                                                       1,237,388            1,062,198       1,094,550

On bank loan covenants RenoNorden ASA shall ensure that the adjusted leverage in respect of any relevant period shall not
exceed 5.00:1. In addition RenoNorden ASA shall ensure that the Interest Cover in respect of any relevant period shall not be
less than 4.00:1.

Note 4. Loss on onerous contracts and Impairment Goodwill

                                                                                                                             15
RenoNorden has decided to separate loss on onerous contracts and impairment of goodwill in the Consolidated Income
Statement, as specified below.
After a review of some of the contracts in the group, the company identified six onerous contracts in Norway and two
onerous contracts in Denmark according to IAS 37. The net losses were calculated based on best estimation of future income
and unavoidable costs (measured at discounted value) related to each contract. The contracts run for periods from five to ten
years, assuming that the municipalities exercise the options for prolongations. The loss include write down of assets related
to the contracts. Realized losses in Q3 are booked against the provision.
Following the provision for loss on contracts, the goodwill for all segments were tested for impairment. Goodwill for the
Norwegian segment was accordingly written off by NOK 90.9 million.
N O K 1,000 Profit before tax effect
Q 3 2016 Q 3 2015 YTD 2016 YTD 2015
Loss on contracts N orw ay 1,622 - -129,378 -
Loss on contracts D enm ark 2,827 -25,142
Im pairm entG oodw ill - -90,900
Total 4,449 - -245,420 -
NOK 1,000
Adj on cost Exchange
Goodwiill 30.9.2016 1 January Additions price Impairment difference 30 September
Norway 531 524 (90 900) 440 624
Sweden 175 000 175 000
Denmark 250 000 250 000
Finland 61 418 (4 038) 57 380
Total 1 017 942 - - (90 900) (4 038) 923 004
Note 5. Subsequent events
There are no subsequent events with material effect.
16Disclaimer
This report contains forward-looking statements that reflect RenoNorden’s current views with respect to future developments
and performance. These forward-looking statements may be identified by the use of forward-looking terminology, such as
the terms “anticipates”, “assumes”, “believes”, “can”, “could”, “estimates”, “expects”, “forecasts”, “intends”, “may”,
“might”, “plans”, “projects”, “should”, “will”, “would” or, in each case, their negative, or other variations or comparable
terminology. These forward-looking statements are not historic facts. The forward-looking statements are based upon various
assumptions, many of which are based, in turn, upon further assumptions, including without limitation, management’s
examination of historical operating trends, data contained in RenoNorden’s records and data available from third parties.
Although RenoNorden believes that these assumptions were reasonable when made, these assumptions are inherently subject
to significant known and unknown risks, uncertainties, contingencies and other important factors which are difficult or
impossible to predict and are beyond its control, and many factors can therefore lead to actual developments and performance
deviating substantially from what has been expressed or implied in such statements. Accordingly, no assurance can be given
with respect to such developments and performance. RenoNorden disclaims any obligation to update or revise any forward-
looking statements, unless required to do so by applicable law or listing rules.
www.renonorden.com
Financial calendar Investor contacts
Q4 2016 16.02.2017 Øystein Disch Olsrød – Group CFO
Q1 2017 09.05.2017 o.olsrod@renonorden.com
Q2 2017 16.08.2017 +47 916 02 226
Q3 2017 07.11.2017
Q4 2017 13.02.2018
17You can also read