Weekly Influenza and COVID-19 Surveillance graphs - GOV.UK
←
→
Page content transcription
If your browser does not render page correctly, please read the page content below
Weekly Influenza and COVID-19
                   Surveillance graphs
    PHE publishes a weekly national influenza and COVID-19 surveillance
    report which summaries the information from the surveillance systems
    which are used to monitor influenza, COVID-19 and other seasonal
    respiratory viruses in England.

    Additional figures based on these surveillance systems are included in this
    slide set.

    The figures presented in this slide set are based on data from week 26
    (between 28 June and 4 July 2021).

8 July 2021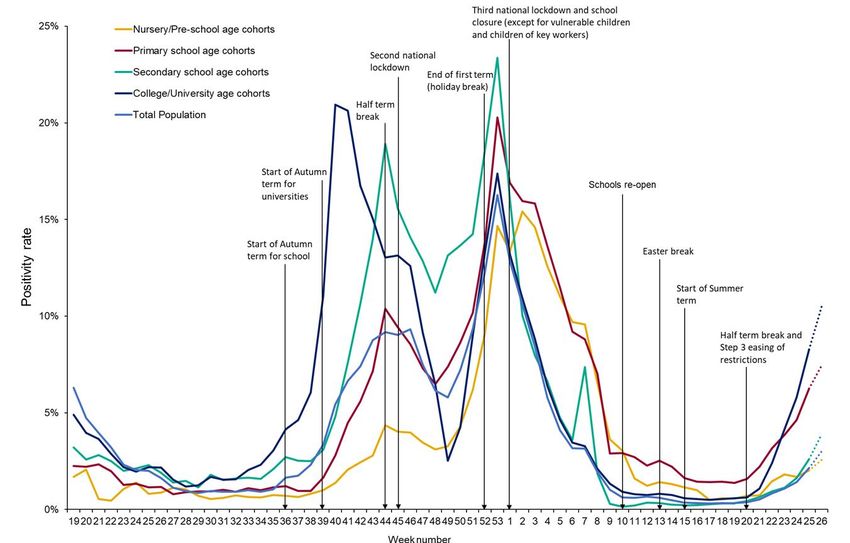
Confirmed COVID-19 cases in
                        England

8 July 2021                          Return to main menu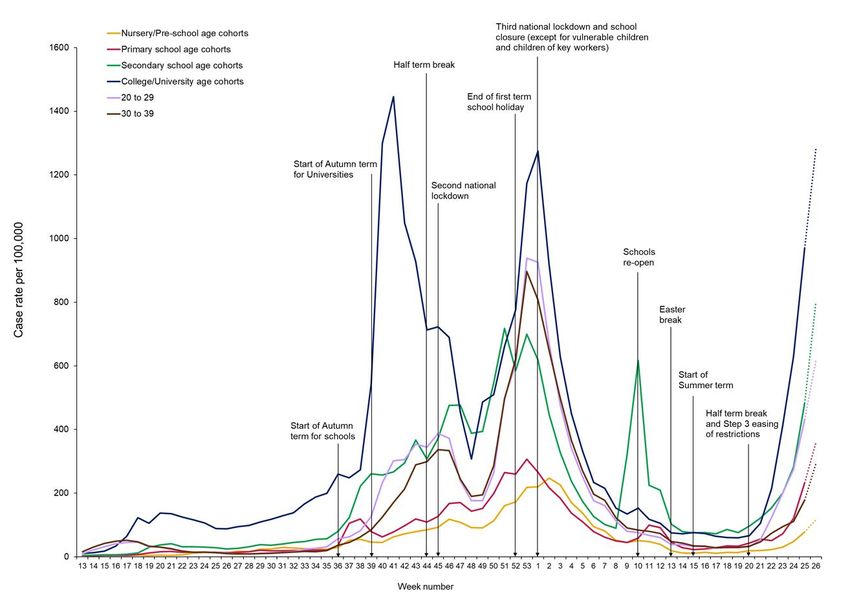
Weekly COVID-19 incidence per 100,000 population by age group and region,
              weeks 17 to 26

8 July 2021                                                            Return to main menu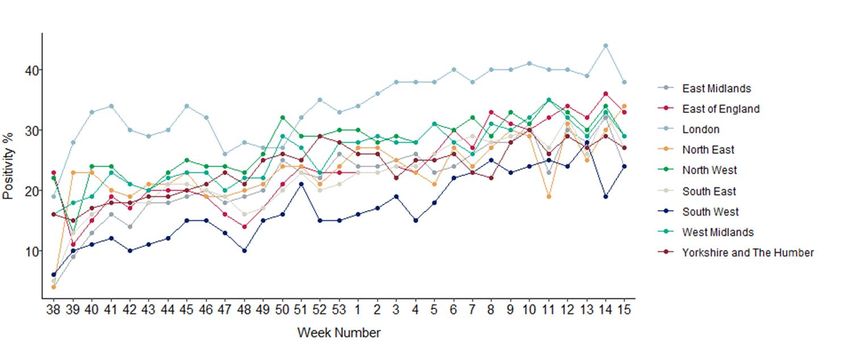
Weekly COVID-19 incidence per 100,000 population by ethnicity and region,
              weeks 17 to 26

8 July 2021                                                             Return to main menu
Weekly COVID-19 rate per 100,000 population by IMD quintile (1 being the
              most deprived and 5 being the least deprived), weeks 17 to 26

8 July 2021                                                            Return to main menu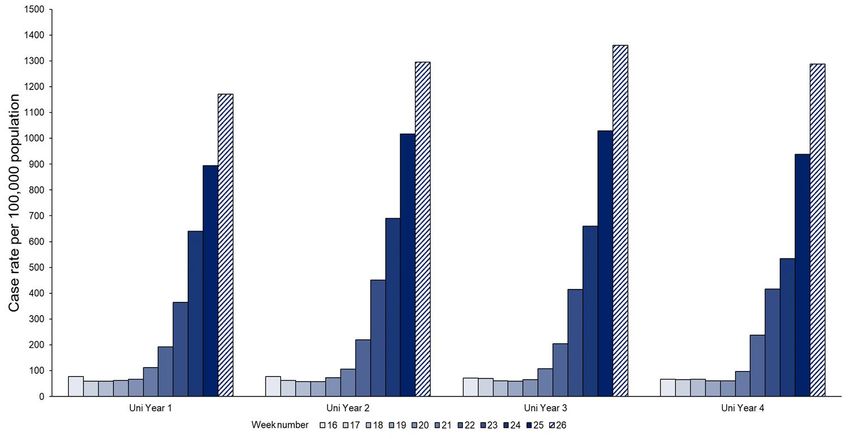
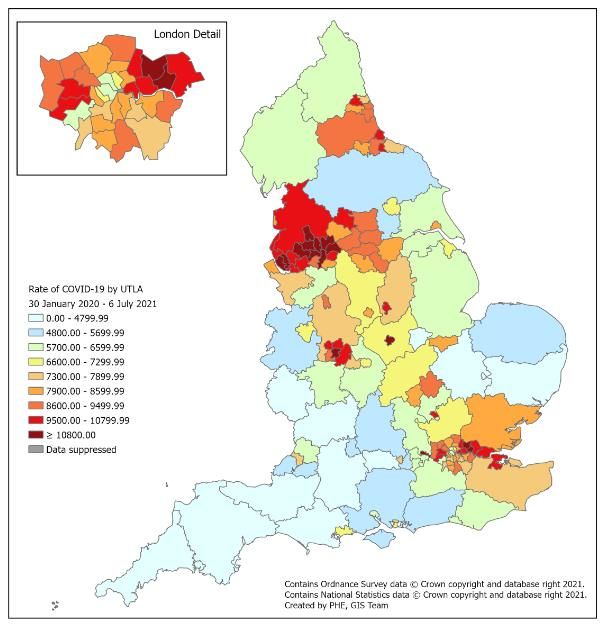
Cumulative rate of COVID-19 cases per 100,000 population tested under Pillar 1
              and 2, by upper-tier local authority, England (box shows enlarged map of London
              area)

8 July 2021                                                               Return to main menu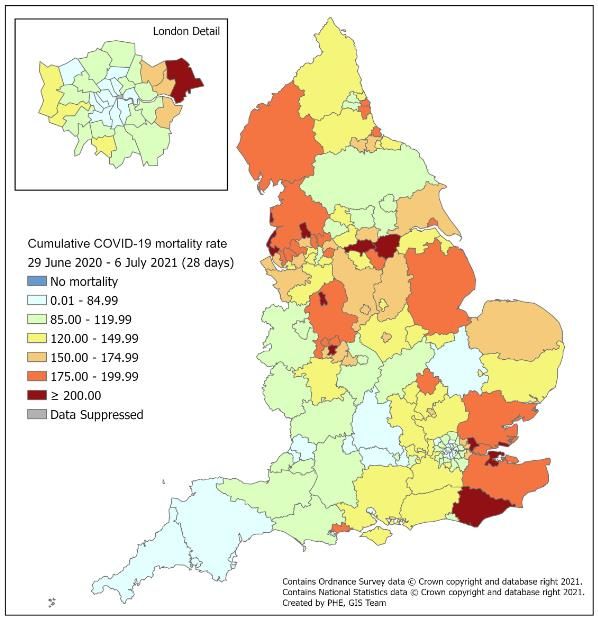
Cumulative rate (from week 27) of COVID-19 cases per 100,000 population
              tested under Pillar 1 and 2, by upper-tier local authority, England (box shows
              enlarged map of London area)

8 July 2021                                                                 Return to main menu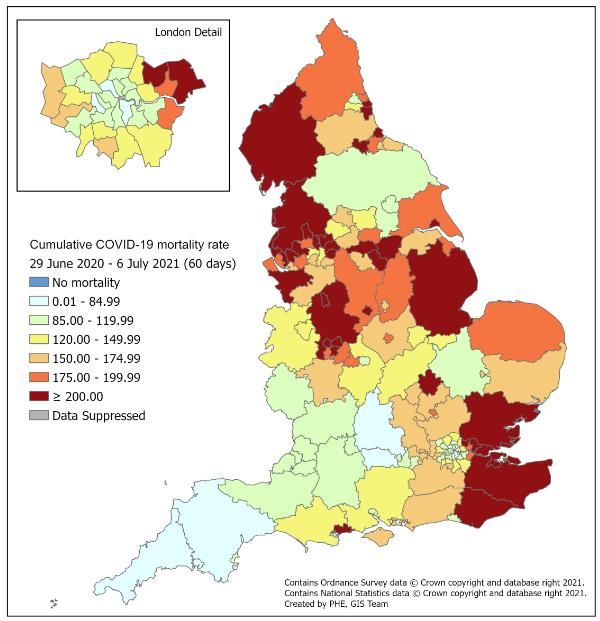
Weekly positivity of laboratory confirmed COVID-19 cases by reason for test,
                                  weeks 41 to 26

                         35

                         30

                         25
        Positivity (%)

                         20

                         15

                         10

                         5

                         0
                              41 42 43 44 45 46 47 48 49 50 51 52 53 1 2 3 4 5 6 7 8 9 10 11 12 13 14 15 16 17 18 19 20 21 22 23 24 25 26
                                                                             Week number

                                 Local council testing      Symptomatic Citizen         Symptomatic essential worker        Study

8 July 2021                                                                                                                Return to main menu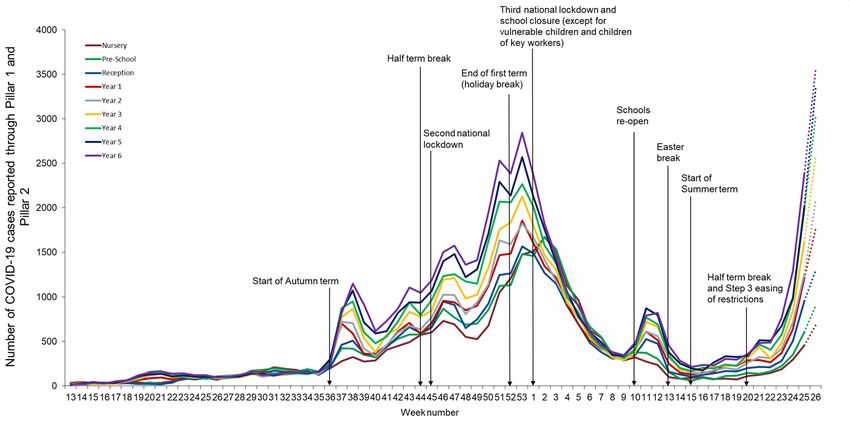
Respiratory Datamart system (England)

8 July 2021                         Return to main menu
Respiratory DataMart – Influenza subtypes

8 July 2021                                               Return to main menu
Respiratory DataMart – Respiratory syncytial virus (RSV)

                                                                          RSV
                                           100                                                   Positive samples         30

                                           90                                                    % 2018/19
              Number of positive samples

                                                                                                                          25
                                           80                                                    % 2019/20

                                           70                                                    % 2020/21

                                                                                                                               Proportion positive (%)
                                                                                                                          20
                                           60

                                           50                                                                             15

                                           40
                                                                                                                          10
                                           30

                                           20
                                                                                                                          5
                                           10

                                            0                                                                             0
                                                 27   31   35   39   43   47     51    3     7      11    15    19   23
                                                                               Week number

8 July 2021                                                                                                               Return to main menu
Respiratory DataMart – other respiratory viruses
Return to main menu
8 July 2021Community surveillance 8 July 2021 Return to main menu
COVID-19 clusters or outbreaks in educational settings

     Data Information
     • We report on new acute respiratory infection (ARI) incidents reported to Health Protection Teams (HPTs) and entered on
       HPZone in the previous reporting week in educational settings by locality
     • Individual case notes are reviewed by an epidemiologist and an assessment made about whether the criteria for a confirmed
       COVID-19 cluster or outbreak are met. See definitions below.
     • The incidents captured on HPZone represent a subset of all ongoing clusters and outbreaks in England. A variety of
       arrangements are in place with local authorities and other stakeholders supporting HPTs, however, data may not routinely be
       documented on HPZone. As a result, the number of outbreaks reported for some of the regions are underestimates

     Caveats
     • A national school helpline started operating on 17 September 2020 and a Universities helpline started operating on 7 October
       schools in England were closed for half-term during weeks 43 or/ and 44.
     • From Week 1 2021 the third national lockdown came into effect and schools were closed with the exception of vulnerable
       children and children of key workers. Early years settings have remained open.

     Definitions

      Cluster: two or more test-confirmed cases of COVID-19 among individuals associated with a specific non-residential setting with
     illness onset dates within a 14-day period (in the absence of detailed information about the type of contact between the cases).
      Outbreak: two or more test-confirmed cases of COVID-19 among individuals associated with a specific non-residential setting with
     illness onset dates within 14 days, and one of:
     • Identified direct exposure between at least 2 of the test-confirmed cases in that setting (for example under one metre face to
         face, or spending more than 15 minutes within 2 metres) during the infectious period of one of the cases.
     • When there is no sustained local community transmission - absence of an alternative source of infection outside the setting for
         the initially identified cases

8 July 2021                                                                                                   Return to main menu
Number of COVID-19 confirmed clusters or outbreaks by type of educational
setting, England
300
250
Nursery
Combined
Primary school
Number of ARI incidents
200
Secondary school
Special Educational Needs (SEN) schools
College/University
150
100
50
0
36 38 40 42 44 46 48 50 52 1 3 5 7 9 11 13 15 17 19 21 23 25
Date of report week
8 July 2021 Return to main menuCumulative number of confirmed COVID-19 clusters or outbreaks by type of
educational setting and PHE Centre since week 36, England
Special
Primary Secondary Educational College
PHE Centres Nursery Combined Total
School School Needs (SEN) University
schools
East of England 8 (0) 26 (1) 62 (4) 5 (4) 9 (0) 14 (0) 124 (9)
East Midlands 106 (2) 199 (3) 162 (14) 2 (0) 67 (4) 25 (0) 561 (23)
London 130 (0) 431 (27) 457 (31) 6 (2) 64 (2) 55 (2) 1143 (64)
North East 1 (0) 23 (0) 26 (0) 0 (0) 10 (0) 6 (0) 66 (0)
North West 40 (0) 112 (1) 128 (4) 2 (0) 61 (1) 22 (2) 365 (8)
South East 165 (1) 384 (31) 469 (27) 5 (2) 127 (4) 48 (4) 1198 (69)
South West 44 (2) 130 (16) 141 (16) 4 (1) 63 (2) 31 (0) 413 (37)
West Midlands 112 (3) 345 (16) 283 (17) 2 (0) 93 (3) 28 (1) 863 (40)
Yorkshire and Humber
119 (2) 261 (9) 186 (14) 4 (0) 86 (4) 28 (0) 684 (29)
Total 725 (10) 1911 (104) 1914 (127) 30 (9) 580 (20) 257 (9) 5417 (279)
*Number of outbreaks for Week 26 in brackets
8 July 2021 Return to main menuWeekly number of COVID-19 cases in NHS Test and Trace contact tracing data,
who reported attending educational settings
Data sources/definitions
1. The NHS Test & Trace contact tracing form asks individuals about their work or education settings. This report includes those who
selected: 'Attending childcare, school, education setting’ and selected an education setting of: 'Primary school’, 'Secondary school' or
'college' (counted together), 'University’.
2. Age was used to confirm that cases were likely to be students, using the following age ranges as inclusive cut-offs: Primary school: 4 to
12 years old Secondary school college: 11 to 19 years old University: 16 years and above
3. Student cases may not be recorded if 'work and education' was selected rather than 'Attending childcare, school, education setting’
Approximately 1% of primary, secondary, and college cases may be underreported because of this, and 4% of university cases.
4. Weeks are defined using ISO-8601, meaning Week 1 starts Monday January 4th and ends Sunday January 10th, 2021.
5. Percentages in charts = percent of all cases (people who tested positive and were referred for contact tracing) for that week, this
includes cases which may not have completed the forms and entered work or education settings.
6. The data starts 23 October 2020, when education settings started to be recorded in the present format, and ends with the most recent
complete week.
7. Cases are assigned to dates by the date they were transferred to the NHS Test and Trace contact tracing system.
8. If a case reports being in education, this does not specify that they attended the setting in person during the time that they were
exposed/infectious (for example they may have been remote learning). In addition, cases that did attend in person may have been
exposed in other settings, such as their household or while doing other activities. This data can not be used to directly infer that these
cases acquired their infection, or that they exposed others, in an the education setting.
8 July 2021 Return to main menuNumber of people testing positive that reported attending primary school
and proportion among all people testing positive (weeks 43 to 26)
(Data source: NHS Test and Trace)
8 July 2021 Return to main menuNumber of people testing positive that reported attending secondary school and
proportion among all people testing positive (weeks 43 to 26)
(Data source: NHS Test and Trace)
8 July 2021 Return to main menuNumber of people testing positive that reported attending university and
proportion among all people testing positive (weeks 43 to 26)
(Data source: NHS Test and Trace)
8 July 2021 Return to main menuContacts by exposure/activity setting in week 26, England
(Data source: NHS Test and Trace)
Household
Unknown
Household visitor
Leisure/community
Other workplace
Visiting friends/relatives
Education
Other activity
Travel
Personal services
Shops
Working in healthcare
Social care or home care
Health care
Prison / detention facility
0 30000 60000 90000 120000 150000 180000 210000 240000
Number of contacts
Note: categories have been grouped as follows: leisure / community includes eating out, attending events and celebrations, exercising, worship, arts,
entertainment or recreation, community activities and attending play groups or organised trips; other workplace includes: retail, manufacturing or
construction, hospitality, transport, emergency services or border force, food production and agriculture, prison, financial services, civil service or local
government, information and communication, military, critical national infrastructure.
Personal services include hairdressers, barbers, tattooists and nail bars.
8 July 2021 Return to main menuEvents and activities reported by people testing positive, prior to symptom
onset in week 26, England
(Data source: NHS Test and Trace)
Attending childcare educational setting
Other (combined)
Eating Out
Shopping
Exercising
Entertainment and day trips Activity event
Other occupational sector Household event
Hospitality
Other Work or education
Visiting friends or relatives event
Living alone or with family
Travel and commuting
Holiday
Manufacturing or construction
Retail sector
Teaching and education
0 2000 4000 6000 8000 10000 12000 14000 16000 18000 20000 22000
Number of reports
Note: ‘Other’ includes a wide range of different activities and settings, each of which has small numbers of individuals, as well as activities which did not fit any
specific category and were added as Other by the case. This includes: all within ‘activities’: Arts, entertainment or recreation; Civil service or government; Close
contact services; Community and charity activities; Critical national infrastructure; Emergency services; Financial services; Food production; Hospitality; Immigration
border services; Information and communication; Military; Personal care; Prison; Private events and celebrations; Public events and mass gathering; event within a
shared household; Sport events; Supported living; Teaching and education; Transport; ‘Other (combined)’ includes all exposure group types that have small counts
such as “went to church”, “went to the zoo” within that event type.
8 July 2021 Return to main menuSurveillance in ‘educational-age’
cohorts
8 July 2021 Return to main menuMethodology and limitations
• Data source: SGSS Pillar 1 (NHS and PHE testing) and Pillar 2 (community testing) – England
• Educational-age cohorts have been calculated using dates of birth that correspond to a particular
year group. School year groups run from 1 September to 31 of August of the following calendar
year.
• We include all cases regardless of whether or not they attended an educational setting or whether
or not the educational setting was open during the reporting period
• Data for the most recent week are provisional and likely to be an underestimate
• From early December 2020 a mass testing programme has been rolled out in Higher Education
Institutions using Lateral Flow Devices ahead of students returning home for the Christmas break.
This will impact testing trends and positivity data during this period.
• From January 2021 a mass testing programme using Lateral Flow Devices has been gradually
rolled out among teachers and secondary school students ahead of students returning to school
on the 8 March. This has impacted testing trends and positivity data reported from the end of
February onwards, particularly in the secondary school-aged cohorts.
8 July 2021 Return to main menuMethodology and limitations - Birth cohort – Year group
Birth cohort Year group
• The table aside represents the birth cohorts for each 01/09/1998 to 31/08/1999 Uni Year 4
year group 01/09/1999 to 31/08/2000 Uni Year 3
01/09/2000 to 31/08/2001 Uni Year 2
01/09/2001 to 31/08/2002 Uni Year 1
01/09/2002 to 31/08/2003 Year 13
01/09/2003 to 31/08/2004 Year 12
01/09/2004 to 31/08/2005 Year 11
01/09/2005 to 31/08/2006 Year 10
01/09/2006 to 31/08/2007 Year 9
01/09/2007 to 31/08/2008 Year 8
01/09/2008 to 31/08/2009 Year 7
01/09/2009 to 31/08/2010 Year 6
01/09/2010 to 31/08/2011 Year 5
01/09/2011 to 31/08/2012 Year 4
01/09/2012 to 31/08/2013 Year 3
01/09/2013 to 31/08/2014 Year 2
01/09/2014 to 31/08/2015 Year 1
01/09/2015 to 31/08/2016 Reception
01/09/2016 to 31/08/2017 Pre-school
01/09/2017 to 31/08/2018 Nursery
8 July 2021 Return to main menuWeekly number of laboratory confirmed COVID-19 cases in nursery/preschool,
primary, secondary and college/university age cohorts
8 July 2021 Return to main menuWeekly incidence of laboratory confirmed COVID-19 cases per 100,000
population in nursery/preschool, primary school, secondary school and
college/university age cohorts
8 July 2021 Return to main menuWeekly incidence of laboratory confirmed COVID-19 cases per 100,000
population in educational age cohorts presented by Year group, from nursery
to Year 6, weeks 16 to 26
8 July 2021 Return to main menuWeekly incidence of laboratory confirmed COVID-19 cases per 100,000
population in educational age groups presented by secondary school year
groups (Year 7 to Year 13), weeks 16 to 26
8 July 2021 Return to main menuWeekly incidence of laboratory confirmed COVID-19 cases per 100,000
population in educational age cohorts corresponding to university/college year
groups, weeks 16 to 26
8 July 2021 Return to main menuWeekly incidence of laboratory confirmed COVID-19 cases per 100,000
population by educational age cohorts and PHE region, weeks 16 to 26
8 July 2021 Return to main menuWeekly number of new laboratory confirmed COVID-19 cases in educational
age cohorts presented by Year group, from nursery to Year 6, weeks 16 to 26
8 July 2021 Return to main menuWeekly number of new laboratory confirmed COVID-19 cases in educational
age cohorts presented by Year group, from nursery to Year 6
8 July 2021 Return to main menuWeekly number of new laboratory confirmed COVID-19 cases in educational
age groups presented by secondary school year groups (Year 7 to Year 13),
weeks 16 to 26
8 July 2021 Return to main menuWeekly number of new laboratory confirmed COVID-19 cases in educational
age groups presented by secondary school year groups (Year 7 to Year 13)
8 July 2021 Return to main menuWeekly number of new laboratory confirmed COVID-19 cases in
educational age cohorts corresponding to university/college year groups,
weeks 16 to 26
8 July 2021 Return to main menuWeekly number of new laboratory confirmed COVID-19 cases in educational
age cohorts corresponding to university/college year groups
8 July 2021 Return to main menuWeekly number of new laboratory confirmed COVID-19 cases by educational
age cohorts and PHE region, weeks 16 to 26
8 July 2021 Return to main menuWeekly positivity rates of confirmed COVID-19 cases in educational age cohorts
presented by Year group, from nursery to Year 6, weeks 16 to 26
8 July 2021 Return to main menuWeekly positivity rates of confirmed COVID-19 cases in educational age cohorts
presented by secondary school year group (Year 7 to Year 13), weeks 16 to 26
8 July 2021 Return to main menuWeekly positivity rates of confirmed COVID-19 cases in educational age cohorts
corresponding to university/college year groups, weeks 16 to 26
8 July 2021 Return to main menuWeekly positivity rates of confirmed COVID-19 cases, in nursery/preschool,
primary school, secondary school and college/University age cohorts
• From January 2021 a programme of rapid asymptomatic testing was rolled out to students in the secondary school aged cohorts attending these settings during lockdown. We note
a drop in the number of tests conducted in these cohorts and an increase in positivity during week 7 which coincides with half term break.
• Lateral flow device testing of secondary aged pupils in a supervised environment from week 8
8 July 2021 Return to main menuWeekly rate of new COVID-19 tests performed per 100,000 population in
nursery/preschool, primary school, secondary school and college/University age
cohorts
• From January 2021 a programme of rapid asymptomatic testing was rolled out to students in the secondary school aged cohorts attending these settings during lockdown. We note a
drop in the number of tests conducted in these cohorts and an increase in positivity during week 7 which coincides with half term break.
• Lateral flow device testing of secondary aged pupils in a supervised environment from week 8
8 July 2021 Return to main menuSecondary Care surveillance 8 July 2021 Return to main menu
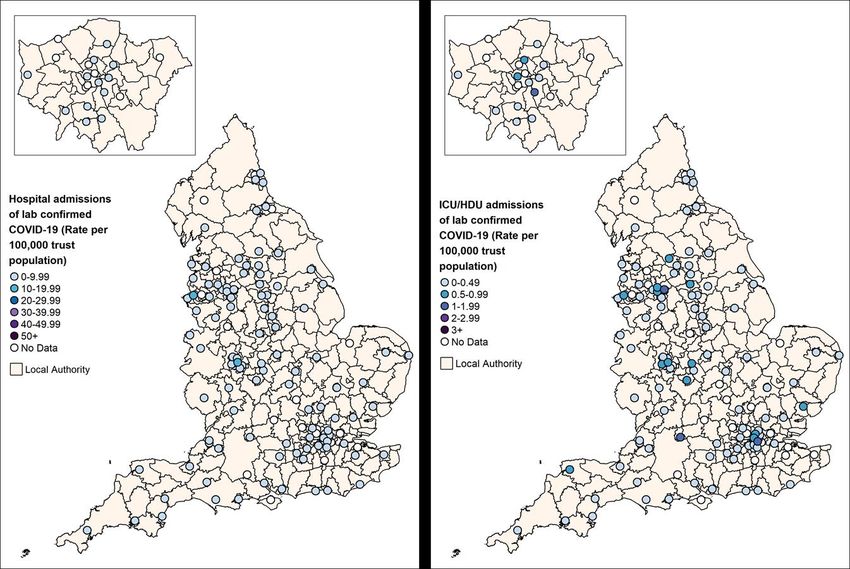
Weekly overall hospital and ICU/HDU admission rates per 100,000 of new COVID-
                                            19 positive cases reported through SARI Watch, England since week 12 2020

                                        40.00                                                                            COVID-19 hospital admission
                                                                                                                         rate
                                        35.00
                                                                                                                         COVID-19 ICU/HDU admission
                                                                                                                         rate
                                        30.00
         Admission rate (per 100,000)

                                        25.00

                                        20.00

                                        15.00

                                        10.00

                                         5.00

                                         0.00
                                                12 14 16 18 20 22 24 26 28 30 32 34 36 38 40 42 44 46 48 50 52 1 3 5 7 9 11 13 15 17 19 21 23 25
                                                                                          Week number

8 July 2021                                                                                                                       Return to main menu
Weekly admission rates for hospital and ICU/HDU laboratory confirmed
COVID-19 cases reported through SARI Watch, week 26
Due to the decreasing incidence of COVID-19, hospitalisation rates are now low and majority fall in the lowest rate bands. Small variation is
expected from week to week although close monitoring of trusts continues.
8 July 2021 Return to main menuAge/sex pyramid of new (a) hospital (lower level of care) (n=38,887) and (b)
ICU/HDU (n=17,444) COVID-19 cases reported through SARI Watch, England
(a) (b)
Male Female Male Female
80+ y 80+ y
70-79y 70-79y
60-69y 60-69y
50-59y 50-59y
Age group
Age group
40-49y 40-49y
30-39y 30-39y
20-29y 20-29y
10-19y 10-19y
5-9y 5-9yEthnic group of new hospitalisations (lower level of care) (n=36,920) and ICU/HDU
(n=16,003) COVID-19 cases reported through SARI Watch, England
84.8
White
69.8
8.8
Asian / Asian British
17.4
Black / African / Caribbean / Black 4.7
British 8.9
0.8
Mixed / Multiple ethnic groups
1.6 Hospitalisations
0.9
Other ethnic group ICU/HDU
2.2
proportion of admitted cases (%)
This figure is based on individual patient level data which are provided to SARI Watch from a subset of NHS Acute Trusts, therefore the data should be
interpreted with caution as the distribution of age, sex and ethnic group may not be representative of all hospitalised patients.
Caveat: From week 24 the ethnicity analysis is based on a new method for assigning ethnicity, developed by PHE. The previous method used the most
recent ethnicity recorded through linkage to Hospital Episode Statistics. However, this method led to unfeasibly high rates in the ‘Other’ ethnic group
when applied to COVID-19 cases, hospitalisation or mortality. The new method uses the most frequent ethnicity recorded through linkage to Hospital
Episode Statistics, unless the most frequent was ‘Other’ when the second most frequent was chosen.
8 July 2021 Return to main menuWeekly COVID-19 hospitalisation rate per 100,000 trust catchment population by
age group and region, weeks 17 to 26
8 July 2021 Return to main menuHospital admission rate (excluding ICU/HDU) by ethnicity per 100,000 trust
catchment population
70.00
Per 100,000 Ethnicity-specific Trust Catchment Population
60.00
50.00
40.00
30.00
20.00
10.00
0.00
12 14 16 18 20 22 24 26 28 30 32 34 36 38 40 42 44 46 48 50 52 1 3 5 7 9 11 13 15 17 19 21 23 25
Week Number
White Asian Black Mixed Other
Caveat: From week 24 the ethnicity analysis is based on a new method for assigning ethnicity, developed by PHE. The previous method used the most recent ethnicity
recorded through linkage to Hospital Episode Statistics. However, this method led to unfeasibly high rates in the ‘Other’ ethnic group when applied to COVID-19 cases,
hospitalisation or mortality. The new method uses the most frequent ethnicity recorded through linkage to Hospital Episode Statistics, unless the most frequent was
‘Other’ when the second most frequent was chosen.
8 July 2021 Return to main menuRate of admission to ICU/HDU by ethnicity, per 100,000 trust catchment
population
16.00
Per 100,000 Ethnicity-specific Trust Catchment Population
14.00
12.00
10.00
8.00
6.00
4.00
2.00
0.00
12 14 16 18 20 22 24 26 28 30 32 34 36 38 40 42 44 46 48 50 52 1 3 5 7 9 11 13 15 17 19 21 23 25
Week Number
White Asian Black Mixed Other
Caveat: From week 24 the ethnicity analysis is based on a new method for assigning ethnicity, developed by PHE. The previous method used the most recent ethnicity
recorded through linkage to Hospital Episode Statistics. However, this method led to unfeasibly high rates in the ‘Other’ ethnic group when applied to COVID-19 cases,
hospitalisation or mortality. The new method uses the most frequent ethnicity recorded through linkage to Hospital Episode Statistics, unless the most frequent was
‘Other’ when the second most frequent was chosen.
8 July 2021 Return to main menuMortality surveillance 8 July 2021 Return to main menu
Number of deaths since week 10 2020 by week of death and time since laboratory
                                 confirmation of COVID-19, England

                       10000
                                                                28 day definition (N = 112,796)

                       9000                                     60 day definition (N = 131,090)

                       8000

                       7000
    Number of deaths

                       6000

                       5000

                       4000

                       3000

                       2000

                       1000

                          0
                               10 12 14 16 18 20 22 24 26 28 30 32 34 36 38 40 42 44 46 48 50 52 1 3 5 7 9 11 13 15 17 19 21 23 25
                                                                             Week of death

8 July 2021                                                                                                    Return to main menu
Cumulative mortality rate of COVID-19 cases per 100,000 population tested under
Pillar 1 and 2 since week 27 by (a) 28 day definition and (b) 60 day definition
(a) (b)
8 July 2021 Return to main menuAge-adjusted mortality rate** (per 100,000 population) in laboratory-confirmed
cases of COVID-19 by IMD quintile, from week 27 onwards, by week using the 60
day definition
900
800
700
Rate (100,000 population)
600
500
400
300
200
100
0
27 29 31 33 35 37 39 41 43 45 47 49 51 53 2 4 6 8 10 12 14 16 18 20 22 24 26
Week of Death
1 2 3 4 5
**Rates are time-adjusted: a weekly population denominator has been used to calculate the mortality rate
8 July 2021Possible reinfections in England
(updated monthly)
8 July 2021 Return to main menuPossible reinfections in England
The following figures present population data based on the first time that individuals tested positive for SARS-CoV-2
through PCR and/ or lateral flow device testing in England together with those who have tested positive for SARS-CoV-
2 through PCR and/ or lateral flow testing with an interval of at least 90 days between two consecutive positive tests.
This excludes positive LFD test results removed from the main SGSS dataset because the LFD test positive result was
followed by a negative PCR result within 3 days and LFD test results where we have had feedback that a positive result
was entered in error. The interval of 90 days is in line with the definition currently adopted within Siren, by CDC in
their definition of a person to prioritise for investigation of suspected SARS-CoV-2 reinfection and the draft definition
being considered by the World Health Organisation for a suspected reinfection.
These figures present population level data that complements studies that can undertake more detailed investigation
at an individual level as exemplified by SIREN the large multicentre prospective cohort study that has followed around
45,000 participants employed by NHS hospitals. In line with other studies, this suggested that those with serological
evidence of a previous SARS_CoV-2 infection had an 84% lower risk of infection than those without evidence of prior
infection over a median 7-month period.
For a possible reinfection to be categorised as confirmed they require sequencing of a specimen at each episode and
for the second specimen to be genetically distinct from that sequenced from the first episode. Availability of such dual
sequencing is currently very low for several reasons; sequencing was not widely undertaken early in the pandemic;
LFD test results do not allow sequencing and some PCR samples have a low viral load where sequencing cannot be
undertaken. To meet the definition of a probable reinfection requires sequencing at the second episode that identifies
a variant that was not circulating at the time of the first episode.
Further data on reinfections is published in the weekly Influenza and COVID-19 surveillance report.
8 July 2021 Return to main menuPossible reinfections in England
Table summarising different categories of COVID-19 infection with relevant numbers generated by ongoing analysis
in England to 30th May 2021 (end week 2021-22)
Infection type Definition Current
totals
Primary infection/ first the first positive PCR/ LFD test result for an 3.9 million
positive individual first
positives
Possible reinfection identified based on two sequential positive 15,893
test results (PCR or LFD) at least 90 days apart possible
reinfections
Probable reinfection where only reinfection sample is available, and 478
this is congruent with contemporaneous classified as
phylogeny OR the second event identifies a probable*
variant which was not in circulation at the time
of first infection
Confirmed reinfection sequencing of a specimen at each episode of a 53
possible reinfection with the second specimen confirmed
genetically distinct from that sequenced at first reinfections*
episode
Persistent infection Nominally repeat test positives at between 14 Unquantified
andPossible reinfections in England
*These data have been derived independently based on P1 and P2 datasets and may therefore differ to previously published data.
It is important to consider reinfections in the context of first infections and there is a 90-day delay before people with a first infection can
become eligible for reinfection. The following graph shows: weekly rates of possible reinfections per 1000 first infections based on a cumulative
denominator derived from total individuals with a first SARS-CoV-2 positive test result at a point 13 weeks (91 days) before the second positive
test result together with the cumulative total of first infections (secondary Y-axis) and total first infections (secondary Y-axis) by week of onset
8 July 2021 Return to main menuCOVID-19 antibody test results
NHS & Commercial Laboratories
8 July 2021 Return to main menuSeropositivity among individuals tested for COVID-19 antibodies Seropositivity is now being reported using the results of COVID-19 antibody tests (IgG or total (IgM and IgG combined) lab-based immune -assay) undertaken in NHS and commercial laboratories (Thriva) contracted by NHS Test and Trace (TT) as part of the national testing strategy. Assays used by laboratories test for antibody responses to SARS-CoV2, where the nucleoprotein (N) assays can only detect post-infection antibodies, while the spike (S) assays are expected to detect both post-infection antibodies and vaccine induced antibodies. Antibody testing has been offered exclusively to healthcare and social care professionals in England, and other key worker groups across the Devolved Administrations. NHS antibody testing was also made available to some patients following recovery from acute disease. NHS laboratories introduced antibody testing, which requires a venous blood sample, in May 2020 for all NHS staff and patients, with an extension of the test offer to wider health and social care staff from July 2020. Multiple manufacturers provide the antibody testing platforms in the NHS. The possible variability of antibody assays being used within NHS laboratories means differentiating antibody detection due to a past infection rather than vaccine is currently difficult post the introduction of the vaccine. The NHS TT home-sampling tests, provided by Thriva, which uses a capillary blood sample analysed in a laboratory became routinely available in mid- September 2020 (week 38). Initially an additional testing offer for social care staff, the NHS TT kit is now the main antibody test offered to social care staff and is also available to those working in healthcare. Thriva currently use a Roche antibody test for the SARS-CoV N protein only identifying those with a past infection. Overall, the cohort breakdown of NHS testing between May and December of 2020 as reported by NHS E*, 25% were patients, 72% NHS staff and 3% social care staff . The proportions have changed over time in 2020 but are now stable: Of the 366,784 and 65,603 tests conducted through NHS testing in July and December respectively, the proportion of tests performed in patients increased from 26% in July to 56% in December; where the proportion of tests in NHS staff decreased from 72% in July to 43% in December; and the highest proportion of social care staff tested were tested in August (12%) and September (16%). For TT testing overall at the beginning of 2021, 52.5% reported their industry as social care and 47.5% reported their industry as health. However, the weekly number of TT tests is variable and will be dependent on a range of factors including changes in demand for the service. The graphs that follow show the number of SARS-CoV-2 antibodies (Ab) tests among individuals and the percentage positive (Ab test positivity) for TT testing by week, region and age. Although NHS laboratories continue to provide antibody testing, data are only presented for TT due to the potential inconsistencies with antibody levels in the data received from NHS laboratories following the vaccine rollout. As antibody testing is largely occurring in health and social care staff (and some patients who have recovered from COVID-19), who are likely to have higher COVID-19 exposures than the general population, these antibody test results are not generalisable to the general population. * The cohort breakdown of testing through NHS laboratories was reported from NHS E, these data may differ from those reported from PHE SGSS. 8 July 2021 Return to main menu
Seropositivity among individuals tested for COVID-19 antibodies by week

    Following the introduction of TT testing in week 38, 291,057 tests have been carried out, with a transient increase between
    weeks 40-42 of 2020 following the initial introduction of TT testing. The proportion of positive tests for TT tests increases
    overtime consistent with the blood donor seroprevalence data and reflecting previous SARS-CoV2 infection. By the end of 2020,
    25% of tests conducted by TT were positive for SARS-CoV2, with the proportion positive in week 16 of 2021 for TT increasing to
    27%. The higher positivity from TT antibody testing, when compared to population weighted seroprevalence surveys, is to be
    expected given that these tests largely represent health and social care staff who are more likely to be exposed to SARS-CoV-2.
    Seropositivity is likely to reflect transmission occurring in the previous 2-3 weeks or more.

          Bars represent number of tests; points represent positivity. Positivity shown where number of tests >100.

8 July 2021                                                                                                           Return to main menu
Seropositivity among individuals (aged 20-69 years) tested for COVID-19
antibodies by region for test and trace tests (Thriva)
The graphs below demonstrates the distribution of TT tests by region (introduced mid-September 2020 (week 38)) and the
percentage of tests positive for COVID-19 antibodies within each region. Overall, seropositivity was highest in London (34%),
followed by the North West (26%). Seropositivity was lowest in the South West (14%). This geographical pattern is broadly
consistent with previous SARS-CoV-2 infections. The region is based on the individuals postcode of residence entered when
ordering a TT test.
Positivity is not shown for Week 16 and Week 17 as for some regionsSeropositivity among individuals (aged 20-69 years) tested for COVID-19
antibodies by age for test and trace tests (Thriva)
The graph above shows the distribution of TT tests by age group (introduced mid-September 2020 (week 38)) and the percentage
of tests positive for COVID-19 antibodies within each age group. Seropositivity increased overtime for all age groups reflecting
past incidence of confirmed SARS-CoV2 infection, with little difference in positivity by age groups. The proportion seropositive
shows little variation by age over time. Seropositivity is not shown for week 17 asCo/secondary infections with COVID-19
(updated monthly)
8 July 2021 Return to main menuCo/secondary infections with COVID-19
(data updated monthly)
• Caveat - undertesting for other pathogens may result in an underestimate of co/secondary
infection cases.
• Co/secondary infections refers to when a patient has an infection with more than one pathogen
at the same time (co-infection), or acquires another infection after contracting the first
infection (secondary infection).
• Numbers of co/secondary infection remain low across PHE surveillance systems except for
patients with severe respiratory failure requiring Extra Corporeal Membrane Oxygenation
(ECMO). Analysis of COVID-19 cases with severe respiratory failure requiring ECMO indicates
co/secondary infections among these account for just less than a third of all severe respiratory
failure cases due to infection.
• Preliminary data analysis from the first pandemic wave indicates that health care associated
infections, Streptococcus pneumoniae, influenza, Aspergillus and Candidemia cases and cases
with severe respiratory failure requiring ECMO have increased risk of mortality in comparison
to patients without co/secondary infection.
Definitions agreed with DAs
8 July 2021 Return to main menuCo/secondary infections among Extra Corporeal Membrane Oxygenation (ECMO)
patients (patients with most severe clinical respiratory signs)
Analysis is based on cumulative data on ECMO activity from week 40 2019 (30 September
2019) to week 23 2021 (ending 13 June 2021) to cover two complete seasons. This period
includes data from the first and second waves of the pandemic. COVID-19 cases are from
week 05 2020 (commencing 27 Jan 2020) due to retrospective reporting.
• 31% (189/614) of ECMO patients with a laboratory confirmed respiratory infection (all
aetiologies) had a co/secondary infection reported.
• 43% (16/37) of ECMO patients with a laboratory confirmed influenza had co/secondary
infections
• 31% (158/514) of ECMO patients with laboratory confirmed COVID-19 had co/secondary
infections. Of these 158 cases, the most frequent co/secondary infections in COVID-19
cases were Gram-negative bacilli (n=56) and fungi (n=32), accounting for 56% (88/158).
8 July 2021 Return to main menuCo/secondary infections among patients with Healthcare Associated Infections:
Blood stream and respiratory infections (bacterial and fungal) in COVID-19 patients in
England in wave 2 by COVID-19 diagnosis (29 June 2020 to 28 February 2021)
• 0.2% of COVID-19 patients had a key bacterial/fungal coinfection (±1 day of first SARS-CoV-2
positive specimen date), or secondary infection (between 2 days andCo/secondary infection with respiratory viruses, vaccine preventable bacteria and
fungi
Please note fungal data refers to secondary infections only.
The UK moved out of influenza season in early 2020/21 when COVID-19 increase began in March 2020.
Data contains results from two systems (Respiratory DataMart system and SGSS).
Mycology data contains results from Mycology reference laboratory data, Candidaemia is representative of deep infection. One case of
osteomyelitis and one case of ventriculitis were documented in wave two.
Legionella, Mycoplasma and gastrointestinal infection data not included.
8 July 2021 Return to main menuYou can also read