Schools Demand Assessment - Proposed Residential Development at Scholarstown Road, Knocklyon, Dublin 16
←
→
Page content transcription
If your browser does not render page correctly, please read the page content below
Schools Demand Assessment

Proposed Residential Development at Scholarstown Road,
Knocklyon, Dublin 16

September 2019
Schools Demand Assessment

Contents
1.0 Introduction ........................................................................................................................... 1
   1.1 Study Area ..................................................................................................................................... 1
   1.2 Proposed Development................................................................................................................. 1
2.0 Policy Context ........................................................................................................................ 3
   2.1 Action Plan for Education 2019 ..................................................................................................... 3
   2.2 Guidelines for Planning Authorities on Sustainable Residential Development in Urban Areas
   (2009) .................................................................................................................................................. 3
   2.3 The Provision of Schools and the Planning System: A Code of Practice (2008) ............................ 3
   2.4 School Building Programme .......................................................................................................... 4
   2.5 South Dublin County Development Plan 2016-2022..................................................................... 4
3.0 Approach ............................................................................................................................... 6
4.0 Supply .................................................................................................................................... 7
   4.1 Primary Schools ............................................................................................................................. 7
   4.2 Post-Primary Schools ..................................................................................................................... 7
5.0 Demand ............................................................................................................................... 10
   5.1 Demographic Profile .................................................................................................................... 10
      5.1.1 County-Wide Renting Profile ................................................................................................ 12
   5.2 The Impact of Proposed Development on Primary School Demand........................................... 12
   5.3 The Impact of Proposed Development on Post-Primary School Demand .................................. 13
   5.4 Factors Influencing Demand........................................................................................................ 13
      5.4.1 Migration and Fertility Forecasts .......................................................................................... 13
      5.4.2 County-Wide Renting Profile ................................................................................................ 15
6.0 Conclusion ........................................................................................................................... 16
Appendix A ................................................................................................................................ 17

                                                                                                                                                             i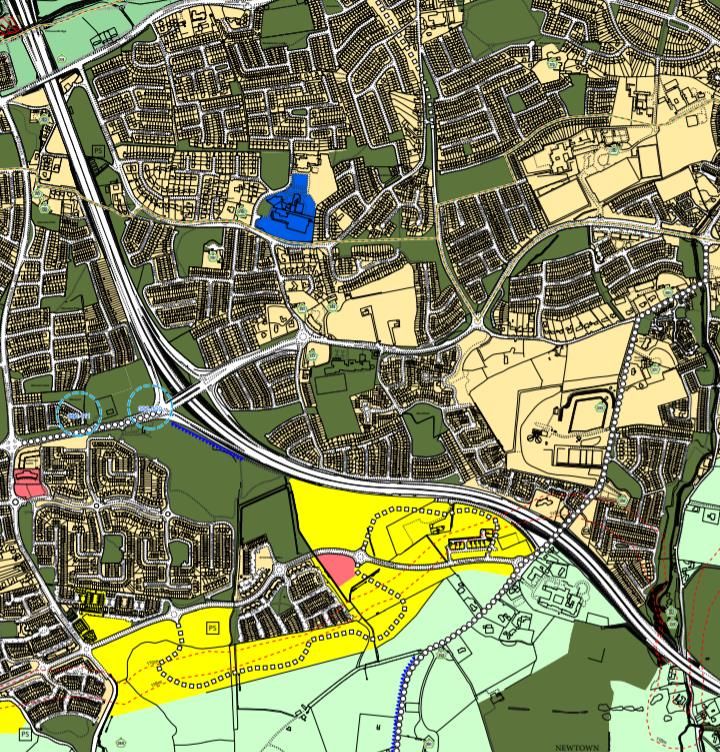
Schools Demand Assessment
1.0 Introduction
This schools demand assessment has been prepared by Future Analytics Consulting Ltd. on behalf of
Ardstone Homes relating to a residential development proposal at Scholarstown Road, Knocklyon,
Dublin 16. This report provides a detailed review of the strategic, statutory and policy context that
relates to the provision of education facilities. It outlines the existing range of educational services on
offer in the study area and offers insights into the future capacity of the existing facilities.
1.1 Study Area
The subject site for the proposed development is located to the north of Scholarstown Road in
Knocklyon, Dublin 16 and is approximately 6.05 hectares in extent incorporating the Scholarstown
Road. It lies approximately 10km south of Dublin City Centre close to Knocklyon District Shopping
Centre in the south eastern part of the local administrative area of South Dublin County Council. The
site is bounded by Scholarstown Road to the south, Scholarstown Park to the east, and Dargle Wood
to the north. To the west, a gated residential apartment block called Ros Mór View also bounds the
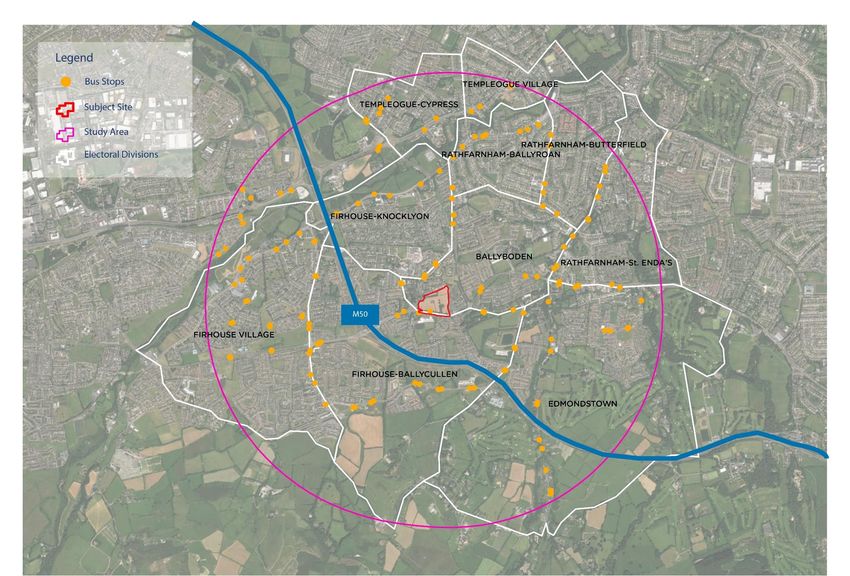
site. The site enjoys good accessibility and public transport facilities with a well-established bus
network with numerous routes serving the area to the site, and easy vehicular access to the M50 to
the west of the site.
The catchment area for this study is defined by a 2km buffer created from the centre of the site. All
Electoral Divisions (EDs) that intersect with this boundary and have a significant proportion of their
area within the buffer zone, are included in the study area and will form the basis for the socio-
economic analysis performed in later sections (see Figure 1). In total there are 10 EDs included for the
purpose of this study and a more detailed analysis of this will take place in a later section of this report.
1.2 Proposed Development
Ardstone Homes intend to deliver a residential development for the Private Rental Sector and private
market (Build-to-Rent and Build-to-Sell) on the subject site, maximising its potential while having
regard to neighbouring amenities and ensuring it offers a high quality and vibrant residential amenity.
The development will consist of 590 units, of which 246 will be one bedroom units (41.7% of the total),
289 will be two bedroom units (49% of the total), and 55 will be three bedroom units (9.3% of the
total). 480 or 81% of the total units are proposed to be Build-to-Rent whilst 110 or 19% are to be Build-
to-Sell units.
1
Figure 1: Study Area with Subject Site Outlined in Red.

                                                          2
2.0 Policy Context
For the purpose of this report FAC have reviewed national-level planning policy relating to schools,
along with the South Dublin County Development Plan. The key points relating to this study, as derived
from each piece of policy, are outlined in the following sections.

2.1 Action Plan for Education 2019
Goal 4 of the Department of Education and Skills (DES) 2019 ‘Action Plan for Education’ aims to
“intensify the relationship between education and the wider community, society and the economy”. A
fundamental part of this goal is the provision of increased choices in school type, affording parents of
children with greater options.

Action 51 aims to “make progress towards increasing the diversity of school type, in order to offer
parents more choice’’. DES commitment 10.3.2, arising from the Programme for a Partnership
Government, is to increase the number of non-denominational and multi-denominational schools
with a view to reaching 400 by 2030.

Goal 5 is to “lead in the delivery of strategic direction and supportive systems in partnership with key
stakeholders in education and training” and methods through which this can be achieved is via the
delivery of appropriate infrastructure for learning environments. The capital programme, at €941
million for 2019, represents a very substantial commitment of resources, in order to develop the
physical learning infrastructure.

Strategic Action 1 is to “Implement the National Development Plan 2018-2027 and Project Ireland 2040
in respect of the schools’ sector, higher education and further education and training”.

Action 84 seeks to “implement the ‘National Development Plan 2018-2027’ in respect of the primary
and post-primary school sectors”. One of the indicators that will be used to measure the progress of
Goal 5 during 2019 is the number of primary and post-primary schools.

2.2 Guidelines for Planning Authorities on Sustainable Residential Development in
Urban Areas (2009)
Under the chapter entitled ‘planning for sustainable neighbourhoods’ the provision of certain key
community facilities is discussed, with schools forming essential elements. As new residential
developments can lead to a demand for school places, it is vital that the “timely provision of new school
buildings” is planned for. Furthermore, it is stated that “no substantial residential development should
proceed without an assessment of existing school capacity or the provision of new school facilities in
tandem with the development”. In addition, the Guidelines recommend that development
applications with over 200 units should be accompanied by a report that assesses the likely school-
place demand generated, as well as the existing capacity.

2.3 The Provision of Schools and the Planning System: A Code of Practice (2008)
The Code of Practice stipulates the methodology for forecasting future education demand.
Identification of future primary school demands should be based upon:

    -   The anticipated increase in overall population for the city/county plan area over the next nine
        years (as set out in relevant development or local area plans);
    -   The current school-going population based on school returns;

                                                                                                       3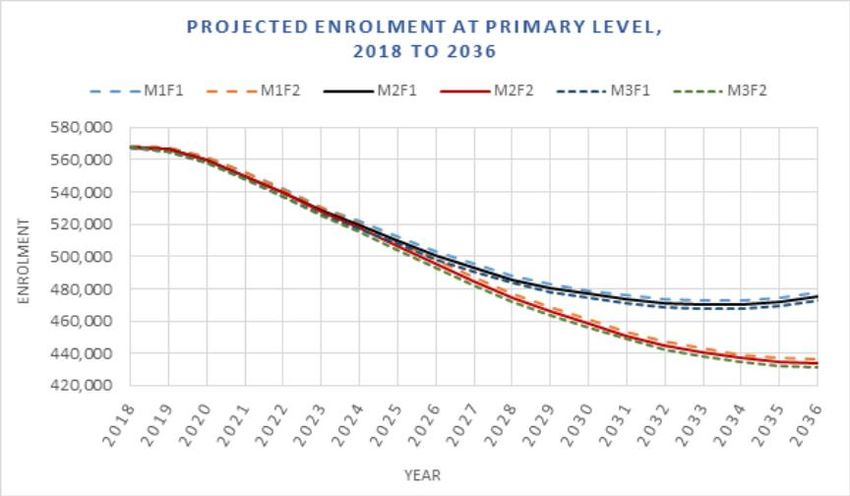
-     The increase in school going population, assuming that an average of 12% of the population
           are expected to present for primary educations; and,
     -     The number of classrooms required in total derived from the above.

2.4 School Building Programme
The DES provide details on planned construction projects for new school facilities1. The following two
projects are listed in the most up-to-date version of this project list (dated 31st July 2019): Gaelscoil
Cnoc Liamha, Knocklyon (Project 20043G), D16 Stage 2b (Detailed Design); and Firhouse ET Secondary
School (68307J), D24 Site Acquisition Process.

2.5 South Dublin County Development Plan 2016-2022
The current South Dublin County Development Plan (SDCDP) covers the period between 2016 and
2022. It stipulates several requirements for development in the County over the lifetime of the plan.

Figure 2 shows the hierarchy of centres from the SDCDP, including Knocklyon District Centre. In this
way Knocklyon is considered a primary growth node for the delivery of residential units. In this regard
it is worth noting the population targets outlined in the Eastern and Midland Regional Spatial and
Economic Strategy. For 2026 the population forecast for South Dublin Local Authority is given as a
range between 308,000 and 314,000 and for 2031 it is given as a total population of between 320,500
and 329,000. The population of South Dublin County Council in 2016 was 278,767, having grown by
5% since 2011.

Figure 2: Knocklyon Designated as a District Centre in the SDCDP.

The SDCDP also includes a zoning map covering all land within the administrative area of the local
authority. The subject site is zoned ‘RES’, the objective of which is ‘to protect and/or provide for
residential amenity’. Figure 3 below shows the zoning map for the site and surrounding areas of the
subject site (marked in red). It is noted from examining this land use zoning map that a large area to
the south of Knocklyon in the Firhouse area is zoned ‘RES-N’ with the objective ‘to provide for new
residential communities in accordance with approved plans’. This area also incorporates two separate
sites designated for new Post-Primary Schools (see southwestern portion of Figure 3).

1
 https://www.education.ie/en/Schools-Colleges/Services/Building-Works/Major-Projects/current-status-of-large-scale-
projects.pdf

                                                                                                                      4
Figure 3: Land Use Zoning Map from the SDCDP.

                                                5
3.0 Approach
Having regard to the planning policy outlined in the previous section it is evident that an assessment
of the existing school facilities in the study area is required. It is imperative that a baseline is identified
which would then allow future demand estimations to be made based on demographic change and
the associated impact of the proposed development. Therefore, a methodology for the assessment of
school facilities has been developed in accordance with the directions provided in the aforementioned
planning policies, and it involves the following steps:

    1. Determining the extent and provision of existing school facilities within the wider study area;
    2. Undertaking a study of the current and potential future demographic make-up of the study
       area’s population; and,
    3. Estimating the level of demand for school facilities that may arise from the development
       proposal.

The following sections will utilise this methodology as a structural framework with the current existing
supply and occupancy of facilities first established, followed by a demographic analysis that provides
valuable insight into the characteristics of the study area’s population, before finally determining the
potential demand created by the proposed development.

                                                                                                             6
4.0 Supply
In order to establish a baseline of the existing capacity in the study area it was necessary to first
identify each of the existing educational facilities. This was undertaken through a comprehensive
desktop research exercise which used publicly available information and sources.
4.1 Primary Schools
The DES publish enrolment numbers for all primary schools in the state2. The DES records show that
there is a total of 13 primary schools in the area. Information on each school is provided in the
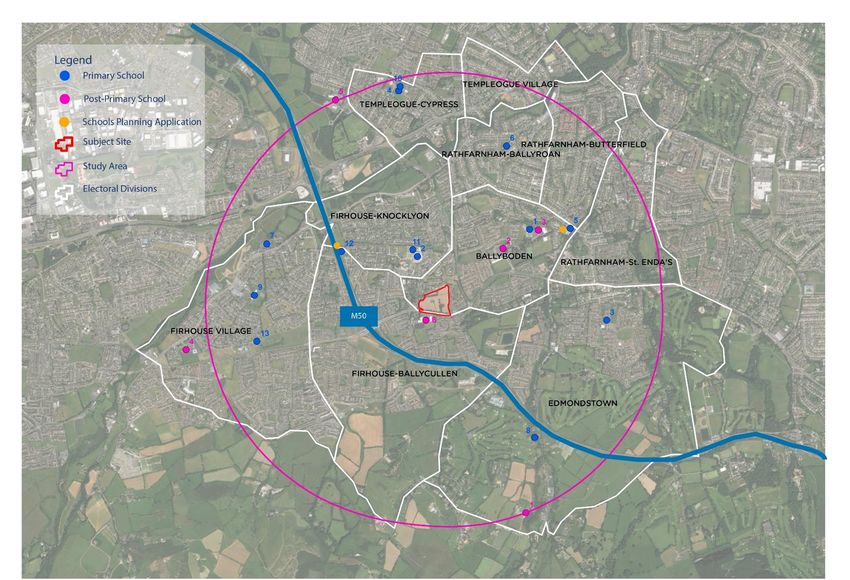
following table. The ‘map ID’ refers to the ID number that accompanies the blue symbols in Figure 4.
Map ID School Name Eircode 2016-2017 2017-2018 2018-2019
Enrolment Enrolment Enrolment
1 BALLYROAN BNS D16XK80 367 375 379
2 RATHFARNHAM PARISH NS D16H337 232 230 229
3 SCOIL CARMEL D16V043 435 425 401
4 SN BHAILE EAMONN D6WY791 86 101 106
5 ST PATRICK GNS D16YX54 539 568 558
6 SCOIL COLMCILLE NAOFA D14X051 827 817 806
7 SCOIL MHUIRE D24NA44 232 235 235
8 BISHOP GALVIN NS D16XF86 475 486 494
9 SCOIL TREASA FIRHOUSE D24E985 399 412 426
10 BISHOP SHANAHAN NS D6WX093 486 477 478
11 ST COLMCILLE SENIOR NS D16W8K0 744 756 764
12 GAELSCOIL CHNOC LIAMHNA D16HR26 235 245 235
13 GAELSCOIL NA GIÚSCE D24W682 81 102 130
Total 5,138 5,229 5,241
Table 1: Primary Schools Registered within the Study Area.
2018-2019 enrolment figures for the 13 primary schools in the study area showed an increase on the
figures recorded in 2016-2017, growing by 103 pupils. However, this increase was not recorded in
every school as four schools recorded decreases over the three year period (Map ID 2, 3, 6 and 10),
while an additional school saw figures remain the same (12). This would indicate that although growth
is occurring in overall pupil numbers, there is still some existing capacity in the area, which potentially
could absorb demand generated by the proposed development. Section 5.3 below outlines the DES
enrolment forecasting study, which indicates a predicted steady decline in enrolment numbers
nationally from 2018.
4.2 Post-Primary Schools
In terms of post-primary schools, or secondary schools, in the study area, the DES record there being
six facilities. These schools are a mix of fee-paying and public and cater for all genders. The following
table offers an overview of each school and provides the enrolment figures, as obtained from the DES
statistics, for the academic years 2016-2017, 2017-2018 and 2018-2019. It also presents the Map ID
that relates to the pink symbols on Figure 4.
2 https://www.education.ie/en/Publications/Statistics/Data-on-Individual-Schools/
7Map ID School Name Eircode 2016-2017 2017-2018 2018-2019
Enrolment Enrolment Enrolment
1 Rockbrook Park School D16P897 172 167 169
2 Sancta Maria College D16V389 472 497 514
3 Colaiste Eanna D16E248 612 626 621
4 Firhouse Community D24HY03 763 788 782
College
5 St Mac Dara’s D6WEW83 865 856 862
Community College
6 St. Colmcille’s D16H298 713 714 721
Community School
Total 3,597 3,648 3,669
Table 2: Post-Primary Schools Registered within the Study Area.
Enrolment figures for the 2016-2017 academic year indicated that there was a total of 3,597 students
across all six post-primary schools in the study area. This total figure increased by 51 in the following
academic year (2017-2018) and again by 21 the following academic year (2018-2019) with a combined
total of 3,669 students. Although there was an overall increase in post-primary pupil numbers in the
study area, it is notable that two of the school’s enrolment numbers have dropped since 2016 (Map
ID 1 and 5). This indicates the potential for capacity in the area for post-primary school entrants that
may be generated by the proposed development (see Table 10). Figure 4 highlights the locations of all
primary and post-primary schools within the defined study area.
8Figure 4: Primary and Post-Primary Schools within the Study Area.
95.0 Demand
As indicated above, the development will consist of 590 units, of which 246 will be one bedroom units
(41.7% of the total), 289 will be two bedroom units (49% of the total), and 55 will be three bedroom
units (9.3% of the total). 480 or 81% of the total units are proposed to be Build-to-Rent whilst 110 or
19% are to be Build-to-Sell units.
The following section provides an assessment of the potential demand created by the proposed
development at Scholarstown Road. It utilises socio-economic data analytics to reach a quantitative
conclusion about the potential educational needs generated by new residents to the area.
It should be noted, however that educational demand is accounted for by the Planning Authority and
DES through the review of the county development plan with consideration of zoned land versus
existing services, resulting in designation of school sites as required. Thus, the outcome of this
quantitative assessment for the expected development of the subject site (zoned lands) will have been
contemplated and appropriately planned by these authorities.
5.1 Demographic Profile
As previously outlined, the study area was defined through the selection of all relevant EDs that
intersected with a 2km buffer created around the subject site. In total, there are 10 EDs found within
this area. Table 3 provides an overview of each ED along with the population of each as recorded in
both the 2011 and 2016 Census. It also offers the percentage change in population during this period
as a means of highlighting growth patterns.
ED Name Population Population Population Change Percentage Change
2011 2016 2011-2016 2011-2016
Ballyboden 5,085 5,028 -57 -1.1%
Edmondstown 5,712 5,757 45 0.8%
Firhouse-Ballycullen 7,773 8,230 457 5.9%
Firhouse-Knocklyon 3,602 3,505 -97 -2.7%
Firhouse Village 11,648 12,214 566 4.9%
Rathfarnham-Ballyroan 2,493 2,612 119 4.8%
Rathfarnham-Butterfield 3,206 3,288 82 2.6%
Rathfarnham-St. Enda's 3,843 3,877 34 0.9%
Templeogue-Cypress 2,800 2,714 -86 -3.1%
Templeogue Village 1,994 2,074 80 4.0%
Ballyboden 5,085 5,028 -57 -1.1%
Total 48,156 49,299 1,143 1.7%
Table 3: Population Change 2011-2016.
In total, there are 49,299 persons recorded as resident in the study area on the night of the 2016
Census. This amounts to an increase of 1,143 persons from the 2011 Census results, which is a 1.7%
increase. While the rate of population change in the study area (1.7%) is below that of South County
Dublin (SCD) as a whole (5%), growth levels of almost 2% in a well-established suburban area such as
Knocklyon remain healthy, indicating a reasonable level of infill development in the area.
The population change that has already occurred is generally an accurate indicator of future trends,
however it is appropriate to undertake a more detailed analysis. FAC have employed a methodology
10for modelling population projections which is termed ‘cohort component modelling’3. Table 4
represents forecasting that utilises this method and focuses on the existing population and the natural
increases that will occur up to the year 2026 across the 10 EDs. This method discounts any potential
population increase that may occur as a result of the proposed development as it focuses on natural
growth rather than speculative growth resulting from potential residential developments.
ED Name Population Population Population Change Percentage Change
2016 2026 2016-2026 2016-2026
Ballyboden 5,028 6,025 997 19.8%
Edmondstown 5,757 6,899 1,142 19.8%
Firhouse-Ballycullen 8,230 10,192 1,962 23.8%
Firhouse-Knocklyon 3,505 4,042 537 15.3%
Firhouse Village 12,214 15,062 2,848 23.3%
Rathfarnham-Ballyroan 2,612 2,816 204 7.8%
Rathfarnham-Butterfield 3,288 3,610 322 9.8%
Rathfarnham-St. Enda's 3,877 4,491 614 15.8%
Templeogue-Cypress 2,714 3,073 359 13.2%
Templeogue Village 2,074 2,330 256 12.3%
Total 49,299 58,540 9,241 18.7%
Table 4: Population Projections using Cohort Component Modelling.
As Table 4 shows, the population projections for the study area reinforces the trends that this area is
a popular and attractive location for people to settle. An overall growth of 18.7% of 2016 figures is
predicted, which amounts to a total growth of 9,241 persons across all EDs. Thus, the likelihood is that
the study area, as is the case with the wider Dublin region, will continue to experience a strong growth
in population over the coming years.
Of course, while the overall levels of population change can offer some insights into the required
amenities and infrastructure that a particular location needs, it is far more beneficial to understand
the changes occurring in specific cohorts, or age categories when assessing educational needs.
Different population cohorts have different requirements, for example young families require
education facilities while those of retirement age require health and wellness infrastructure. Table 5
provides a breakdown of the recorded population change and the projections made as part of this
study, categorised by age cohort. It offers a breakdown of the area’s age profile that allows a more
detailed overview of the specific cohorts that will experience the greatest change.
3
FAC’s projection of population is underpinned by the application of the demographic cohort component methodology
(CCM); the same methodology as used by the Central Statistics Office in preparing the national projections. CCM is widely
used internationally as a best-in-class methodology. It provides a flexible and powerful approach to population projection by
using varying comparative scenarios, each tailored around the application of qualified assumptions in mortality, fertility and
migration (as aligned with the Central Statistics Office’s assessments).
11Age Cohort 2016 Population % of 2016 Total 2026 Population % of 2026 Total
0-4 3,485 7.1% 3,427 5.9%
5-9 3,667 7.4% 3,099 5.3%
10-14 3,266 6.6% 3,619 6.2%
15-19 3,269 6.6% 3,844 6.6%
20-24 2,981 6.0% 4,163 7.1%
25-29 2,650 5.4% 4,966 8.5%
30-34 3,403 6.9% 4,348 7.4%
35-39 3,986 8.1% 3,434 5.9%
40-44 3,566 7.2% 3,831 6.5%
45-49 3,361 6.8% 4,187 7.2%
50-54 3,361 6.8% 3,648 6.2%
55-59 3,033 6.2% 3,375 5.8%
60-64 2,732 5.5% 3,307 5.6%
65+ 6,539 13.2% 9,291 15.9%
Total 49,299 100% 58,539 100%
Table 5: Population by Age 2016-2026.
Census 2016 data depicted in Table 5 shows that the total number of persons aged 0 to 19 years
amounts to 13,687 people. This means that in 2016 approximately 27.7% of the overall total
population in the study area were likely to require some form of educational provision. When
compared with the percentage of population between 0-19 years in South Dublin as a whole (29.4%),
the proportion of people likely to be requiring educational provision in the study area is lower.
Projecting forward to 2026, the 0-19 age cohorts as a proportion of the total are forecast to drop from
27.7% to 23.9% in the study area.
5.1.1 County-Wide Renting Profile
The CSO produced a profile of renters based on 2016 Census profile. The summary of findings in
relation to South Dublin County Council are set out below with full details included in Appendix A. As
shown from this profile 38.5% of all privately rented properties in SCD had no children in 2016.
• 92,523 private households in SDC.
• 15,155 households in SDC privately rent.
• 16.4% of all households in SDC are renting privately.
• 21.6% of privately rented households are by single persons.
• A further 13.7% of renters are married or cohabiting couple with no children.
• 38.5% of all privately rented properties in SDC have no children.
This data is significant as it removes the assumption that all units proposed will create a demand for
education. In the same way as the Department Guidelines identify that one bedroom apartments will
not generate demand for education, a reduction in the generated needs for Build-to-Rent (BTR) is
assumed. In the context of a substantially (81%) Build-to-Rent development as proposed, this is a
significant reduction. See Section 5.3 below for further commentary on this and other factors that
reduce this demand.
5.2 The Impact of Proposed Development on Primary School Demand
Projections for the population cohort of school-going age are based on the methodology outlined in
the Department of Education and Science’s 2008 Code of Practice for the Provision of Schools in the
Planning System. This methodology has been utilised by planning authorities across the country to
determine the capacity of the current school system in a defined area, and to estimate the
requirements for future population changes.
12In order to identify the future primary school demands, the Department’s Code of Practice proposes
a methodology that is based on several factors that include an “anticipated increase in overall
population for the city/county plan area” over a subsequent nine year period, the current school-going
population (as stated in school returns), a understanding of the school going population based around
an assumed 12% average figure of the total population, and the number of classrooms required as
established from a combination of the previous factors. This is a straightforward model that uses
assumptions of population growth in conjunction with a set percentage of a population that is of a
school-going age.
No. of Units (Excluding Average Household Size Projected Residents Projected Primary
One-bed Units) School Population (12%)
344 2.95 1,015 121.8
Table 6: Primary School Demand within the Study Area Generated by the Proposed Development.
Table 6 shows the projected primary school demand based on the Department Guidelines would be
121.8. This figure should be tempered by factors that could reduce this demand set out in Section 5.4
below.
5.3 The Impact of Proposed Development on Post-Primary School Demand
Projection for post-primary or secondary school demand generated by the development are based on
analysis of the 10-19 age cohort in the study area.
No. of Units (Excluding Average Household Size Projected Residents Projected Post-Primary
One-bed Units) School Population (13%)
344 2.95 1,015 132
Table 7: Post-Primary School Demand within the Study Area Generated by the Proposed Development.
Table 7 sets out that the projected demand for post-primary school places generated by the proposed
development would be 132. This figure should be tempered by factors that could reduce this demand
set out in Section 5.4 below. It should also be noted that two future post-primary school sites are
designated within the study area by the South Dublin County Development Plan 2016-2022 (as shown
in Figure 3).
5.4 Factors Influencing Demand
Notwithstanding the above quantitative demand assessment, educational demand is accounted for
by the Planning Authority and DES through the review of the county development plan with
consideration of zoned land versus existing services, resulting in the designation of school sites as
required. Thus, the outcome of this quantitative assessment for the proposed development of the
subject site (zoned lands) will have been contemplated and appropriately planned by these
authorities.
As set out below, other factors should be taken into account in considering the educational demand
generated by any development, these are:
- Future migration and fertility forecasts; and
- County-wide renting profile with low rates of children.
5.4.1 Migration and Fertility Forecasts
The above models do not factor in migration and fertility scenarios, which could impact future demand
widely. The DES regularly release enrolment projection reports which are the basis for their
13determination of whether new school infrastructure is required nationally. In July 2018 they released
the most recent report which analyses projections of full-time enrolment for the 2018 to 2036 period.
Using three migration assumptions and two fertility assumptions the DES created six scenarios to
model projected enrolments over that period. The DES state that 2018 will prove to be the year when
‘peak’ primary school enrolments occur, totalling 567,800 pupils and gradually reducing after this.
Figure 5: Projected Primary School Enrolment to 2036 (Source: DES).
Post-primary school peak enrolments will not be reached until 2024 when in excess of 402,175 pupils
are expected to enrol. They will subsequently reduce after 2024 on an annual basis.
Figure 6: Projected Secondary School Enrolment to 2036 (Source: DES).
With enrolments figures peaking in 2018 for primary school goers, and 2024 for secondary school
pupils, the requirement for additional school facilities will be reduced in the near future. If it is
14accepted that current school provision is adequately able to support the current numbers of students,
albeit at capacity, there will be far less pressure on schools in the future, meaning there is no
requirement to provide for new schools.
5.4.2 County-Wide Renting Profile
As mentioned above, the CSO produced a profile of renters based on 2016 Census profile. The
summary of findings in relation to South Dublin County Council are set out below with full details
included in Appendix A. As shown from this profile 38.5% of all privately rented properties in SCD had
no children in 2016.
• 92,523 private households in SDC.
• 15,155 households in SDC privately rent.
• 16.4% of all households in SDC are renting privately.
• 21.6% of privately rented households are by single persons.
• A further 13.7% of renters are married or cohabiting couple with no children.
• 38.5% of all privately rented properties in SDC have no children.
This data is significant as it removes the assumption that all units proposed will create a demand for
education. A reduction in the generated needs for Build-to-Rent (BTR) is assumed. In the context of a
substantially (81%) Build-to-Rent development as proposed this reduction in demand would be
significant.
156.0 Conclusion
New, largescale residential developments have the potential to upset a catchment’s equilibrium, in
terms of school capacities, and because of this it is important to have an understanding of the current
ability of education facilities to support the wider community, both now and in the future. This study
provides an evidence-based assessment of the proposed development’s potential impact on
educational facilities and the level of demand generated by it. The quantitative modelling of projected
demand in Section 5.2 and 5.3 assumes that all children will require school provision within the study
area, however other factors should be taken into account in considering the educational demand
generated by any development, these are:
- Future migration and fertility forecasts; and
- County-wide renting profile with low rates of children.
Section 5.2 and 5.3 sets these considerations aside and assumes conservatively that all children will
require school provision within the study area. Based on demographic analysis the data suggests that
on the basis of the average household size within the study area, discounting one bedroom
apartments, the proposed development will create demand for:
Primary School Spaces: 121.8
Post-Primary School Spaces: 132
Notwithstanding the above quantitative demand assessment, educational demand is accounted for
by the Planning Authority and DES through the review of the county development plan with
consideration of zoned land versus existing services, resulting in the designation of school sites as
required. Thus, the outcome of this quantitative assessment for the expected development of the
subject site (zoned lands) will have been contemplated and appropriately planned by these
authorities.
Aside from this, other important demand-reducing factors that should be considered for educational
services are set out as:
Primary School
Low future migration and fertility forecasts;
Significantly lower frequency of children in rented accommodation (the proposed development is 81%
BTR); and
Four local primary schools recorded decreases in enrolments over the three year period, indicating
ability to absorb demand.
One primary school is planned to be constructed in the locality, namely Gaelscoil Cnoc Liamha in
Knocklyon.
Post-Primary School
Low future migration and fertility forecasts;
Significantly lower frequency of children in rented accommodation (the proposed development is 81%
BTR); and
Two local post-primary schools enrolment numbers have dropped since 2016, indicating ability to
absorb demand.
One post-primary school is planned to be constructed in the locality, namely Firhouse ET Secondary
School.
16Appendix A
Summary Findings:
92,523 private households in SDC
15,155 households in SDC privately rent
16.4% of all households in SDC are renting privately
21.6% of privately rented households are by single persons
A further 13.7% of renters are married or cohabiting couple with no
children
38.5% of all privately rented properties in SDC have no children
South Dublin All types of occupancy Rented from private % Rented from private
landlord landlord
All private households 92,523 15,155 16.4%
All persons in private households 277,168 49,239 17.8%
One person 15,575 1,408 9.0%
Married couple 13,144 834 6.3%
Cohabiting couple 3,318 1,246 37.6%
Married couple with children 31,089 4,148 13.3%
Cohabiting couple with children 4,674 1,447 31.0%
One parent mother with children 10,298 2,174 21.1%
One parent father with children 1,407 171 12.2%
Married couple with other persons 943 241 25.6%
Cohabiting couple with other persons 480 246 51.3%
Married couple with children and other persons 2,231 653 29.3%
Cohabiting couple with children and other persons 363 137 37.7%
One parent mother with children and other persons 1,509 292 19.4%
One parent father with children and other persons 282 62 22.0%
17Two or more family units with or without other persons 2170 235 10.8%
Non-family households containing related persons 1842 493 26.8%
Households comprised of unrelated persons only 3198 1368 42.8%
All types of occupancy Rented from private %
landlord
Under 25 years 1,213 706 4.7%
25 - 29 years 4,530 2,537 16.8%
30 - 34 years 9,767 3,802 25.1%
35 - 39 years 12,244 3,215 21.2%
40 - 44 years 10,956 2,003 13.2%
45 - 49 years 9,620 1,257 8.3%
50 - 54 years 8,832 698 4.6%
55 - 59 years 8,444 431 2.8%
60 - 64 years 7,749 249 1.6%
65 years and over 19,038 235 1.6%
All ages 92,393 15,133 100.0%
18All types of occupancy Rented from private % Rented from private
landlord landlord
Before 1919 752 100 3.95%
1919 to 1945 1,380 131 9.49%
1946 to 1960 5,740 330 5.75%
1961 to 1970 9,516 590 6.20%
1971 to 1980 22,115 1,442 6.52%
1981 to 1990 12,411 1,439 11.59%
1991 to 2000 15,386 2,738 17.80%
2001 to 2010 17,288 5,362 31.02%
2011 or later 1,622 468 28.85%
Not stated 6,183 2,533 40.97%
19You can also read