The Economic Impact of International Students in Hawaii - Calendar Year 2019 - October 2020 Department of Business, Economic Development & Tourism ...
←
→
Page content transcription
If your browser does not render page correctly, please read the page content below

The Economic Impact of International
Students in Hawaii – Calendar Year 2019

           October 2020
           Department of Business, Economic Development & Tourism
           Research and Economic Analysis Division
Table of Contents

I.      INTRODUCTION ............................................................................................................................ 1
II. 2019 HAWAII INTERNATIONAL EDUCATION SURVEY–ECONOMIC IMPACT
ANALYSIS ............................................................................................................................................... 2
     Data Collection and Sources ................................................................................................................. 2
     Methodology ......................................................................................................................................... 2
        1. Direct Economic Impact ................................................................................................................ 3
        2. Total Economic Impacts ................................................................................................................ 4
III.        OUTCOMES OF THE 2019 INTERNATIONAL EDUCATION SURVEY ........................... 6
     Data comparisons.................................................................................................................................. 6
     Spending per student ............................................................................................................................. 7
     Financial aid to International students and net spending per student .................................................. 8
     Countries and places of origin of international students in Hawaii ................................................... 10
IV.         CONCLUSIONS ........................................................................................................................ 11
            APPENDIX I: 2020 Hawaii International Education Survey ............................................... 12
            APPENDIX II: List of Institutions Surveyed........................................................................... 16
            APPENDIX III: Total Economic Impact of International Students within the Unviersity of
            Hawaii System on the State’s Economy ............................................................................... 20
This report was produced by the Research and Economic Analysis Division (READ) of the
Department of Business, Economic Development & Tourism (DBEDT) in collaboration with the
Study Educational Hawaii Consortium. This report was produced by Joseph Roos and Naomi
Akamine under the direction of the Economic Research Administrator Dr. Eugene Tian
EXECUTIVE SUMMARY

The 2020 Hawaii International Education Survey (IES) collected data for the calendar
year of 2019 regarding the number of international students, the program length, and
expenditure amounts of these students and estimated the contribution to the state’s
economy. The report also examined the country of origin of international students and
their relative ranking.

This report is an update of previous reports published in 2009, 2015, 2016, 2017, 2018, and
2019. In looking at the most recent reports, the 2017 report had 27 responses, representing
10,800 international students; the 2018 report had 34 responses, representing 12,916
international students; and the 2019 report had 41 responses, representing 14,300 international
students. The 2020 IES received responses from 44 of Hawaii’s educational institutions,
covering data for the 2019 calendar year. The responding institutions for the current survey
represented 13,371 international students. Caution should be used when comparing this year’s
survey with previous years due to a varying number of responses and methodology.

The 2019 direct spending of international students in the State of Hawaii was an estimated
$185 million. This amount included tuition and fees plus living expenses. Based on this direct
impact, the total economic impacts of international student expenditures for calendar year 2019
were as follows:

   •   $381.2 million in economic output generated, including direct, indirect, and induced
       effects.
   •   $29.2 million in state taxes generated.
   •   $168.4 million in household income generated.
   •   3,756 jobs were supported by international student spending.

The overall average annual per student spending was $13,838, including living expenses and
tuition and fees across all programs for calendar year 2019.
Hawaii’s educational institutions hosted a diverse group of students from all over the globe.
Japan remains the top country of origin for Hawaii’s international students, comprising 31.6
percent of the total. Japan was followed by the South Korea with 14.4 percent, Switzerland
with 9.0 percent, China with 4.7 percent (including Hong Kong and Macao), and Germany
with 2.9 percent.
It is important to note that the economic impact estimates do not include contributions from
educational travel to Hawaii from foreign-based educational institutions. The estimates also do
not include educational travel covering school excursions and other types of education-related
travel from Japan, China, Taiwan, and South Korea, and its economic impact. Finally, the
estimates do not include contributions from exchange students attending Hawaii’s public
schools (under the Hawaii Department of Education).
I. INTRODUCTION
This report is based on the annual Hawaii International Education Survey (IES), which is a
collaboration between the Study Hawaii Consortium and the State of Hawaii’s Department of
Business, Economic Development, & Tourism (DBEDT). The survey provides an annual
benchmark to estimate the economic impact and number of international students studying in
Hawaii and is sent to schools in Hawaii that host international students. The survey period
covers calendar year 2019 and, therefore, the data does not reflect the impact of the COVID-19
pandemic.
As with previous surveys, the current 2020 IES was conducted online and requested Hawaii’s
educational institutions to provide the following data:
• The number of international students enrolled in various programs during the 2019
calendar year.
• The length of academic programs for international students.
• The tuition and fees paid by international students.
• The cost of living expenditures incurred by international students.
• The country of origin for the international students studying in Hawaii.
The questionnaire is listed in Appendix I.
This report is divided into four sections; after Section I Introduction, Section II examines the
direct, indirect, and induced impacts of international student spending on Hawaii’s economy
and the results of the 2020 IES. Section III analyzes outcomes of the 2020 IES, such as
specifics on student spending, financial aid, and countries of origin. This section also provides
a summary of results from previous surveys. Finally, Section IV concludes by summarizing the
survey results.
Page |1II. 2020 HAWAII INTERNATIONAL EDUCATION SURVEY–ECONOMIC
IMPACT ANALYSIS
The estimate of the economic impact of international students studying in the State of Hawaii
was calculated based on the results of the 2020 IES, conducted in the second quarter of 2019.
Caution should be used when comparing the current survey results with previous survey results
due to variation in the survey respondents and methodology.
Data Collection and Sources. The current survey was administered online. The sampling
frame consisted of educational institutions located in Hawaii and identified by the U.S.
Department of Homeland Security’s (DHS) database called SEVIS (Student and Exchange
Visitor Information System). The questions of the online survey are available in Appendix I
and the list of the institutions the survey was sent to is in Appendix II.
The survey asked educational institutions to report the number of international students and the
estimated expenses for tuition/fees and living expenses incurred by international students for
calendar year 2019. The educational institutions were also asked the level and type of study
programs for international students (e.g. middle and high schools students, undergraduate
students, non-degree seeking students, etc.).
Responses were received from 44 educational institutions in Hawaii, for a response rate of 64
percent. The institutions responding to the 2020 IES accounted for 13,371 international
students for the 2019 calendar year, representing a majority of Hawaii’s international students.
Generally, the schools that did not reply to the survey were either trade schools, with a very
low number of international students, or institutions which did not host international students
for the current survey year.
Methodology. The analysis presents two different estimates:
1) Direct Impact: This is an estimate of the direct dollar amount spent in Hawaii by
international students including tuition, fees, and living expenses.
2) Direct + Indirect + Induced Impact: This is the direct impact plus the indirect and
induced impacts, including the ripple effects of international student expenditures
on output, household income, state tax revenue, and jobs.
Page |21. Direct Economic Impact. The methodology to measure the direct impact of international
students studying in Hawaii was based on the reported data provided by each respective
institution. The calculation aggregated the tuition/fees plus living expenses minus the financial
assistance awarded for all the institutions that responded to the survey. Non-responses were not
included in the total and, therefore, the estimates are on the conservative side. The formula for
calculating the direct economic impact of international students studying in Hawaii is:
Number of Average Expenses: Financial Direct
International • Tuition and Incentives or Economic
Students in Hawaii Fees Support from Impact
(fall, spring, • Living Hawaii Institutions
summer semesters) Expenses
Table 1 presents a summary account of the different types of international students in Hawaii
and the amount spent on tuition and fees plus living expenses. These categories show the direct
economic impact of international student spending on the state’s economy.
Similar to previous surveys, the 2020 IES showed that the majority of international students
came to Hawaii to enroll in short-term academic programs, English language programs, or
other academic exchange programs at the undergraduate level or lower. The number of short-
term international students was 10,093, or 75 percent of the total. Generally, students enrolled
in these short-term programs were not working towards a degree. The long-term category
included students enrolled full-time for at least one semester (spring, summer, or fall), and
tuition and living expenses were calculated on a semester by semester basis.
The number of full-time students was estimated based on the number of international students
recorded by the survey respondents. In addition to the university level, this category also
includes international students enrolled full-time at the middle and high school level. The
number of long-term students was 3,278, which comprised about 25 percent of all international
students reported in the survey results.
Page |3Table 1: Direct Economic Impact of International Students in Hawaii – Summary
Results of the 2020 Hawaii International Education Survey
Spending by International
Students on
Number of Tuition & Living
Category Fees Expenses
Total
Students
Long-Term Students 3,278 $55,723,603 $51,660,580 $107,384,183
Middle/high school
330 $7,612,179 $5,411,986 $13,024,165
students
Degree-seeking
2,266 $31,596,547 $34,131,522 $65,728,069
undergraduate students
Degree-seeking graduate
682 $16,514,877 $12,117,072 $28,631,949
students
Short-Term Students 10,093 $37,253,888 $40,388,527 $77,642,415
Non-degree-seeking
1,712 $12,567,277 $17,325,206 $29,892,483
undergraduate students
Non-degree-seeking
14 $310,144 $219,713 $529,857
graduate students
Short-term training
program 6,954 $22,869,595 $15,794,652 $38,664,247
students/professionals
Students in
1,045 $1,461,112 $1,334,956 $2,796,068
summer/winter camps
Visiting scholars/teachers 368 $45,760 $5,714,000 $5,759,760
Total* 13,371 $92,977,491 $92,049,107 $185,026,598
Source: DBEDT, 2020 IES
*category sums vary slightly from totals due to rounding
2. Total Economic Impacts. The total economic impacts for the state included the direct,
indirect and induced impacts. The multipliers used for this calculation are from The Hawaii
State Input-Output Study: 2012 Benchmark Report. 1 Type II final demand multipliers were
used, which include direct, indirect, and induced effects.
1
DBEDT. 2016. The Hawaii State Input-Output Study: 2012 Benchmark Report. August.
Page |4The following formula was used to calculate the total economic impact and the number of jobs
supported by international students in Hawaii for calendar year 2019:
Direct Derived Multipliers for the -- Total Economic Output
Economic Industry (Colleges,
-- Total Household Income
Impact Universities, and Professional
Schools) -- State Tax Impact
-- Number of Jobs Supported
Table 2 summarizes the findings and shows the economic impact of international students
studying in Hawaii.
Table 2: Total Economic Impact of International Students in Hawaii for 2019
Direct Spending (from Table 1) $185,026,598
Final Demand Economic
Multiplier (Type II) Impact (Type II)
Total Output Generated 2.06 $381,154,792
Total Household Income Generated 0.91 $168,374,204
Total State Taxes Generated 0.158 $29,234,202
Total Jobs Supported 20.3 (per $million) 3,756
Source: DBEDT, calculations are based on the Hawaii State Input-Output Study: 2012 Benchmark Report
(August 2016)
The total output generated is an estimate of the total dollar change in output for all industries
in the state, resulting from the inflow of money spent by international students in Hawaii.
Based on this analysis, the total output generated by international student spending for calendar
year 2019 was an estimated $381.2 million.
Total household income generated refers to the estimated household earnings that can be
attributed to international students studying in the state. Hawaii households earned an
estimated total of $168.4 million generated from international students for calendar year 2019.
The total state taxes generated line shows the estimated state tax revenue that can be attributed
to international students studying in Hawaii. An estimated $29.2 million in state taxes was
generated by international student spending in the state for calendar year 2019.
The last line of the table shows the total number of jobs supported by international students
studying in Hawaii. Given an estimated direct economic impact of $185 million for calendar
year 2019, 3,756 jobs were supported. As noted above, these estimates are based on the Type II
multiplier, which includes direct, indirect, and induced effects.
Page |5III. OUTCOMES OF THE 2020 INTERNATIONAL EDUCATION SURVEY
Data comparisons
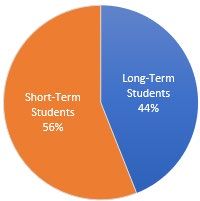
Figure 1 below highlights the results of the 2020 IES by the program length and compares
these with the two previous survey results. It is important to note that the data was collected for
the previous calendar year. The 2020 IES measured 2019 data and showed a higher share of
students enrolled in short-term programs, with 75 percent compared with 71 percent and 56
percent for the two previous respective surveys.
Figure 1. Categories of International Students in Hawaii
2017 2018 2019
(2018 IES) (2019 IES) (2020 IES)
Source: DBEDT: respective years of IES
From an economic development perspective, long-term students have a greater impact on the
state’s economy because they spend more on an average annual basis than short-term
students. 2 Long-term students, seeking a degree, bring in more revenue for educational
institutions; their spending has a stronger ripple effect as these students pay rent, buy groceries,
and spend on other items for a longer time than short-term students.
As shown in Table 3, the long-term student direct-impact on the local economy was $107.4
million and the short-term student impact was $77.6 million. While the dollar impact was less,
short-term programs contribute significantly to Hawaii’s economy because they serve as a
bridge for students to transition into long-term degree programs. A number of programs
reported an increase in short-term students and a decrease in long-term students.
2
The Economic Impact of International Students in Hawaii, 2015 (DBEDT)
Page |6Table 3. Spending by International Students in Hawaii by Program Length:
2019 Calendar Year
Category Long-Term Programs Short-Term Programs
Number of Students 3,278 10,093
Total Spending ($) $107,384,183 $77,642,415
Living Expenses ($) $51,660,580 $40,388,527
Tuition and Fees ($) $55,723,603 $37,253,888
Average Annual Spending $32,759 $7,693
Per Student ($)
Source: DBEDT, 2020 IES
Spending per student. The overall average annual spending per student for calendar year 2019
was $13,838, including both long-term and short-term students. As shown in table 3, the
average annual spending for long-term students was $32,759 ($15,760 for living expenses and
$16,999 for tuition/fees) and short-term students was $7,693 ($4,002 for living expenses and
$3,691 for tuition/fees). Table 4 below shows the direct impact (total spending by international
students) and total economic impacts on the economy of the State of Hawaii for the current
survey and the two previous surveys of the IES.
Table 4. Summary of Economic Impacts: 2017, 2018, and 2019
2017 2018 2019
(2018 IES) (2019 IES) (2020 IES)
Total Direct Spending $241,490,546 $216,865,847 $185,026,598
Output Multiplier 2.06 2.06 2.06
Earnings Multiplier 0.91 0.91 0.91
State Tax Multiplier 0.158 0.158 0.158
Employment Multiplier 21.8 21.1 20.3
(jobs per $m)
Total Output Generated $497,470,525 $446,743,645 $381,154,792
Total Income Generated $219,756,397 $197,347,921 $168,374,204
Total State Taxes Generated $38,155,506 $34,264,804 $29,234,202
Total Jobs Supported 5,264 4,576 3,756
Source: DBEDT, IES respective years
Page |7Financial aid to International students and net spending per student. Financial aid and
other resources are used as an incentive to attract international students. The total financial aid
for international students for calendar year 2019 was $4,573,448, which was significantly
above the $2,105,779 estimate for the previous year. It is important to note that these are
scholarships and grants offered by the institutions and do not include RA/TA assistance.
Generally, international students are eligible only for merit aid provided by the host
institutions. However, students who are U.S. permanent residents are also eligible for federal
financial aid, in addition to any available institutional aid. At most institutions, financial aid is
only provided for long-term students, those who are taking classes for credit and are working
towards completion of requirements for a degree.
At the undergraduate level for calendar year 2019, the average annual expense for tuition and
cost of living for a full-time international student in Hawaii was $29,006. These figures are
after the average annual financial assistance was subtracted, which reduced the total cost per
student by approximately $1,576 annually (Figure 2). The average tuition amount included
community colleges, which generally had lower tuition than the four-year universities.
At the graduate level for calendar year 2019, the average annual expense for tuition and cost of
living for a full-time graduate or professional international student in Hawaii was $41,982.
These figures were after the financial assistance was subtracted, which reduced the total cost
per student by approximately $541 annually (this does not include RA/TA assistance).
At the middle and high school level for calendar year 2019, the average annual expense for
tuition and cost of living was $39,467 per year after financial assistance was subtracted. The
financial aid in this category averaged $1,579 annually per student.
Increasing financial aid resources could boost competition among educational institutions in
attracting international students. In addition to attracting students, financial aid is an effective
tool to retain quality students.
Page |8Figure 2. Impact of Financial Aid for University International Students
2017 2018 2019
$51,064
$50,860
$42,523
$41,982
$41,718
$41,581
$30,582
$30,483
$30,191
$29,838
$29,781
$29,006
COST, UNDERGRADUATE NET ANNUAL SPENDING COST, GRADUATE NET ANNUAL SPENDING
(AFTER FINANCIAL AID), (AFTER FINANCIAL AID),
UNDERGRADUATE GRADUATE
Source: DBEDT: respective years of IES
Page |9Countries and places of origin of international students in Hawaii
Table 5 lists the top 25 countries and places of origin of international students for 2019. Japan
remains the top country of origin for Hawaii’s international students, comprising 31.6 percent
of the total. Japan was followed by South Korea with 14.4 percent, Switzerland with 9.0
percent, China (including Hong Kong and Macao) with 4.7 percent, and Germany with 2.9
percent.
Table 5. Places of Origin of International Students in Hawaii in 2019
Rank Country/Place No. of Students % of Total
1 Japan 4,219 31.6%
2 South Korea 1,922 14.4%
3 Switzerland 1,198 9.0%
4 China (PRC, HK, Macao) 634 4.7%
5 Germany 391 2.9%
6 France 348 2.6%
7 Philippines 257 1.9%
8 Taiwan 217 1.6%
9 Canada 209 1.6%
10 Brazil 157 1.2%
11 Sweden 146 1.1%
12 Tonga 144 1.1%
13 Norway 119 0.9%
14 Spain 114 0.9%
15 Italy 85 0.6%
16 Chile 82 0.6%
17 Vietnam 77 0.6%
18 New Zealand 76 0.6%
19 Thailand 73 0.5%
20 Mongolia 70 0.5%
21 Australia 69 0.5%
22 Netherlands 69 0.5%
23 Western Samoa 59 0.4%
24 Fiji 53 0.4%
25 French Polynesia 48 0.4%
Source: DBEDT, 2020 IES
In comparing 2019 with the 2018 rank order, the top two positions remained the same, Japan
and South Korea. Switzerland increased one position from fourth to third, while China dropped
from third to fourth. In addition to Japan, South Korea, and China, the Asian countries to place
in the top ten were the Philippines at seventh and Taiwan at eighth place in the rankings. For
the European countries, Switzerland and Germany were followed by France (sixth), Sweden,
(eleventh) and Norway (thirteenth).
P a g e | 10IV. CONCLUSIONS
The data presented in this report were the results of the 2020 Hawaii International Education
Survey. DBEDT received responses from 44 of Hawaii’s educational institutions with
international students. The total direct economic impact of international students for the 2019
calendar year was an estimated $185 million. This amount included tuition and fees plus living
expenses.
In addition to the direct impact, other economic benefits of international students for the 2019
calendar year were:
• $381.2 million added to the state’s total economic output, including direct, indirect, and
induced effects.
• $29.2 million in state taxes was generated.
• $168.4 million in household earnings can be attributed to international students.
• 3,756 jobs were supported by international student spending.
The overall average annual per student spending was $13,838, including living expenses and
tuition and fees across all programs in 2019.
The amounts above do not include contributions from foreign schools to Hawaii, such as
school excursions and other education-related travel. These education-related trips from high
schools and colleges from abroad are an important contribution to Hawaii’s economy.
However, as of this writing, comprehensive data was not available, and the effects of
education-related travel is an area for future research. Furthermore, this report did not cover
COVID-19 related impacts on international student enrollments; however, these will be
examined in the 2021 report.
Hawaii’s educational institutions hosted a diverse group of students from all over the globe,
with an estimated 13,371 international students. In addition to their annual expenditures,
international students are the leaders of tomorrow that will bridge Hawaii with the global
economy.
P a g e | 11APPENDIX I: 2020 Hawaii International Education Survey
(calendar year 2019 data)
International Education Online Survey
Department of Business, Economic Development & Tourism
1. CONTACT INFORMATION
Name
Institution
Address
City/Town
Zip Code/Postal Code
Email Address
Phone Number
2 through 4. ENROLLMENT
Please choose the most applicable category or categories, then provide the number of enrollment:
Spring 2019 Summer 2019 Fall 2019
Total enrollment
INTERNATIONAL Students
Middle/high school students
Degree-seeking undergraduate students
Non-degree-seeking undergraduate students
Degree-seeking graduate students
Non-degree-seeking graduate students
5 & 6. Please indicate the international student enrollment numbers for the total calendar year of
2019 (combined spring, summer, fall) by each of the following categories. Please indicate the
average program length in days for calendar year 2019 for each of the following categories (if there
were multiple programs, please report the average number of days for each respective program
category). If you need to clarify your answers, you may do so in Question 21.
Number of Length of
enrollment Program (days)
Short-term training program students/professionals
Students in summer/winter camps
Visiting scholars/teachers
7. Please indicate the number of family members accompanying international students/trainees (via
invitation letter from your institution). _______________
P a g e | 128 through 11. TUITION AND FEES: Please indicate the cost of tuition and fees for the following
categories of international students & scholars (Spring, Summer, Fall for long-term; calendar year
for short-term programs). Please specify the time period (e.g. per week, per month, per x-week
term, per year).
Cost of tuition & fees
Middle/high school students
Degree-seeking undergraduate students
Non-degree-seeking undergraduate students
Degree-seeking graduate students
Non-degree-seeking graduate students
Short-term training program
students/professionals
Students in summer/winter camps
Visiting scholars/teachers
12 through 15. COST OF LIVING: Please indicate the cost of living for the following categories of
international students & scholars (Spring, Summer, Fall for long-term; calendar year for short-
term programs). Please specify the time period (e.g. per week, per month, per x-week term, per
year).
Cost of living
Middle/high school students
Degree-seeking undergraduate students
Non-degree-seeking undergraduate students
Degree-seeking graduate students
Non-degree-seeking graduate students
Short-term training program
students/professionals
Students in summer/winter camps
Visiting scholars/teachers
16. FINANCIAL ASSISTANCE: For calendar year 2019 (January through December), please indicate
the lump sum amount of financial assistance through tuition waivers, scholarships, and any other
financial assistance to INTERNATIONAL students/scholars in US dollars (i.e. add up all the
financial support given to students in that category and report the amount).
Dollar amount
Middle/high school students
Degree-seeking undergraduate students
Non-degree-seeking undergraduate students
Degree-seeking graduate students
Non-degree-seeking graduate students
Short-term training program
students/professionals
Students in summer/winter camps
Visiting scholars/teachers
P a g e | 1317 through 19. PLACE OF ORIGIN (for Spring, Summer, Fall)
Number of students
American Samoa
Argentina
Australia
Belgium
Brazil
Cambodia
Canada
Chile
China, PRC
China, Hong Kong
China, Macao
Colombia
Costa Rica
Czech Republic
Denmark
Ecuador
Egypt
Fiji
Finland
France
French Polynesia
Germany
Greece
Hungary
India
Indonesia
Iraq
Ireland
Israel
Italy
Japan
Jordan
Kazakhstan
Kenya
Kiribati
South Korea
Laos
Lebanon
Lithuania
Malaysia
Marshall Islands
Mexico
Micronesia
Mongolia
Morocco
Nepal
Netherlands
New Zealand
P a g e | 14Nicaragua
Norway
Pakistan
Palau
Peru
Philippines
Poland
Portugal
Romania
Russia
Saudi Arabia
Singapore
Slovakia
South Africa
Spain
Sri Lanka
Sweden
Switzerland
Taiwan
Thailand
Tonga
Turkey
Ukraine
United Kingdom
Uruguay
Venezuela
Vietnam
Western Samoa
Other (Please Specify)
P a g e | 15APPENDIX II: List of the Educational Institutions Surveyed (calendar year 2019
data).
Table AII.1: The list is based on the US Department of Homeland Security’s (DHS)
database called SEVIS (Student and Exchange Visitor Information System):
Flight Schools
Mauna Loa Helicopters Flight School 73-310 Uu Street
Kailua-Kona, HI, 96740
Language Schools
Academia Language Language School 1600 Kapiolani Blvd. Suite 1215
School Honolulu, HI, 96814
EF International Language Language Schools EF International Language Schools, Inc.
Schools, Inc. Honolulu, HI, 96815
ELS Language Language Schools Hawaii Pacific University
Centers/Honolulu Honolulu, HI, 96813
Institute of Intensive Language School 2155 Kalakaua Avenue, Suite 700
English, Ltd. Honolulu, HI, 96815
Intercultural Language Schools 810 Richards Street
Communications College Honolulu, HI, 96813
Hawaii English Language Language School 1395 Lower Campus Road, MC 13-1
Program Honolulu, HI, 96822
Global Village Hawaii Language Schools 1440 Kapiolani Blvd.
Honolulu, HI, 96814
Maui Language Institute Language School 310 W Kaahumanu Avenue
Kahului, HI 96732
Massage/Beauty/Cosmetology/Alternative Medicine
Aisen Shiatsu Chiryo Doin Massage School 1314 South King Street, Suite 601, Honolulu,
HI 96814
Hawaii Massage Academy Massage School 1750 Kalakaua Avenue Suite 3004
Honolulu, HI, 96826
Institute of Clinical Alternative 100 N Beretania Street, Suite 203 B
Acupuncture and Oriental Medicine Honolulu, HI, 96817
Medicine
Makana Esthetics Wellness Beauty School 560 N Nimitz Hwy Ste 125D
Academy Honolulu, HI, 96817
Primary/Secondary Schools
American Renaissance Primary/Secondary 300 Franklin Ave
Academy School Kapolei, HI 96707
Asia Pacific International Secondary School 54-230 Kamehameha Hwy
School Hauula, HI, 96717
Haleakala Waldorf School Secondary School 4160 Lower Kula Road
Kula, HI, 96790
Hanahauoli School Primary School 1922 Makiki St,
Honolulu, HI 96822
Hanalani Schools Secondary School Admissions Office
Mililani, HI, 96789
P a g e | 16Hawaii Baptist Academy Secondary School 2429 Pali Highway
Honolulu, HI, 96817
Hawaii Preparatory Primary/Secondary 65-1692 Kohala Mountain Road
Academy School Kamuela, HI, 96743
Hawaiian Mission Primary/Secondary 1415 Makiki Street
Academy School Honolulu, HI, 96814
Hongwanji Mission School Secondary School 1728 Pali Highway
Honolulu, HI, 96813
Honolulu Waldorf School Primary/Secondary 350 Ulua Street
School Honolulu, HI, 96821
Iolani School Secondary School 563 Kamoku Street
Honolulu, HI, 96826
Island Pacific Academy – Secondary School 909 Haumea Street
Upper School Kapolei, HI, 96707
Kaimuki Christian School Secondary School 1117 Koko Head Avenue
Honolulu, HI
Kohala High School Secondary School 54-3611 Akoni Pule Hwy,
Kapaau, HI 96755
La Pietra Hawaii School Secondary School 2933 Poni Moi Road
for Girls Honolulu, HI, 96815
Makua Lani Christian Secondary School 74-4966 Kealakaa Street
Academy Kailua-Kona, HI, 96740
Maryknoll School Secondary School 1526 Alexander Street
Honolulu, HI, 96822
Maui Preparatory Secondary School 4910 Honoapiilani Highway
Academy Lahaina, HI, 96761
Le Jardin Academy Secondary School 917 Kalanianaole Highway
Kailua, HI, 96734
Parker School Primary/Secondary 65-1224 Lindsey Rd
School Kamuela, HI 96743
Punahou School Primary/Secondary 1601 Punahou Street
School Honolulu, HI, 96822
Sacred Hearts Academy Secondary School 3253 Waialae Avenue
Honolulu, HI, 96816
Saint Anthony Primary/Secondary 148 Makawao Street
School Kailua, Hawaii 96734
Saint Louis School Secondary School 3142 Waialae Avenue
Honolulu, HI, 96816
Seabury Hall Secondary School 480 Olinda Road
Makawao, HI, 96768
St. Joseph School of Hilo Secondary School 1000 Ululani Street
Hilo, HI, 96720
The St. Andrew's Schools Secondary School 224 Queen Emma Square
Honolulu, HI, 96813
Trinity Christian School Secondary School 1110 A Kailua Road
Kailua, HI, 96734
Mid-Pacific Institute Primary/Secondary 2445 Kaala Street
School Honolulu, HI, 96822
P a g e | 17Post-secondary Institutions – University/College
Brigham Young University/College 55-220 Kulanui Street
University-Hawaii Laie, HI, 96762
Central Pacific College University/College 1833 Kalakaua Avenue Suite 510
Honolulu, HI, 96815
Chaminade University of University/College 3140 Waialae Avenue
Honolulu Honolulu, HI, 96816
Hawaii Pacific University University/College 1164 Bishop Street
Honolulu, HI, 96813
Hawaii Tokai University/College 91-971 Farrington Highway
International College Kapolei, HI, 96707
International Mid Pac University/College 1311 Kapiolani Blvd. 200-5
College Honolulu, HI, 96814
University of the Nations, University/College 75-5851 Kuakini Highway
Kona Kailua-Kona, HI, 96740
Wayland Baptist University/College 95-1091 Ainamakua Drive
University – HI Mililani, HI, 96789
University of Hawaii System
Hawaii Community University/College 200 W. Kawili Street
College Hilo, HI, 96720
UH Center at West Hawaii University/College 81-964 Halekii Street
Kealakekua, HI, 96750
Kapiolani Community University/College 4303 Diamond Head Road
College Honolulu, HI, 96816
Kauai Community College University/College Kauai Community College - University of
- University of Hawaii Hawaii
Lihue, HI, 96766
Leeward Community University/College 96-045 Ala Ike
College Pearl City, HI, 96782
Honolulu Community University/College 874 Dillingham Blvd.
College Honolulu, HI, 96817
University of Hawaii at University/College University of Hawaii at Hilo
Hilo Hilo, HI, 96720
University of Hawaii at University/College University of Hawaii at Manoa,
Manoa OVCAA/OIEP/ISS
Honolulu, HI, 96822
University of Hawaii at University/College Outreach College
Manoa - Outreach College- Honolulu, HI, 96822
UHM
University of Hawaii Maui University/College University of Hawaii Maui College
College Kahului, HI, 96732
Windward Community University/College 45-720 Keaahala Road
College Kaneohe, HI, 96744
University of Hawaii Law School 2515 Dole Street
William S. Richardson Honolulu, HI, 96822
School of Law
University of Hawaii Medical School 651 Ilalo Street
John A. Burns School of Honolulu, HI, 96813
Medicine
P a g e | 18Educational Exchange Programs
Japan-America Institute of Educational JAIMS
Management Science Exchange 6660 Hawaii Kai Drive
(JAIMS) Honolulu, HI, 96825
Travel Institute of the Educational 1314 South King Street, Suite 1164
Pacific Exchange Honolulu, HI, 96814
P a g e | 19APPENDIX III: Total Economic Impact of International Students within the
University of Hawaii System on the State’s Economy
1. Direct Economic Impact. Table AIII.1 presents a summary of the direct impact of
University of Hawaii’s international students to the state’s economy. It is based on
international student expenditures for tuition/fees and living expenses. The table includes
the contributions of long-term and short-term students and is categorized by the type of
program.
Table AIII.1: Direct Economic Impact of International Students for the University
of Hawaii System, 2019
Category of International Number of Spending by International Total
Students Students Students:
Tuition & Living
Fees Expenses
Long-Term Students 1,189 $29,140,104 $21,246,440 $50,386,544
Degree-seeking undergraduate 602 14,752,753 10,864,609 25,617,362
students
Degree-seeking graduate 587 14,387,351 10,381,831 24,769,182
students
Short-Term Students 3,937 $12,935,206 $20,880,942 $33,816,148
Non-degree seeking 1,351 10,722,167 13,403,191 24,125,358
undergraduate students
Non-degree seeking graduate 14 310,144 219,713 529,857
students
Short-term training program 1,902 1,646,163 1,367,982 3,014,145
students/professionals
Students in summer/winter 346 256,732 220,056 476,788
camps
Visiting scholars/teachers 324 0 5,670,000 5,670,000
Total 5,126 $42,075,310 $42,127,382 $84,202,692
Source: DBEDT, 2020 Hawaii IES
The above figures are aggregated from the following University of Hawaii related institutions:
Hawaii Community College, Honolulu Community College, Kapiolani Community College,
Kauai Community College, Leeward Community College, Windward Community College,
Maui Language Institute at Maui College, UH-HELP, UH-Hilo, UH-Manoa, UH-William S.
Richardson School of Law, UH-Outreach, and UH-West Oahu.
P a g e | 202. Total Economic Impact and Number of Jobs Supported. The total economic impact for
the state included both the direct, indirect and induced impacts. The multipliers used for this
calculation are taken from The Hawaii State Input-Output Study: 2012 Benchmark Report
(August 2016). Type II final demand multipliers were used, which include direct, indirect, and
induced effects.
Tables AIII.2 summarizes the results and shows the economic impact of international students
studying at various campuses across the University of Hawaii System. The total output
generated is an estimate of the total dollar change in output in all industries in the state, resulting
from international student expenditures (living expenses and tuition/fees) attending the
University of Hawaii. Based on the direct-output of $84.2 million, the total output generated by
international students for the University of Hawaii System was estimated at $173.5 million (Type
II multiplier) for calendar year 2019.
Table AIII.2: Economic Impact of International Students within the University of
Hawaii System on the State’s Economy
Final Demand Economic
Multiplier (Type II) Impact (Type II)
Total Output Generated 2.06 $173,457,546
Total Household Income Generated 0.91 $76,624,450
Total State Taxes Generated 0.158 $13,304,025
Total Number of Jobs (2019) 20.3 (per $million) 1,709
Source: DBEDT, calculations are based on the Hawaii State Input-Output Study: 2012 Benchmark Report
(August 2016)
Total household income generated refers to the estimated household earnings that can be
attributed to international students studying within the University of Hawaii system. Hawaii
households earned an estimated $76.6 million generated from University of Hawaii’s
international students for calendar year 2019.
The total state taxes generated line shows the estimated tax revenue that can be attributed to
international students studying within the University of Hawaii system. An estimated $13.3
million in state taxes was generated by University of Hawaii’s international student spending
for calendar year 2019.
The last line of the table shows the total number of jobs supported by international students
studying within the University of Hawaii system. Given an estimated direct economic impact
of $84.3 million for calendar year 2019, 1,709 jobs were supported. As noted above, these
estimates are based on the Type II multiplier, which includes direct, indirect, and induced
effects.
P a g e | 21You can also read