TUT Student Bus Transport System: A Case Study - IEOM Society
←
→
Page content transcription
If your browser does not render page correctly, please read the page content below
Proceedings of the 2014 International Conference on Industrial Engineering and Operations Management
Bali, Indonesia, January 7 – 9, 2014
TUT Student Bus Transport System: A Case Study
Venessa Ranjit
University’s Logistical Services
Tshwane University of Technology
Pretoria South, Africa
Semira Mohammed
Council for Scientific and Industrial Research (CSIR)
South Africa
Abstract
With the merger of the former Technikon Northern Gauteng, Technikon North-West and Technikon Pretoria,
Tshwane University of Technology (TUT) inherited the need to link all of its five campuses located in different
parts of the City of Tshwane through a student bus transport system. The challenge for the provision of such a
service grew with the increase of its student body to more than 50,000, close to 10% of whom reside on TUT off-
campus residence facilities. These residence students are also provided with a bus transport service to access their
campuses. The recent steep fuel cost hikes have brought forward the issue of transport cost. Historically transport
was not taken into account for any decisions taken by facilities management. Student residences were leased
amongst others, according to affordability of the facility, irrespective of their location and without considering the
financial implications of such decisions. University facility managers are now realizing the huge financial savings
that can be made by factoring in transport cost in their decision making processes. TUT commissioned a study to
investigate the possibility of reducing the operational cost of its student bus transport services. The study was carried
out by the CSIR. There are many possible scenarios emanating from the study, however this paper is limited to the
scope of the undertaking to develop a financial model for the bus service, undertake scenario modelling for the
service, and to furthermore establish the financial implications on the results of the study and to propose possible
recommendations to TUT. The study utilized the basic public transport service design principles and the fully
allocated transport cost model. Passenger counts were carried out on the existing TUT bus routes to enable profiling
the demand for the service and supply of the service. Based on the findings of the study, practical recommendations
were made to TUT. The presentation will focus on the lessons learned from the TUT student bus transport service
study. It will highlight the implications of transport costs within the facilities management finances as well.
Recommendations in relation to curbing costs and generating enough revenue to cover the cost of the service will
also be discussed.
1. Introduction
The transport unit within the Logistical Services Directorate of the University acquired the responsibility to transport
residence students between their official residences and their relevant academic learning site. Provision is also made
for the non-resident students who wish to use the bus transport from the Pretoria main campus to their respective
learning campus within the Tshwane Metro Region. Both these student commuter groups pay for the usage of the
bus transport service. TUT is not licensed as a public transport company and may therefore not compete with other
public transport service companies. Bus transport services are not a core business of TUT. Therefore the unit has,
however, outsourced the service to external contractors by means of a public tender procurement process. The unit
also offers an inter-campus bus shuttle service, thus allowing the ease of movement for students to reach their
designated destination to utilize the Universities facilities. However the following key constraints are:-
TUT may not render transport service on any route that is already being serviced by any public transport
service provider with a valid licence to service such a route, and
It may not pick-up or drop-off any of its students along any of the authorised routes except at their official
TUT facilities.
1919
2. Purpose of Study
Logistical Services which forms part of the Universities Institutional Support Operations Management, has to render
a bus transport service to its student community on a break-even basis, i.e., to recover the actual cost of providing
the bus transport service from the fees charged without necessarily making any profit or losses. TUT also acquired
permission to provide bus transport services on the following routes which are also defined as public routes, but are
not serviced by an official Metro Council or contractor to the relevant Metro Council:-
Route between Arcadia Campus and the Pretoria West Campus.
Route between Soshanguve North Campus and Soshanguve South Campus.
The site maps in Figure 1-3 below show the extensive distances between the Tshwane campuses and the off-campus
residences where bus transport service is provided.
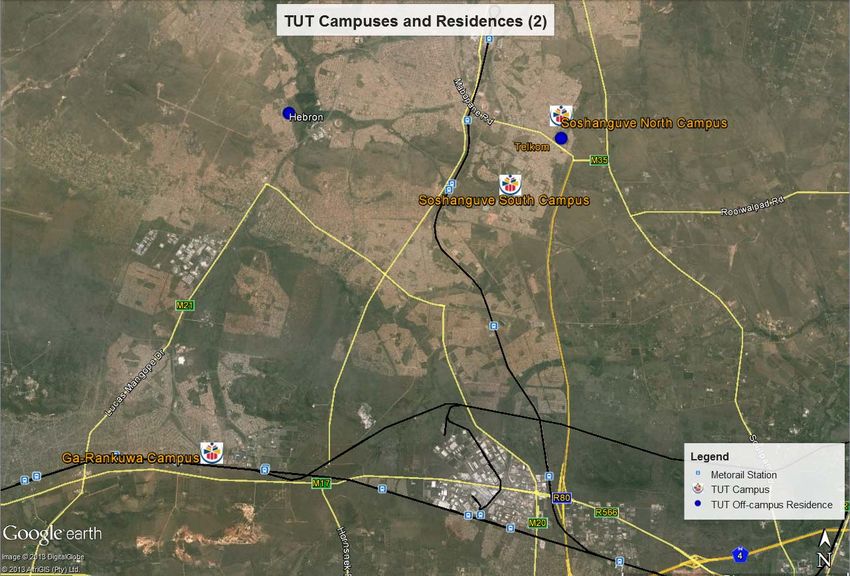
Figure 1: Location map of TUT facilities in Central Tshwane Metro Region
Figure 1 above indicates the Pretoria West (Main campus), Arcadia and Arts campuses that are located in the central
area of the Tshwane Metro. Of the nine off-campus residences, West City and Muzinda residences lie approximately
10km west of the Pretoria West campus while Monitor residence is 4.5km east of the campus. The rest (Legae,
Tempo, Kollegehof, Heidehoff and Drie Lelies) are within 10km diameter from the Arcadia campus.
Figure 2: Location map of TUT facilities in the North-west of Tshwane Metro Region
Figure 2 above indicates the two Soshanguve North and South and the Ga-Rankuwa campuses that lie in the far
north western part of Tshwane and +35km from the CBD. The Drie Lelies residence is currently occupied by mostly
Ga-Rankuwa students who commute 37km daily on TUT buses and the Hebron residence which also accommodates
Ga-Rankuwa campus students is located 15km further north of the campus and it is closer to the Soshanguve
campuses.
1920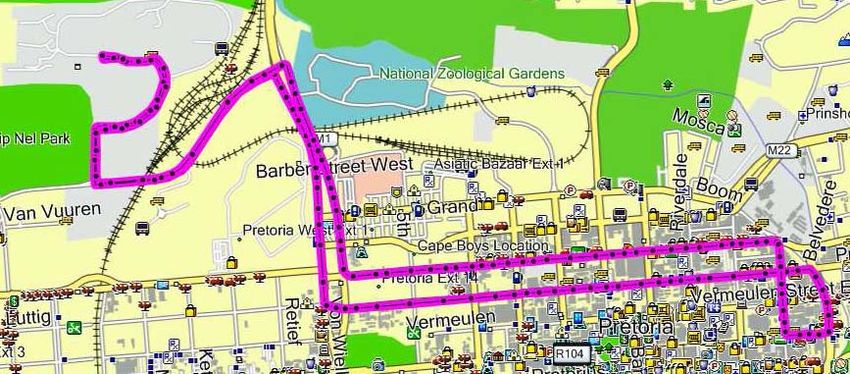
Figure 3: Radius indicator from Pretoria West Campus to Soshanguve North and South campuses.
Figure 3 indicates the 25km radius from the Pretoria West Main Campus to the Soshanguve North and South
campuses. The Ga-rankuwa campus is closer to the Pretoria West Main campus.
3. Methodology
The case study consists of two complementary data collection methods with their objectives. Detailed interviews
and consultations with TUT staff allowed CSIR to clearly define the scope of the study. These collations of
information assisted in the review of the current TUT bus transport operations. The data collated from the interviews
regarding the bus transport service was mainly related to the financial situation. Following a number of consultations
with TUT during the course of the study, a number of design principles were formulated.
The survey conducted for passenger count on the intercampus bus service routes analyzed the demand and supply
profiles, whilst the residence survey allowed for the determination of the number of buses to fulfill the residence
capacity demand and hence the design principles to address the cost implications. There was no reliable data
available regarding the current ridership on their transport service to enable service design. The study conducted
passenger count on the inter-campus routes to get a more accurate service demand and supply profiles. Guided by
those principles and the results from the passenger count survey, the maximum number of buses and other service
operations aspects were designed for each of the current inter-campus routes. A similar approach was also adopted
for the design of the residence shuttle service except where demand estimates were required, in which case, the
house capacities were used. Alternative residence shuttle routes were also investigated and their effect on the vehicle
resources required.
Finally, recommendations were deduced from the findings, including benchmarking with best practices with regards
to cost recovery.
3.1. Limitations of the study
The service design provided in the study has the following limitations that need to be considered prior to
implementation.
Where applicable, sensitivity analysis and assessment were done to inform TUT how any changes in the
assumptions would influence the results.
Bus numbers and frequencies are designed based on actual demand for the inter-campus service as
measured during the study and may change significantly during the exam periods.
For the residence shuttle design, the demand is influenced by the total capacity of the residences serviced
on the routes.
Service designs are only for the weekdays and do not include weekends.
Unit costs of the existing service contracts entered into with operators are fixed with agreed annual increases.
19214. Design Principles
The design principles were formulated via the TUT staff consultation process bearing the following restrictions:-
No campus destination would require more than one transfer from any of the Tshwane Campuses.
Soshanguve North and Soshanguve South campuses are treated as one campus in this respect due to the
short distance between them. The Arts campus is not part of any of the inter-campus bus routes.
Services are classified as inter-campus service and residence shuttle service. Each classification may only
cross-subsidize within their respective classes and not between each other. Inter-campus service costs
should be recovered by revenue from students using the inter-campus service only and those of the
residence shuttle service from the residence students only.
It is assumed that the buses operate strictly based on the officially designed TUT routes and no interchange points
are allowed except at TUT facilities.
The following service design models were developed for this study.
Intercampus service model and,
Residence design model.
4.1. Intercampus bus model
The inter-campus bus services operate only in Tshwane Metro where there is a need to connect the TUT campuses.
The bus routes that service the five Tshwane campuses together with their distances and the maximum number of
buses operating on the route (peak period) as provided by the Logistical/Transport Services are shown in Table 1.
Table 1: TUT Inter-campus Bus Service
ROUTE ROUTE DISTANCE (KM) NUMBER OF BUSES
Pretoria West-Arcadia 7.5 10
Pretoria West - Soshanguve South 36 6
Ga-Rankuwa-Pretoria West 35 4
Ga-Rankuwa-Soshanguve South 18 2
Soshanguve North - Soshanguve South 3.5 6
Table 1above indicates the five Tshwane campuses together with their distances and the maximum number of buses
operating on the route (peak period) as provided by the Logistical/Transport Services unit of TUT. Distances
between campuses have a significant influence on the extent of resources required and the service costs. The
distance to Pretoria West from the Soshanguve South campus and Ga-Rankuwa campus is 35-36km whereas only
3.5km separates Soshanguve South from Soshanguve North. Assuming these routes operate at the same speed and
service the same demand, the number of buses required for Pretoria West – Ga-Rankuwa or Pretoria West –
Soshanguve South would be 10 times that for Soshanguve South – Soshanguve North route. This means that the
nominal cost is ten times more and thus to break even, the passengers fare need to be increased proportionately.
The following are two ways that determine the frequency/headway of a service.
1. Policy head ways - where specific headways that meet the policy goals are determined. Tut does not have a
headway policy.
2. Demand based headways - is based on managing demand at the peak load point along the route. The peak
load point is that point along the route that experiences the largest number of passengers per hour. The
headway is determined by the minimum number of buses required per hour to make sure that a particular
load factor is not violated.
For each TUT route the following inputs are required:
Length of route (km)
Average speed on route (km/h)
Layover time (min) –loading and unloading time at the start and end of a route
Peak demand on route (pax/h)
Vehicle seating capacity (seats/vehicle)
Load Factor –ratio of passengers actually carried versus the total passenger seating capacity of a vehicle. A
load factor of greater than 1.0 indicates that there are standees on the vehicle.
1922 Operating hours (h) –Length of time periods when service is provided, e.g., if service is operated from
06:00 to 18:00, operating hours is 12.
Once the above parameters are specified, the following was calculated.
Cycle time - is the time for one vehicle to make a complete cycle of the route.
Cycle Time (min) = (2 x Length of route x 60/Speed on route) + Layover time
The peak demand – this is the highest demand at the peak load point on the route, in the peak direction and
at the peak time of the day given in passengers per hour.
Headway (min) = Vehicle seating capacity x Load Factor x 60
Peak demand
Number of vehicles required to service the route.
Number of vehicles = 2 x Length of route x Peak demand + Peak demand x Layover time
Speed x Seating capacity x Load Factor Seating capacity x Load Factor x 60
The vehicle hours and the vehicles km
Daily vehicle hours = Number of Vehicles x Operating Hours
Daily vehicle km = Number of trips x Length of route
The headway and number of vehicles thus calculated are rounded to the nearest practical whole numbers and the
new cycle time and route capacity is calculated by rearranging terms in the equations above. The new cycle time and
route capacity should not be less than the cycle time and peak demand initially used.
Hence the number of vehicles used, vehicle hours and vehicle kilometres for each route is then used in the cost
allocation model.
4.1.1. Supply and Demand Profiles
Figure 4 above indicates the CBD bus route map depicted in pink, from Pretoria West to Arcadia . This is one of the
busiest yet shortest of the routes. Soshanguve North – Soshanguve South route is the other busiest bus route. These
two routes are relatively short and yet require high number of buses which is a clear indication of high frequency
service.
Figure 4: Indicates the Shortest yet busiest routes on the bus service schedule.
The route that connects Pretoria West campus to the Arcadia campus is the busiest of all the inter-campus routes
serving close to 10,000 passenger trips a day. It runs through the central business district (CBD) area of the city as
shown in Figure 4. It is operated by 10(ten) STABUS buses on a fixed 5 year contract basis scheduled to expire in
2015.
1923Graph 1: Shows the demand for the Arcadia –Pretoria West.
Graph 1 above demonstrates the demand for the Arcadia – Pretoria West direction.
The demand for the service is relatively high between 7:00 and 9:00 reaching 841pax/h as expected since the route
services about 50% of the registered student population. This demand is high while during the same period the
demand for the opposite direction, i.e., Pretoria West – Arcadia is at only 78pax/h, as seen in Graph 2 below.
Graph 2: Shows the demand for the Pretoria West –Arcadia.
Graph 2 above demonstrates the demand for the Pretoria West - Arcadia direction. In graph 2, the reverse occurs to
graph 1. Between 13:00 and 18:00 the demand for the Pretoria West – Arcadia is about double that for the Arcadia –
Pretoria West direction. Beyond 18:00 the demand reduces significantly to less than a quarter that of peak period.
4.2. Residence Design Model
The Residence design model, takes into account the student population at the various residences. Anecdotal
evidence suggests for a given route length, the higher the travel speed, the lower the travel time. A reduction in
travel time translates into shorter cycle times and higher number of vehicle trips. An increase in the number of
vehicle trips means potential increase in volumes of passenger movement for a given period.
1924TUT operates nine routes connecting nine off-campus residences to their facilities within the City of Tshwane. In
addition, three residences in eMalahleni and Nelspruit are serviced by two shuttle services to their respective TUT
campuses. These are listed in Table 11 below together with their assigned number of buses and route distances.
Table 2: TUT Residence Shuttle Service Routes
ROUTE ROUTE DISTANCE (KM) NUMBER OF BUSES
Kollegehof/Heidehof/Arcadia 10 1
Legae/Tempo/Arts/Arcadia 8.5 1
Monitor/Pretoria West 4.5 1
Tempo/Kollegehof/Pretoria West 15 1
Muzinda/Pretoria West 8 4
West City/Pretoria West 10 5
Drie Lelies/Ga-Rankuwa 37 5
Hebron/Ga-Rankuwa 15 4
eMalahleni Campus 1.4 1
Nelspruit Campus 8 3
Total Number of Buses 26
Residence students are provided with a premium door-to-door shuttle service. The cost of running such a service is
relatively high and proportionately requires additional funds. Currently, however, TUT does not charge residence
students equivalent fees to fully cover the costs for this service.
All buses operate on a fill up and go basis during the peak demand hours. Timetables are inaccurate in their
assumptions that all the buses assigned to the routes will be available at the indicated time. The cycle times of most
of the routes do not allow for all the buses allocated to the route to be on schedule. The capacity of each of the off-
campus residences serviced is provided in Table 3.
Table 3: Off-campus Residence Capacity
Residence Capacity (Students)
Heidehof 328
Monitor 296
Kollegehof 218
Tempo 145
Legae 259
Muzinda 601
West City 1022
Telkom 512
Hebron 384
Drie Lelies 542
Mebala (Nelspruit) 124
Urban Cove (Nelspruit) 157
Mabaleng (eMalahleni) 198
4.2.1. Residence Shuttle Service Recommendations
TUT has a policy of providing students with transport that enables them to participate in academic, cultural and
sporting activities. To fulfil this policy, it operates a highly subsidized bus transport service for its students which is
managed through its Logistical/Transport Services Unit. This undertaking is costly and it needs to be understood that
student residence placement plays a vital part. Information should be provided to the students on the financial
implication of where they take up residence to enable them to budget for their transport needs.
19255. Cost Recovery
In the case of TUT, the sprawl of its satellite campuses to areas as far as 35km from the Pretoria West campus adds
more strain to its transport services.
The principal goal for TUT is to provide the transport service to its students on a break-even basis. The cost of the
transport service is currently paid through transport levy collected from all the residence students; whether they use
the service or not and non- residence students who choose to use the service. Revenue from the transport levy still
doesn't match up to the cost of the service and the university injects an average of 35% subsidy annually. Transport
services still ends up with a deficit annually as the total revenue from the transport levy and the TUT central budget
comes short of recovering the cost of the service.
In 2012, revenue from students amounted to only 30% of the cost of providing the bus transport service. In 2013, the
cost recovery improved dramatically with the introduction of compulsory transport levy of R1600 to all residence
students and the same amount for willing day students (non-residence students). Currently, close to 19% of students
registered in Tshwane campuses participate in the levy system. So far, revenue from the transport levy amounts to
59% of the cost of the transport service (Refer Table 5 below).
Table 4: The current annual cost of TUT’s student bus transport service
SERVICE Type of No. of
ROUTE NAME PROVIDER Contract busses Monthly Cost Annual Cost
Intercampus bus service 28 R 2,283,024.00 R 27,396,288.00
Fixed (until
Pretoria – Arcadia Stabus 2015) 10 R 1,059,480.00 R 12,713,760.00
Soshanguve North - Fixed (until
Soshanguve South Stabus 2015) 6 R 282,528.00 R 3,390,336.00
Soshanguve to Ga-Rankuwa Stabus Annual 2 R 124,832.00 R 1,497,984.00
Soshanguve to Pretoria Stabus Annual 6 R 497,808.00 R 5,973,696.00
Ga-Rankuwa to Pretoria Stabus Annual 4 R 318,376.00 R 3,820,512.00
Residence shuttle service 26 R 2,196,484.72 R 26,357,816.64
Legae, Tempo, Kollegehof,
Monitor, Heidehof, West City, Fixed (until
and Muzinda Stabus 2015) 13 R 1,212,351.41 R 14,548,216.92
Fixed (until
Hebron to Ga-Rankuwa Amogelang 2015) 4 R 236,611.31 R 2,839,335.72
Fixed (until
Drie Lelies to Ga-Rankuwa Amogelang 2015) 5 R 441,450.00 R 5,297,400.00
David
Sekgobela & Fixed (until
Nelspruit Campus Assoc 2015) 3 R 229,554.00 R 2,754,648.00
David
Sekgobela & Fixed (until
eMalahleni Campus Assoc 2015) 1 R 76,518.00 R 918,216.00
Grand Total 54 R 4,479,508.72 R 53,754,104.64
1926Table 5: Current revenue to cover bus transport cost
Revenue Type Number of Levy Revenue
Students
Transport Levy from residence students 11532 R1600.00 R 18 451 200.00
Transport Levy from non-residence students 8268 R1600.00 R 13 228 800.00
Grand Total A 19800 R 31 680 000.00
% of Cost 59%
TUT subsidy B R 17 963 511.00
Annual cost of Bus transport R 53 754 104.64
Subtract Revenue A + B -R 49 533 511.00
(R4 110 593.64)
Table 5 above confirms the costs that TUT is currently outlaying apart from the levies recovered by students for this
service. Hence it is clear that there will be a continuation of this deficit growth if TUT does not promulgate an
adjusted student levy to fully recover the cost for the bus transport service to its students.
6. Conclusions and Recommendations
Table 6 above provides the template to be used by the University to determine the Route Summary as indicated in
the last 4 lines of the table, thus leading to the financial modelling of the bus transport cost. However the following
must be taken into cognizance for the University’s consideration to improve the financial contribution of the subsidy
provided to date.
Table 6: A Working Template to Remodel bus transport cost
Route Name PTA_ARC PTA_SOSHA GKW_PTA GKWA_SO SOSHAN_S
S SHAS OSHAS
Route Length – km – (L) 7 31 30.5 16 3.5
Average Speed – km/h – (S) 20 45 45 45 20
Layover – min – (Ta+Tb) 10 10 10 10 10
Compute
Cycle Time CT= (120*L/S)+Ta+Tb 52 92.66666667 91.33333333 52.66666667 31
Weekdays
Demand – pax/h – (D) 964 388 90 24 618
Seating Capacity – (C)- 63 63 63 23 63
Load Factor – (LF) 1.1 1 1 1 1.1
Compute
Headway -min- (H= C*LF*60/D) 4.313278008 9.742268041 42 57.5 6.72815534
Fleet number -NV – (CT/H) 12.05579606 9.511816578 2.174603175 0.915942029 4.607503608
USE
Fleet number - NV: 3 10 2 1 6
Headway 20 10 45 60 6
Operating Hours- P 4 14 10 9 15
Cycle Time: 60 100 90 60 36
Route Capacity (pax/h) 207.9 378 84 23 693
Number of Trips - NT 24 168 26.66666667 18 300
Total Vehicle Hour – VH- VH= NV*P 12 140 20 9 90
Total Vehicle Kilometers – VK – 168 5208 813.3333333 288 1050
VK=NT*L
Saturday
Demand – pax/h – (D) 100 100 100 100 100
Seating Capacity – (C)- 63 63 23 63 63
Load Factor – LF 1.1 1 1 1 1.1
Compute
Headway -min- (H= C*LF*60/D) 41.58 37.8 13.8 37.8 41.58
Fleet number -NV – (CT/H) 1.250601251 2.451499118 6.618357488 1.39329806 0.745550746
USE
1927Fleet number: 2 3 7 2 1
Headway 41 37 13 37 41
Operating Hours 4 4 4 4 4
Cycle Time: 82 111 91 74 41
Route Capacity (pax/h) 101 102 106 102 101
No Trips 12 13 37 13 12
Total Vehicle Hour – VH- VH= NV*P 8 12 28 8 4
Total Vehicle Kilometers – VK – 82 402 1126 208 41
VK=VH*S
Route Summary
Max Number of Buses 3 10 7 2 6
Total Vehicle Hour 20 152 48 17 94
Total Vehicle Kilometers 250 5610 1939 496 1091
6.1. Routes
Revise existing timetables to indicate at what times a bus is available on each stops for each route. Each off-campus
residence should only be serviced to the closest TUT campus. Students should be clearly informed of the financial
implication of taking up residence far from the campus of their study. Alternatively, if current residence routes are to
be maintained, transport services cost on residences that are connected to both Pretoria West and Arcadia campuses
(Tempo, Kollegehof and Legae) should be increased. This could be compulsory payment of inter-campus transport
levy as well as the residence shuttle transport levy on residence students.
6.2. Vehicle Size
Vehicles with bigger capacity usually require more capital and operating cost to run. While high capacity vehicles
could be economical where the demand matches the capacity, they are costly where demand is low.
6.3. Contracting
The cost allocation model attached with this document should be used negotiated contract or tender bus transport
service. TUT may also consider using Model Tender and Contract Documents developed by the Department of
Transport in terms of National Land Transport Act of 2009.
6.4. Fare Structure
It is strongly recommended that the current fare structure be revised based on the type of TUT transport services.
The residence shuttle service levy need to be R190/calendar month or R2279 annually to cover the residence shuttle
transport cost for the year 2013. Inter-campus transport levy should initially be set at an agreed upon amount,
ranging from R1400 to around R3500 annually for the year 2013. The cost of providing the residence shuttle service
is R2, 196,484.7 per month. Each of the 11567 resident's share comes to be R190/calendar month or R2279
annually. The annual increment should be considered when estimating the residence shuttle service transport levy as
they are all under the 5 year contract ending 2015.
6.5. Alternative Sources of Revenue
Bus services at universities are funded in a number of ways. University funds may be generated by students fees and
parking revenue. Some universities allocate institutional funds to support bus service.
6.6. Flexibility of Service Provision
The selected provider must have the capability to implement changes to the bus transport service as requested by the
TUT. These changes may include route alterations, both permanent and temporary, ability to add vehicles on a
temporary or permanent basis, the ability to add technology, and the ability to expand or reduce service within
reasonable ranges. The provider should agree to implement these changes, in most situations, as soon as possible
after the request has been made. In all but the most extreme cases, or where vehicles must be procured, all changes
should be implemented within 30-45 days (maximum) after request and agreement by both parties.
6.7. Service Level Expectations/Requirements
The terms of reference should include service level expectations for vehicle uptime, customer service, and training,
safety, and maintenance items. All contractors should be required to meet agreed upon service standards, and
understand and accept penalties for failure to adhere to these requirements. Reporting requirements should be
1928developed and enforced to help ensure that service levels are maintained in all areas. Technology is also a key factor
in verifying compliance with service standards. Monthly performance evaluations should be undertaken.
Biography
Venessa Ranjit is a Director of the University’s Logistical Services at Tshwane University of Technology, in
Pretoria South Africa. She earned a Masters in International Construction Management at the University of Bath,
UK. Her research interests are in construction contracting, development of small scale contractors and operations
management, and have published 3 conference papers to date. In her portfolio, Ms Ranjit is responsible for the
Universities facilities management, transport (bus and TUT allocated fleet), printing and the restaurants. She is a
board member of the South African Women’s Empowerment Foundation, and a council member of the CIOB-
Africa.
Semira Mohammed is a researcher at the Council for Scientific and Industrial Research (CSIR) in the field of
Transport Engineering. She obtained her BSc in Civil Engineering in 2004 in her home country of Eritrea and
moved to South Africa in 2006 to pursue her Masters studies in Transport Planning at the University of Pretoria. She
completed her Masters degree in 2008 and immediately joined the CSIR. Her research interests include public
transport, road safety, transport energy and the environment.
1929You can also read