Hidden Subsidies for Urban Car Transportation - Public Funds for Private Transport
←
→
Page content transcription
If your browser does not render page correctly, please read the page content below
Hidden Subsidies
for Urban Car
Transportation
Public Funds for Private
Transport

                               Funded by the
                           European Commission
                            Directorate General
                              for Environment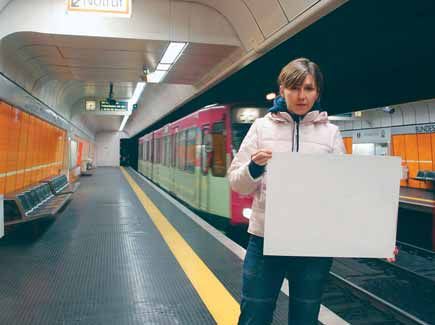
Every year local governments in Germany are estimated to spend some €15 bil-
lion on their car traffic. Only between 15% and 45% of these costs are recov-
ered by, for example, parking fees and contributions from regional and nation-
al government. The remainder is the equivalent of € 100 – € 150 for every citizen
paid from the local authority budget. Results from other European cities indi-
cate comparable subsidies. In the Austrian City of Graz, the net spending for
car transport is double the amount contributed to their public transport system
(see example further down).
There is growing consensus that government money should only be spent on
activities fostering sustainability. Spending money to subsidise car traffic sug-
gests the opposite. This leaflet explores what is behind the subsidies, and
what lessons can be learnt.
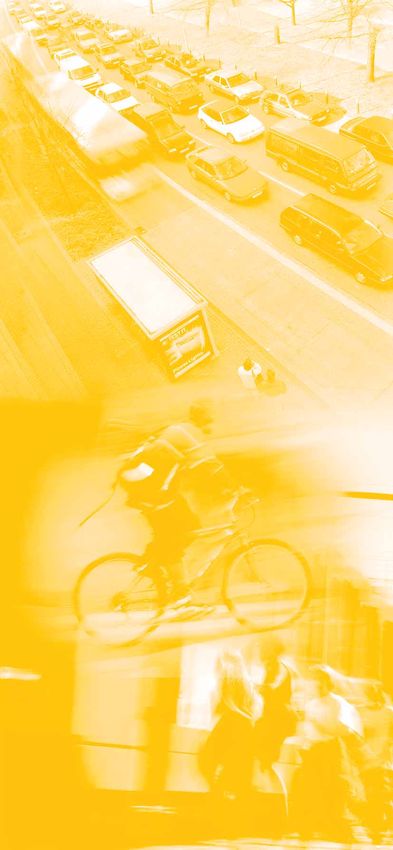
Urban Transport: the need for change
Urban areas suffer heavily from problems caused by the excessive use of the private car
– from congestion to air and noise pollution. Urban transport is not only a significant
contributor to climate change, but also the main source of fine particulate matters, the
pollutant causing many European Union (EU) cities to exceed the thresholds given in
the EU Urban Air Quality Directive.1
Large urban areas are not viable without public transport. The high density of inhabi-
tants and jobs makes space a very scarce resource. Public, bicycle and pedestrian
transportation are in many cases the only means of mobility available to the elderly
and young people living in suburban areas. The promotion of environmentally friendly
modes of transport, whilst reducing car traffic, is increasingly seen as central to any
strategy aimed at creating a sustainable urban environment.
Financing Public Transport
Given the tight budget situation in most European public authorities, subsidies for pub-
lic transport are increasingly being questioned and subjected to cuts. In order to create a
sustainable urban environment however, public transport would have to grow by 2%
each year, which could translate to an increase in subsidies. Significant differences
exist between European cities in terms of the development of public transport. While
passenger numbers in Bologna, Lisbon and Newcastle have been dropping annually by
more than 3% the last few years, they have increased annually in Strasbourg and Köln
by more than 4%.
In most European countries, local governments have traditionally provided urban pub-
Public Urban lic transport, either directly or through associated companies. This corresponds to the
Transport - insight that public transport is a social service provided by local governments to ensure
too heavily a certain level of mobility for everybody. Urban public transport, however, has moved
subsidised? from being a profitable industry with a high modal share, to a loss-making one with, in
most cases, a minority modal share. It is quite clear that there will still be a need for
subsidies in the future. Therefore, it is time to critically revise current practice in pro-
viding public transport.
The approach for identifying hidden subsidies
Public money is not only spent on public transport. Significant amounts are spent on
other modes of transport, namely in support of car transportation. At the same time,
the users of this transportation system, the car owners, contribute to its financing, for
example by taxes and parking fees.
The approach presented in this leaflet defines the difference between all public expen-
diture on car transportation and all public income derived from car transportation as
subsidies to car traffic. As it reflects the decisions made by local governments, it only
takes into account expenditure and income that directly come from, or is received by,
the local government. This means, for example, expenditures which are reimbursed
from higher levels of government (e.g. for works on national roads) are not counted as
subsidies by the local government. The environmental and health related costs of car
1 Council Directive 96/62/EC of 27 September transport are not considered in this analysis. Similarly income from other levels of
1996 on ambient air quality assessment and government (e.g. from fuel taxes) or the benefits of car transport (e.g. access of rural
management (OJ L296 21.11.1996) population to city) are not counted.
A million here, a million there – how much money
                                       do local governments spend?
                                       Local government expenditure on car transportation are mostly associated with build-
                                       ing roads. These costs certainly make up a significant share, but they are not the only
                                       costs. Local governments provide many more services directly linked to car transporta-
                                       tion, the main points being: maintenance of roads and green spaces alongside streets,
                                       traffic signals and lighting, traffic police, parking and the administration’s car fleet. It
                                       also has to be kept in mind that not all these costs are 100% related to car traffic, but
                                       also support other modes of traffic. Therefore each figure from the budget has to be
                                       looked at carefully to separate the costs for different modes of transport. Most of the
                                       time this is not possible, because the budgets are not detailed enough. In these cases,
                                       an estimate must be made. For example for roads, 80 – 90% of costs were generally
                                       allocated to car traffic, while 10% of the road is estimated to be used by other means
                                       of transport (in terms of space, time and deterioration).
                                       The following table provides some key figures on German cities, which may offer a
                                       good comparison because the framework conditions and responsibilities of local
                                       governments are similar. The comparison on the basis of per capita numbers shows
                                       that there are significant differences in the amounts that German cities spend. It is also
                                       interesting to see that cost-recovery levels (i.e. the proportion of expenditure covered
                                       by the income generated) vary significantly between 15% and 47%. The figures from
                                       Ferrara in Italy, Genève in Switzerland and Graz in Austria indicate that the situation in
                                       other European countries is comparable.

                Budget   Inhabitants           Income            Expenditure           Difference       Subsidy        Cost-
                year                          from car               for car                                 per    Recovery
                                        transportation        transportation                          inhabitant
Heidelberg      2004         142.500        13.137.822            30.634.581           17.496.759          122,8        42,9%
Rotenburg       2003          22.500            693.380            3.094.252            2.400.872          106,7        22,4%
Ludwigsburg     2000          86.936         9.090.874            19.293.557           10.202.683          117,4        47,1%
Düsseldorf      2002         569.046        24.699.867           167.106.878         142.407.011           250,3        14,8%
Lüneburg        2000          70.000         3.411.848             9.194.623            5.782.775           82,6        37,1%
Augsburg        2000         254.867        21.046.353            47.766.056           26.719.703          104,8        44,1%
Aschaffenburg   2002          67.788         3.041.045            11.366.940            8.325.895          122,8        26,8%
Freiburg        2000         201.000        17.163.087            37.993.383           20.830.296          103,6        45,2%
Ingelheim       2003          26.000         1.264.617             6.985.282            5.720.665          220,0        18,1%
Bremen          2000         547.000        12.551.020            72.959.184           60.408.163          110,4        17,2%
Dresden         2000         459.000         9.132.653            65.306.122           56.173.469          122,4        14,0%
Stuttgart       2000         581.000        20.663.265           104.591.837           83.928.571          144,5        19,8%
Average Germany (based on inhabitant numbers)                                                              145,5        29,1%
Graz            2003         238.000        20.832.664            60.959.484           40.126.820          169,0        34,0%
Geneve          2002         182.560        13.944.143            40.038.362           26.094.219          142.0        34,8%
Ferrara         2002         130.000         3.553.267             9.310.289            5.757.022            440        38,2%

                                       These figures do not differentiate between fixed subsidies, and those that could be
                                       avoided. For example spending money on traffic police might seem rather indispens-
                                       able. Providing a fleet of vehicles to city employees could, on the other hand, be seen
                                       as unnecessary. However, this publication leaves this discussion to the political arena.

                                        For German cities, administrations, councillors and citizens can assess the
                                        amount of hidden subsidies themselves, with the help of a calculation tool pro-
                                        vided by ICLEI at http://www.iclei.org/europe/ccp/arbeitsblaetter.pdf

                                       Results from Graz
                                       The City of Graz in Austria (238,000 inhabitants) has had a committed environmental
                                       policy in place for some time and has achieved some prominence through the Eco-
                                       Profit scheme, which supports local companies in cost-efficient environmental
                                       management. ICLEI researched its 2003 budget for hidden subsidies for car use and
                                       found that a total of € 60 million was spent through the local budget, while a total
income of € 21 million was achieved. This results in a cost-recovery of nearly 35% and
              a subsidy per inhabitant of € 169 per year.
              Looking into the details of the expenditure, it can be seen that about half of the support
              given to car transportation relates to the construction and maintenance of streets. The
              second highest cost of € 16.5 million in Graz was for traffic management, which includes
              traffic lights and signs, € 3.4 million was spent on parking fee collection, € 8 million on
              street lighting, and € 4.75 million on plants that line streets. The third highest cost of
              € 7.8 million was for the municipal car fleet which included fuel, maintenance and staff
              costs. The remaining € 8 million can be found in the general budget of the city, which
              includes staff costs for planning and management. The most striking costs in the budget
              are the € 500,000 annual rent for a car park, which is free to the public, and the
              € 300,000 that the environment unit of the city allocates to car transport.
              The income is split into three main areas. The main source of income is parking fees of
              € 10 million, although after deducting the costs of administration and assessment, only
              € 2 million remains. Further significant sources of income are citizens’ contributions to
Sustainable   development costs (€ 4.3 million) and contributions from regional and national govern-
              ments to street construction (€ 3.7 million).
Investment?
              It is worth highlighting that it is not possible to identify the subsidies for car transport
              from the annual budget alone. Because much of the street work is carried out by the
              city-owned company Wirtschaftsbetriebe and paid for by a varying fraction of a gener-
              al subsidy paid to this company, detailed information from the company’s books had to
              be used. Furthermore it was not possible to include the expenditure on construction and
              the maintenance of parking space at city-owned institutions, like schools, theatres, etc.
              No part of the administration was aware that they are paying for this free service. Final-
              ly, the traffic police in Austria is paid for by other governmental levels and thus not in-
              cluded.
              Graz is a city with a remarkable vision for its urban transport and the budget provides
              much evidence that this vision is reflected in practice. For example, only one third of
              the investment budget of the transport authority (excluding the Wirtschaftsbetriebe) is
              allocated to car transport, while two thirds goes into traffic restraints, tram lines, bicy-
              cle lanes etc. Furthermore, public transport receives some € 19 million in subsidies for
              running costs, which, including the investments, adds up to € 84 per inhabitant. But
              still, this is 50% less than the money spent on private car-use.

              Results from Genève
              The City of Genève in Switzerland (182.560 inhabitants) is situated in the centre of an
              agglomeration of nearly 1 million inhabitants, formed by the Canton de Genève
              (427.705 inhabitants) and the nearby Canton de Vaud and the part of France bordering
              the Canton de Genève. Many workers commute from the surrounding area, and conse-
              quently the traffic is quite dense in the city.
              For this study, ICLEI researched the municipal budget for 2002 for obvious and hidden
              subsidies for car traffic and found that local subsidies reached € 142 per inhabitant. In
              2002, a total of € 40 million was spent by the City of Genève, while a total income of
              € 14 million was achieved, resulting in a cost-recovery of almost 36%.
              In order to correctly understand the figures provided, it has to be said that in Genève,
              responsibilities for transport and mobility are shared between the City of Genève and
              the Canton, which are two separate administrations. It is the Canton that is responsible
              for everything connected to traffic regulation. The City of Genève is in charge of the
              maintenance of those streets situated on its territory. The same picture applies to the
              police, where responsibilities are also shared between the municipal administration and
              the Canton. As for public health, this is entirely the responsibility of the Canton.
              Expenditures by the Canton on motorised private transport are not taken into account in
              the present study, as the aim was to assess subsidies paid from the municipal budget
              only. It has to be stressed that if the spending of the Canton had been analysed, the sub-
              sidies for motorised individual transport per inhabitant would have probably been
              much higher.
              The biggest part of the expenditure for car transport in the City of Genève is, not sur-
              prisingly, road works (€ 18 million running costs), mainly spent on traffic moderation
operations and a more equitable share of road space between the different users. It has to be underlined that mobility related policy in Geneva is oriented towards the promo- tion of sustainable modes of transport (pedestrian, bicycles, public transport) in line with the Agenda 21 initiative of the city. Investments in street infrastructure of about € 10 million have to be added to this. Included in expenses of approximately € 6 million for traffic management, are those related to urban planning (€ 3.1 million) and street lightening (€ 2.7 million). It should also be mentioned here that Genève provides land at no cost for car parks to the companies managing these parking spaces. This amounts to € 1.8 million per year of lost income through rent of the land. Incomes are mainly from fines (€ 7.9 million) and from parking rents and fees (€ 5.5 million). The latter includes mostly car parks and multi-storey car parks, since most public facilities either do not have parking spaces or provide them for free. The City of Genève does not receive any contributions for road infrastructure from the Canton or the Confederation, since this is mainly under the responsibility of the Canton as men- tioned before. The budget of the City does not provide a lot of detail on actual expenditure, and even Average subsidies the accounting system does not give any clear information on expenses related to car for private transport transport. Therefore, many figures provided are based on estimations by the officers in Germany: responsible. A number of important budget items are not included, as the heads of 145 € per citizen services did not feel that they were in a position to provide appropriate figures, or to estimate the time their staff spends on private motorised transport. This is, for example, the case for the police, where only a small percentage of costs is attributed to car trans- port, although the real costs are probably much higher. Also, in many cases it was not possible to include expenditures on the maintenance of the car parks of public buildings such as swimming pools, theatres, and schools. The administrations of the concerned services were not aware of any expenditure in this respect. Even if the subsidies per inhabitant are in the range of other cities assessed, it is quite probable that the expenses are underestimated for the reasons described above. Public transport receives subsidies from the City of Genève in the range of € 400.000 per year, which is considerably less than the sum dedicated to private transport. It has to be men- tioned that this sum is allocated to neighbourhood bus lines only though. The main public transport lines in the city as well as in the whole Canton are subsidised by the Canton. Results from Ferrara The City of Ferrara situated in Northern Italy (130,461 inhabitants), is developing its local sustainability tools at a lively pace. After having taken initiatives such as extend- ing the network of cycling lanes and convincing people to use bicycles more often, the local authority has further developed its sustainable development approach through a project. Subsidies for car transport found in Ferrara confirm the image of a sustainable city, at least compared to most other local practices. In 2002, a total of € 9.31 million was spent on motorised individual transport, with incomes of € 3.55 million. This equals a subsidy of € 5.76 million, corresponding to some € 44 per capita, and a cost recovery of around 38%. In Ferrara, the main expenditure comes from the police department, where more than 90% of all expenses are related to car transport, amounting to € 4.27 million per year. This is closely followed by street maintenance which totals € 4.05 million per year on individual motorised transport. The third significant cost is the service for mobility and traffic that deals with the organisation of transport in the city with € 0.55 million, main- ly on staff costs. All other expenses are split up between the various services and depart- ments without any significant amounts. The most important incomes from motorised individual transport can also be found in the police department, mainly related to fines. These amounted to € 3.10 million for the year 2002. The remaining income results from parking fees (€ 0.34 million), in this case from money that is transferred from the company managing the parking areas of the city, Ferraratua. There is also a small contribution from the Region, which however is rather insignificant. Once again, it has to be stressed that the City budget does not provide a great deal of detail on outgoing and incoming money. In many cases, it was only possible to allocate expenses to car transport by talking to the officers in charge of the budget. Calculations had to rely to a great extent on estimations by local employees. The total amount is
most probably higher than calculated here, however, for this analysis a rather conserva-
                                                tive approach was taken in calculating the costs.
                                                Ferrara has certainly achieved a lot when it comes to sustainable urban transport. This
                                                is not only indicated by the figures presented here, but is also noticeable in the city it-
                                                self. In contrast to most other cities, public transport, bicycles and pedestrians account
                                                for a big part of the modal share in Ferrara (43.5%). 35% of the costs of the public
                                                transport service is covered by fares. Subsidies for the public transport system come
                                                mainly from the regional authority as being the main responsible actor for transport in
                                                Italy (here the Regione Emilia-Romagna), contributing up to 65% of the total annual
                                                expenditure (capital expenditure is not considered). This amount corresponds to a so-
                                                called “minimum service”, i.e. the basic mobility needs of a local authority. All addi-
                                                tional services are financed by the municipality. These regional financial contributions
                                                are paid from a tax (formerly a national tax on each circulating motor vehicle) that is
                                                paid on an annual basis by each owner of a motor vehicle (independently of its use)
                                                grosso modo in proportion to the power of the vehicle.

                                                What can be done?
                                                Confronted with the above figures, a number of transport experts defend the current
                                                situation by pointing out that cutting all the reported expenditure would have a negative
                                                effect on the urban infrastructure. Obviously, not all street maintenance can be
                                                stopped, traffic police will also be needed in future and actually even for a sustainable
                                                transport system new roads need to be built. The alternative is not to stop expenditure,
                                                but to take a pragmatic three-fold approach:
                                                l Better cost-coverage in transport: It is a fair principle that the user should pay for the
                                                  benefits she/he receives from a system. This does not only count for public trans-
                                                  port, but also for private transport. At a local level there is not one single tool for this,
                                                  e.g. road-pricing, but there are several, which should be used in a balanced way.
                                                  These include contributions from higher levels of government (which might be fi-
                                                  nanced through fuel taxes), parking fees, development levies (in newly developed
                                                  commercial and residential areas) and finally road-pricing be it at single points like
 Imprint                                          bridges, or for central areas. Also employees of the City or their departments should
This leaflet was produced in the frame-           make their contribution, if using for example parking space or the authority's car
work of the SIPTRAM (Sustainability in the        fleet. The cost-recovery should be 100% or more, in order to support sustainable de-
Public Urban Transport Market) project,           velopment. Values below 50% should be regarded as problematic.
which aims to encourage local and regional
authorities across Europe to improve the        l Less expenditure on car transport: Even if it can't be cut to zero, the amount spent on
environmental and quality standards in            car transport through the public budget is not prefixed, so it can therefore be politically

                                                                                                                                                        Photos: VCD, üstra AG, Hannover (2), Getty-Images (1), Marcus Gloger/fairkehr (3)
urban public transport. (For more informa-        and technically influenced. Bigger shares of the budget should be invested in sustain-
tion www.increase-public-transport.net)           able modes of transport, e.g. the budgets for cycling lanes in most cities are negligible
                                                  compared to the road budgets. By cutting the width of streets built and the size of the
Funded by the European Commission,                cars purchased for the local government fleets, significant amounts can be saved.
Directorate General for the Environment,
under the Community Framework for Co-           l Different planning/framework conditions: Last but not least, city planning and other
operation to promote Sustainable Urban            local decisions influence the costs of different modes of transport. For example, pri-
Development (COM, 2002/C 26/08). The              ority for public transport at traffic lights gives transport companies the chance to pro-
text contained in this publication is written     vide the same service with fewer buses. Similarly, shops, cinemas and commercial
under the sole responsibility of ICLEI.           areas planned with good opportunities for access by foot, bike and public transport,
                                                  need less road and parking capacity.
Authors
Christoph Erdmenger, Vivien Führ
ICLEI’s Sustainable Procurement Team
Leopoldring 3
D- 79098 Freiburg                                Assessing hidden subsidies of your local government
Germany
                                                 Going through a local budget to analyse local government expenditure on car trans-
Tel. + 49-761/ 3 68 92-0
                                                 portation is a time consuming task. Having these figures however provides useful
Fax + 49-761/ 3 68 92-49
                                                 arguments when it comes to reorienting local priorities and strategies towards sustain-
E-mail: procurement@iclei-europe.org
                                                 ability. If you would like to assess how much your local government spends on private
© ICLEI European Secretariat GmbH                car transportation but do not have the capacities to do so, ICLEI could assist you with
  2005                                           this task. Please contact us at the address detailed on the left for further information.

                                                                                                                                  Printed on environ-
                                                                                                                                     mental paper
You can also read