Q3 2020 presentation 30 October 2020 CEO Espen Eldal - Cision

Page created by David Hawkins
 
CONTINUE READING
Q3 2020 presentation 30 October 2020 CEO Espen Eldal - Cision
Q3 2020 presentation
30 October 2020

CEO Espen Eldal
Q3 2020 presentation 30 October 2020 CEO Espen Eldal - Cision
Disclaimer
This presentation has been produced by Europris ASA (the "Company") exclusively for information purposes. This Presentation has not been approved, reviewed or registered with any public authority or stock exchange.
Further to the aforementioned, this presentation is the result of an effort of the Company to present certain information which the Company has deemed relevant in accessible format. This Presentation is not intended to
contain an exhaustive overview of the Company's present or future financial condition and there are several other facts and circumstances relevant to the Company and its present and future financial condition that not
been included in this Presentation. This Presentation may not be disclosed, in whole or in part, or summarized or otherwise reproduced, distributed or referred to, in whole or in part, without prior written consent of the
Company.

This Presentation contains certain forward-looking statements relating to the business, financial performance and results of the Company and/or the industry in which it operates or intends to operate. Forward-looking
statements concern future circumstances and results and other statements that are not historical facts, sometimes identified by the words "believes", expects", "predicts", "intends", "projects", "plans", "estimates", "aims",
"foresees", "anticipates", "targets", and similar expressions. The forward-looking statements contained in this Presentation, including assumptions, opinions and views of the Company or cited from third party sources are
solely opinions and forecasts which are subject to risks, uncertainties and other factors that may cause actual events to differ materially from any anticipated development. None of the Company or any of its subsidiary
undertakings or any such person's officers or employees provides any assurance that the assumptions underlying such forward-looking statements are free from errors nor does any of them accept any responsibility for
the future accuracy of the opinions expressed in this Presentation or the actual occurrence of the forecasted developments. The Company assumes no obligation to update any forward-looking statements or to conform
these forward-looking statements to our actual results. Furthermore, information about past performance given in this Presentation is given for illustrative purposes only and should not be relied upon as, and is not, an
indication of future performance. No representation or warranty (express or implied) is made as to, and no reliance should be placed on, any information, including projections, estimates, targets and opinions, contained
herein, and no liability whatsoever is accepted as to any errors, omissions or misstatements contained herein, and, accordingly, neither the Company nor any of its parent or subsidiary undertakings or any such person’s
officers or employees accepts any liability whatsoever arising directly or indirectly from the use of this document.

By reviewing this Presentation you acknowledge that you will be solely responsible for your own assessment of the market and the market position of the Company and that you will conduct your own analysis and be
solely responsible for forming your own view of the potential future performance of the businesses of the Company. This Presentation must be read in conjunction with the recent financial reports of the Company and the
disclosures therein. The distribution of this Presentation in certain jurisdictions may be restricted by law. Persons in possession of this Presentation are required to inform themselves about, and to observe, any such
restrictions. No action has been taken or will be taken in any jurisdiction by the Company that would permit the possession or distribution of this Presentation in any country or jurisdiction where specific action for that
purpose is required.

No shares or other securities are being offered pursuant to this Presentation. This Presentation does not constitute an offer to sell or form part of, and should not be construed as, an offer or invitation for the sale or
subscription of, or a solicitation of an offer to buy or subscribe for, any shares or other securities in any jurisdiction, nor shall it or any part of it or the fact of its distribution form the basis of, or be relied on in connection
with, any offer, contract, commitment or investment decision relating thereto, nor does it constitute a recommendation regarding the securities of the Company.

By reviewing this Presentation you agree to be bound by the foregoing limitations.

This Presentation speaks as of 30 October 2020. Neither the delivery of this Presentation nor any further discussions of the Company with any of the recipients shall, under any circumstances, create any implication that
there has been no change in the affairs of the Company since such date. The Company does not intend, and does not assume any obligation, to update or correct any information included in this Presentation. This
Presentation shall be governed by Norwegian law, and any disputes relating to hereto is subject to the sole and exclusive jurisdiction of Norwegian courts.

                                                                                                                                                                                                                                              2
Q3 2020 presentation 30 October 2020 CEO Espen Eldal - Cision
Europris - Norway’s #1 discount variety retailer

                                    • 32 million customer transactions in 2019
               Customers            • Widely recognised brand and price position1
                                    • Increasing market share and gaining new customers

                                    • 1 million leaflets in distribution
               Marketing            • 550 000 subscribers to digital newsletter
                                    • 600 000 members in the Mer customer club

                                    • Cost-efficient locations and operations
               Stores               • 234 of 249 like-for-like (LFL) stores profitable in 2019
                                    • Track-record of 15 new or relocated stores p.a.

                                    • More than 40 years of wholesaler experience
               Logistics            • Efficient set-up and nationwide reach

               Sourcing
                                    • New modern central warehouse from Q2 2019

                                    • From more than 30 countries
                                                                                                 265
                                    • Pan-Nordic agreement with ÖoB and Tokmanni                 Stores

1   Mediacom annual market survey                                                                         3
Q3 2020 presentation 30 October 2020 CEO Espen Eldal - Cision
28 years of consecutive growth
NOK million

                                                                                                                                      25 years of
                                                                                                               JV with      Listing
                                                                                                                                      growth
                                                                                                               Tokmanni     on
                                                                                                                                      Store #250
7 000                                                                                                          and opened   Oslo
                                                                                                               Shanghai     Børs
                                                                                                               sourcing
6 000
                                                                                                               office
                                                                                                   Acquired by
5 000                                                                                              Nordic Capital
                                                                                  Central
                                                                                  warehouse
4 000    Founded by                                             Acquired by       opened in
         Wiggo                                                  IK          Store Fredrikstad
3 000    Erichsen                                               Investment #150
                                                                Partners
2 000
              Wholesale                     Store #100
              agreement with
1 000         Terje Høili AS

    0
        1992 1993 1994 1995 1996 1997 1998 1999 2000 2001 2002 2003 2004 2005 2006 2007 2008 2009 2010 2011 2012 2013 2014 2015 2016 2017 2018 2019 LTM
                                                                                                                                                     Q3
                                                                                                                                                    2020

                                                                                                                                                       4
Q3 2020 presentation 30 October 2020 CEO Espen Eldal - Cision
Highlights third quarter 2020
•   Gaining market share in a strong market                        Group revenue (NOK million)
                                                                   •

    ▪   Solid merchandising and successful campaigns

•   Stable gross margin despite shift towards groceries                          1 897        28.5%

    ▪   Gross margin 42.8% (42.6%) excluding stocktaking effects                                            1 477

•   Scalability and improved efficiency
    ▪   OPEX to sales ratio decreased to 22.4% (26.5%)
    ▪   Adjusted EBITDA rose by 53% to NOK 402 million
                                                                                Q3 2020                    Q3 2019

•   Strong financial position                                          Adjusted net profit (NOK million)
                                                                       •

    ▪   Cash and available credits of NOK 1,430 million (463)

                                                                                  191         115%
•   One new store opened and another three approved by the board
                                                                                                             88
•   Well prepared for the important Christmas season
    ▪   Solid start to the fourth quarter
                                                                                Q3 2020                    Q3 2019
•   Stina Charlene Byre appointed CFO
                                                                                                                     5
Q3 2020 presentation 30 October 2020 CEO Espen Eldal - Cision
Sales performance
                                                                       Retail sales per quarter (NOK million)

• Total retail sales growth of 27.2% in Q3                                                         2335
  ▪   26.5% like-for-like sales growth, stable growth throughout the
      quarter
  ▪   Positive sales impact from Covid-19 infection control                                                               2007
                                                                                                                   1973
      measures
  ▪   Solid merchandising in stores another key driver
                                                                                            1724

• Strong sales growth across categories                                                                     1551
  ▪   A shift towards groceries                                                    1432
                                                                            1279
• Sales growth relatively evenly distributed between
  customers and basket
  ▪   Basket increase driven by a larger number of items per
      customer

                                                                               Q1              Q2                Q3          Q4
                                                                                                     2019       2020

                                                                                                                                  6
Q3 2020 presentation 30 October 2020 CEO Espen Eldal - Cision
Outperforming a strong variety retail market
                                                                                                                                 Total sales growth development*
 • Significantly outperforming the market so far this year
                                                                                                                                       Y-o-Y total growth as of end-September
                                                                                                                                       (%)
 • National infection control measures and closed borders
                                                                                                                                                                                                      26,1 %
   had a major impact on domestic consumption                                                                                    26%

                                                                                                                                 24%

 • Large variations between market segments                                                                                      22%

     ▪    Variety retail is thriving                                                                                             20%

                                                                                                                                 18%
                                                                                                                                                                                        17,7 %

                                                                                                                                 16%
                                                                                                                                                                          15,4 %
                                                                                                                                 14%

                                                                                                                                 12%

                                                                                                                                 10%                        9,2 %
                                                                                                                                 8%

                                                                                                                                 6%

                                                                                                                                 4%
                                                                                                                                            3,7 %

                                                                                                                                 2%

                                                                                                                                 0%

                                                                                                                                       Shopping centres   Total retail   Groceries   Variety retail   Europris

* Source: Kvarud analyse, Shopping Centre Index, Virke retail index (using figures reported by statistics Norway) and Europris                                                                                   7
Q3 2020 presentation 30 October 2020 CEO Espen Eldal - Cision
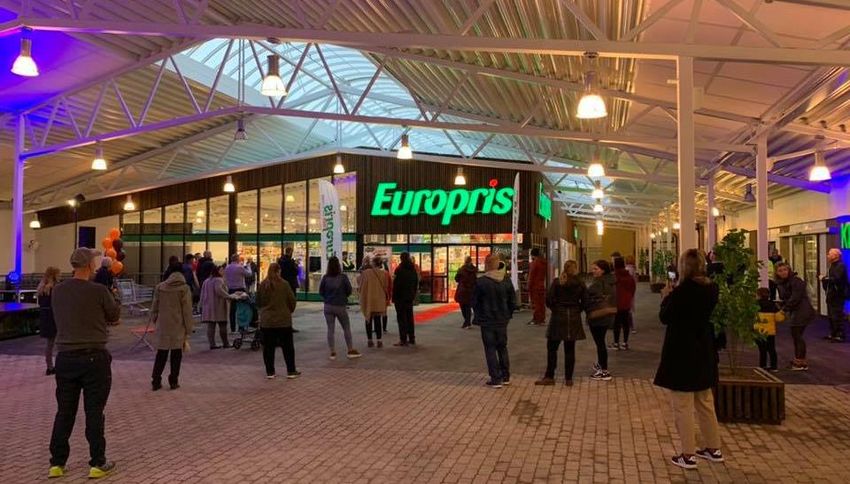
Gross margin development
                                                                         Gross margin
•   Gross margin was 43.6% in Q3 2020 vs 44.3% in Q3
    2019                                                                                              43,9 %   44,3 %
                                                                                                                                  45,1 %
                                                                                                                         43,6 %                      42,9 %
                                                                                             42,4 %                                         42,8 %
    ▪   NOK 22 million (33) in positive calculation differences from       41,4 %
                                                                                    40,4 %
        annual stocktaking in the stores, of which NOK 16 million (29)
        relates to previous quarters

•   Adjusting for stocktaking, gross margin was 42.8%
    (42.6%)

•   Stocktaking is delayed due to Covid-19
    ▪   107 stores (28) will complete annual stocktaking in Q4

                                                                                Q1                Q2                Q3                 Q4       YTD

                                                                                                                2019      2020

                                                                                                                                                              8
Q3 2020 presentation 30 October 2020 CEO Espen Eldal - Cision
OPEX development
                                                                         OPEX in % of group revenue
•   OPEX was NOK 425 million in Q3 2020 vs. NOK 392
    million in Q3 2019, up by 8.7%                                         31,3 %

    ▪   OPEX ratio was 22.5% (26.5%)                                                29,4 %

                                                                                                                                            27,0 %
    ▪   Lower ratio due to scale benefits from strong sales growth and                                         26,5 %
        cost control                                                                         24,2 %
                                                                                                                                                     23,4 %
                                                                                                                         22,4 %
                                                                                                                                  21,4 %
                                                                                                      20,5 %
•   Number of directly operated stores increased from 230
    to 236, up by 2.6%

                                                                                Q1                Q2                Q3                 Q4       YTD

                                                                                                                2019      2020

                                                                                                                                                              9
Q3 2020 presentation 30 October 2020 CEO Espen Eldal - Cision
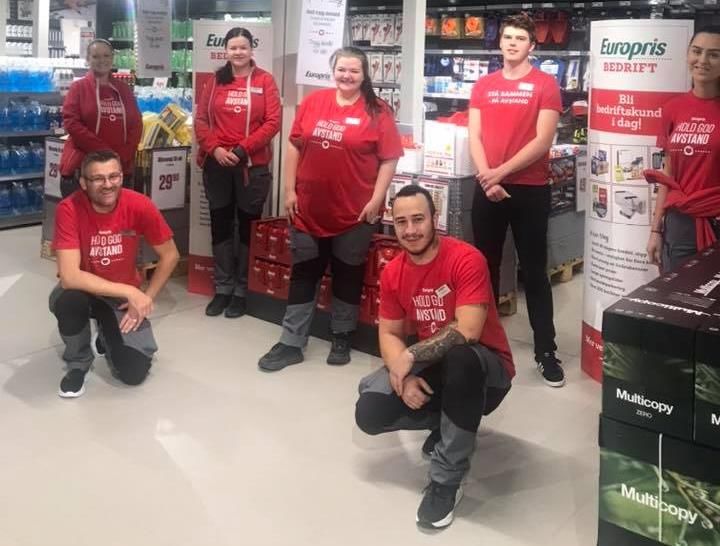
Adjusted EBITDA development
                                                        Adjusted EBITDA (NOK million)
•   Adjusted EBITDA was NOK 402 million in Q3 2020 vs
    NOK 262 million in Q3 2019                                                                                                   1 071

•   Adjusted EBITDA margin was 21.2% in Q3 2020 vs
    17.8% in Q3 2019

                                                                                                                         683
•   Adjusted EBITDA affected by
    ▪   High sales growth
                                                                                      517
    ▪   Strong gross margin management                                                                        450
                                                                                                       402
    ▪   Continued good cost control
                                                                           296
                                                                                            262

                                                                     152
                                                          125

                                                                Q1               Q2               Q3                Q4         YTD

                                                                                            2019       2020

                                                                                                                                         10
Cash flow
                                                                                                               Q3      Q3    YTD     YTD
•   Net change in working capital in the first nine months        Cash flow, NOK million                     2020    2019    2020    2019
    was positive at NOK 18 million (negative 179)
                                                                  Cash from operating activities               242     258     868     306
    •   Affected by timing differences for accounts payable and
                                                                  - of which change in net working capital    (81)      18      18   (179)
        payment of other provisions and accruals
                                                                  Cash used in investing activities           (15)    (26)    (90)    (98)
                                                                  Cash from financing activities             (310)   (209) (1,302)   (607)
•   Net debt at 30 September 2020 was NOK 2,822 million           Net change in cash                          (83)      23 (524)     (400)
    (3,579)                                                       Cash at beginning of period                  127       4     568     427
                                                                  Cash at end of period                         44      27      44      27
•   Cash and liquidity reserves at the end of the quarter was
    NOK 1,430 million (463)

                                                                                                                                       11
Our strategic focus areas

     Strengthen price       Improve customer   Drive customer
     and cost position         experience          growth

                                                                12
Strengthen price    Improve customer   Drive customer
and cost position      experience          growth

                                                        13
In progress with new warehouse transition

                                                 • 1 May: Take over of new warehouse in Moss                                                           ✓
              2019                               • Q2: Operation start in low-bay area. Start testing of high-bay automation                           ✓
                                                 • Q2: Lease expires at one small warehouse in Fredrikstad                                             ✓

                                                 • Q1: Operation start in high-bay area (mid February)                                                 ✓
              2020                               • Q2: Lease expires at two smaller warehouses and at the second largest warehouse in Fredrikstad      ✓
                                                 • Q3: Start testing of automation in low-bay area                                                     ✓

                                                 • H1: Start of automated shuttle solution in low-bay area
              2021                               • H1: All distribution out of the new warehouse in Moss

                                                 • 28 February: Lease expires at the largest warehouse, Øra in Fredrikstad
              2022                               • Total reduction in opex/group revenue ratio expected between 0.75 to 1.25 percentage points after the
                                                   transition period

Timeline is based on estimations as of Q3 2020

                                                                                                                                                           14
ÖoB financial and transaction update
•   ÖoB grew sales by 6.7% YTD to SEK 3,076 million (2,882)
    •   Highest sales growth in Q1, driven by Covid-19 outbreak
    •   Growth YTD driven by an increase in the basket while number of
        customers are slightly reduced
    •   Suburban stores performing well while stores close to the Norwegian
        boarder and some city stores have experienced lower traffic

•   EBITDA YTD was SEK 24.6 million (20.3)*
    •   Lower gross margin due to sales mix change and realization of old items
    •   Increased distribution costs to stores

•   Financial due diligence scheduled to commence in Q4
    •   Forms the basis of the preliminary purchase price if option is exercised
    •   Option period of six months from agreement on ÖoB’s 2019 financials

                                                                                   15
* Source: preliminary and unaudited figures, excluding IFRS 16 effects from ÖoB
Strengthen price    Improve customer   Drive customer
and cost position      experience          growth

                                                        16
New sustainable alternative products
•   Sustainability for everyone - at low prices!

•   Europris sees sustainability as an opportunity
    - for the environment, customers and business

•   Effekt (private label) with a new range of sustainable
    products in the washing and cleaning category
    •   100% vegan
    •   100% recycled Norwegian plastic for packaging
    •   Effekt is sold in both Europris and ÖoB’s stores and with large
        volumes, production costs can be reduced and prices kept low

                                                                          Europris private label Effekt’s new sustainable product line

                                                                                                                                         17
Campaigns – important to the concept
•   Important to deliver on campaigns to new and existing
    customers, even at this exceptional time
    •   Serves as key traffic generator to stores
    •   Supports and strengthens the price position
    •   Improves customer loyalty and satisfaction

•   During Covid-19 demand increased more than expected and
    purchases were planned for
    •   Maintained the campaign pressure, but adjusted the product offering to
        avoid sold-out situations

•   Organisation drilled in quick changes between seasons and
    campaigns
    •   Making sure customers get the goods they want and need
    •   Flexibility in the concept is a competitive advantage in times of rapid
        changes in the market

                                                                                  18
Strengthen price    Improve customer   Drive customer
and cost position      experience          growth

                                                        19
Continued positive trend for e-commerce
•   E-commerce grew by 106% in Q3 and accounted for 0.9% of
    chain sales
    •   Home deliveries grew by 57%
    •   Click and collect grew by 119% and accounted for 84% of
        e-commerce sales

•   Bridging e-commerce and physical stores
    •   Possibility to collect at any of the chains 265 stores
    •   Store employees offers valuable service and support for customers

•   2.2 million website sessions a month
    •   Value data used to further develop the concept
    •   Focus is to convert internet traffic into sales
    •   Important to have a functional and user-friendly e-com solution
    •   Many customers start their shopping trip online and end up in one of
        the chain’s physical stores

•   The Mer customer club continues to attract newcomers
    •   612,000 members at 30 September                                        20
Healty pipeline of new stores

•   One new store opening and one store relocation in Q3
    •   New store at Lindås, Vestland
    •   Relocation of the store in Stryn, Vestland

•   Healty pipeline of new stores
    •   Three new stores added to the pipeline in Q3
    •   Eight stores in pipeline for 2020 and beyond, including two city concept
        stores in Oslo and one in Bergen
                                                                                   The team at Europris Lindås

•   Location of stores has a significant impact on the group’s visibility
    and footfall
    •   Constantly on the look-out for prime store locations
    •   See considerable potential for new stores and store relocations
    •   Europris’ consistent performance makes us an attractive tenant

                                                                                                         The opening day at Europris Lindås

                                                                                                                                              21
Outlook
Outlook
•   Strong development in 2020 with profitable growth under
    current Covid-19 conditions
    ▪   Sales growth trend stable throughout Q3 and into the first weeks of
        October
    ▪   Long-term effect of Covid-19 depends on how the pandemic
        develops and the magnitude of infection control measures in society

•   Financial due diligence of ÖoB scheduled to commence in Q4

•   Well prepared for the important Christmas season

                                                                              Europris Christmas catalog 2020

                                                                                                                23
Be the best discount
                    variety retailer in Europe

Fogra Reklamefoto                                24
Q&A

Next event: Q4 presentation 4 February 2021
Appendix
Content

   Status on ÖoB

   Sales days and store projects

   Analytical information

   Alternative Performance Measures (APM’s)

                                              27
A low-risk synergistic partnership today
Potential for true European scale tomorrow

                                                  2018   2019                    2020               2021           2022
              Strategic initiatives
              Increase profitability
                                                                                        Option to
                    of ÖoB                                                               acquire
                                                                                        remaining
                Store initiatives                                                       80% stake
                (incl. ÖoB 2.0)

             Sharing
             Best practice
                     best practice
                           sharing

                  Purchasing

       Strengthen price and cost position
                                                                                                       Nordic discount
                                                                                                         variety retail
         Improve customer experience
                                                                                                        champion and
                                             EPR 20%                                                       platform
                                            ownership           Acquisition of                           established
            Drive customer growth
                                             stake in            20% equity
                                               ÖoB                 stake
                                                                 completed

                                                                                                                          28
Transaction highlights

                       •   Based on EV using fixed multiple of 7.7x actual EBITDA 2018
                       •   Purchase price settled in Q4 at NOK 115 million based on ÖoB EqV of NOK 574 million
20% initial stake in
                       •   Shares acquired in the market by Europris at a total cost price of NOK 98 million
Runsven-gruppen AB
                       •   Share for share transaction, settled by treasury shares
                       •   2.6% ownership stake in Europris (4,35m shares)

                       •   Exercisable in 2020 within six months after agreement on ÖoB’s 2019 EBITDA
Option to acquire
                       •   Based on EV using fixed multiple of 7.7x average 2019 and 2020 EBITDA
remaining 80% stake
                       •   Share for share transaction

Lock-up                •   Shares issued to sellers of ÖoB are subject to lock-up

                                                                                                                 29
Sales days and store projects
Number of sales days
    Year                                           Q1                           Q2                           Q3                           Q4                        Total
    2019                                           76                            71                           79                           80                         306
    2020                                           77                            72                           79                           80                         308
    2021                                           76                            71                           79                           81                         307

Number of store projects (franchise projects in brackets)
•

    2019                                           Q1                           Q2                           Q3                           Q4                        Total
    New stores                                       1                             4                            1                             -                           6
    Store closures                                    -                            -                             -                            -                            -
    Relocations                                       -                            3                         (1)                             2                       5 (1)
    Modernisations                                   7                             1                            2                            4                          14

    2020E                                          Q1                           Q2                           Q3                           Q4                        Total
    New stores                                       1                             -                            1                            2                            4
    Store closures                                    -                            1                             -                           1                            2
    Relocations                                      1                             -                            1                             -                           2
    Modernisations                                   2                             5                            2                        2(1)                       11(1)

                                                                                                                                                                                                                        30
Note: Number of projects in 2020 is a moving target, and is subject to change during the year based on operational considerations. An updated view will be presented during the quarterly presentations going forward
Analytical info1

     Seasonality                                       •     As rule-of-thumb, the Easter impact is approximately NOK 50 million in revenue and NOK 10 million of
                                                             EBITDA

                                                       •     As rule-of-thumb, OPEX in year ago quarter + inflation + NOK 1.5 – 1.6 million per extra directly
     Quarterly OPEX
                                                             operated store (DOS)

                                                       •     New store – NOK 2.3 million per store (5 per year)
                                                       •     Relocation – NOK 1.5 million per store (10 per year)
     CAPEX                                             •     Modernisation – NOK 1.0 million per store (10 per year)
                                                       •     Category development – NOK 10 million per year
                                                       •     IT & Maintenance – NOK 35 million per year

     Estimated one-time
     CAPEX items 2020                                  •     New warehouse of approximately NOK 7 million (IT, system integration, fixtures and fittings)

1   All figures are approximations and subject to change without further notice                                                                                  31
Analytical info: New warehouse
 NOK million                                       2019        Q1 2020   Q2 2020   Q3 2020   Q4 2020    2020   2021   2022

 Investments
 IT, office equipment and other
 (Capex)                                               28          1.5       3.9       1.0         ~      ~6      ~      ~

 Automation, part 1 (lease)
                                                       52         15.9                 2.8       ~9.4    ~28      ~      ~

 Automation, part 2 (Capex)
                                                       65          1.5      21.6       0.6      ~28.4    ~52      ~      ~

 Depreciation of automation part 1 starts in Q4 2020 and
 depreciation of automation part 2 starts in Q1 2021

 OPEX items
 Ordinary rent                                         68         17.9      17.1      16.3      ~16.3    ~68    ~45    ~39

 Redundant warehouse capacity in
 2019/2020 and Øra lease from H2                       14          2.9       3.4         ~         ~      ~6    ~26      ~
 2021 (lease ends March 2022)

 Non-recurring moving expenses                             5         2       1.5      ~0.3         ~      ~4   ~3-5      ~

No material changes from previous estimates                                                                              32
Alternative performance measures (APMs)
APMs are used by Europris for annual and periodic financial reporting in order to provide a better understanding of Europris financial performance and are also used by
management to measure operating performance. In the discussion of the reported operating results, financial position and cash flows, Europris refers to these measures which
are not defined by generally accepted accounting principles (GAAP) such as IFRS. Europris management makes regular use of these Alternative Performance Measures and is
of the opinion that this information, alongside with comparable IFRS measures, is useful to investors who evaluate the group’s financial performance. APMs are adjusted IFRS
figures defined, calculated and used in a consistent and transparent manner and should not be viewed in isolation or as an alternative to the equivalent IFRS measure.

                                                                                                    Adjusted earnings per share is Adjusted net profit divided by the current number of shares,
Total retail sales are retail sales from all stores, both directly operated and franchise stores.
                                                                                                    adjusted by the average of treasury shares.
COGS excluding unrealised foreign exchange effect is the cost of goods sold except for
                                                                                                    Working capital is the sum of inventories, trade receivables and other receivables less the sum
unrealised gains or losses on the foreign currency derivatives and unrealised foreign currency
                                                                                                    of accounts payable and other current liabilities.
exchange gains and losses on inventory trade payables.
Gross profit represents group revenue less the cost of goods sold excluding unrealised foreign
                                                                                                    Capital expenditure is the sum of purchases of fixed assets and intangible assets.
currency effects.

Gross margin is gross profit represented as a percentage of group revenue.                          Financial debt is the sum of term loans and financial leases.

Opex is the sum of employee benefits expense and other operating expenses.                          Net debt is the sum of term loans and financial leases less bank deposits and cash.

EBITDA (earnings before interest, tax, depreciation and amortisation) represents Gross profit
                                                                                                    Directly operated store means a store owned and operated by the group.
less Opex.
Non-recurring items are expenses which by nature are related to special events outside              Franchise store means a store operated by a franchisee under a franchise agreement with the
normal course of business (e.g IPO costs, moving cost, rent for vacated warehouse).                 group.

Adjusted EBITDA is EBITDA adjusted for non-recurring items.                                         Chain means the sum of directly operated stores and franchise stores.

                                                                                                    Like-for-like are stores which have been open for every month of the current calendar year and
Adjusted profit before tax is profit before tax adjusted for non-recurring items.
                                                                                                    for every month of the previous calendar year.

Adjusted net profit is net profit adjusted for non-recurring items.
                                                                                                                                                                                                  33
                                                                                                                                                                                                    33
You can also read