2017 INTERIM RESULTS PRESENTATION - September 2017
←
→
Page content transcription
If your browser does not render page correctly, please read the page content below
2017 INTERIM RESULTS PRESENTATION
                                September 2017

               Photo: Lidl UK Project- 50,000m 2 Regional Distribution Center
                                                                  Exeter, UK
                                                           Stanford Flooring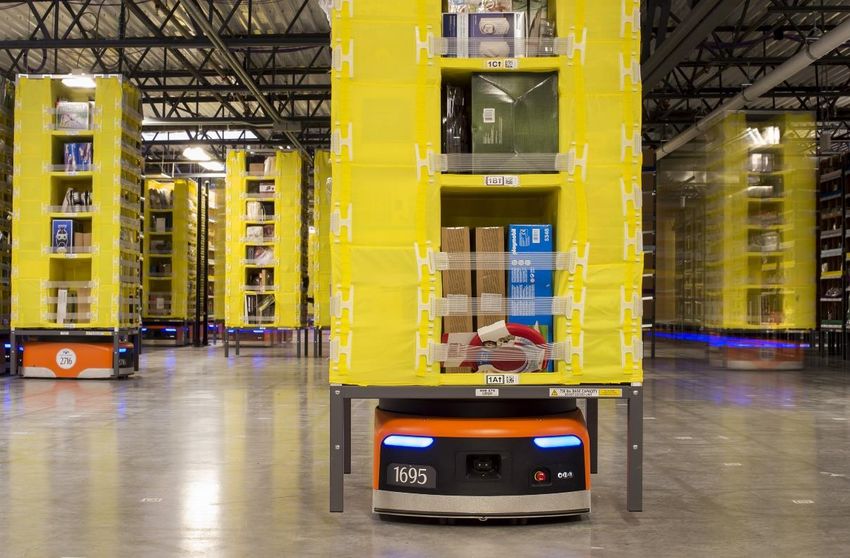
1
FINANCIAL HIGHLIGHTS

      US$ MILLIONS (EXCEPT PER SHARE DATA)
                                                                                                        H1 2017                       H1 2016               % INCREASE

      Revenue                                                                                                   $42.4                        $39.7                             7%

      Adjusted EBITDA(1)                                                                                        $13.2                        $12.1                             9%

      Adjusted EBITDA margin(1)                                                                                   31%                          30%

      Profits before tax                                                                                        $12.0                        $10.4                           15%

      Adjusted net income(2)                                                                                      $8.7                          $7.3                         19%

      Diluted adjusted net income per share(2)                                                                  $0.15                        $0.13                           15%

      Interim dividend per share                                                                           $0.0275                         $0.025                            10%

      Cash flow from operating activities                                                                         $9.4                          $5.8                         62%

      Net cash(3)                                                                                               $18.3                        $12.1                           51%

 Notes:
 (1) Adjusted EBITDA as used herein is a calculation of net income plus tax provision, interest expense, interest income, foreign exchange loss, other expense, depreciation, amortization, and
     stock based compensation.
 (2) Adjusted net income as used herein is a calculation of net income plus amortization of intangibles and excluding the tax impact of stock option and RSU settlements and other special
     items.
 (3) Net cash is defined as cash and cash equivalents less borrow ings under bank obligations exclusive of deferred financing costs .

2017 Interim Results Presentation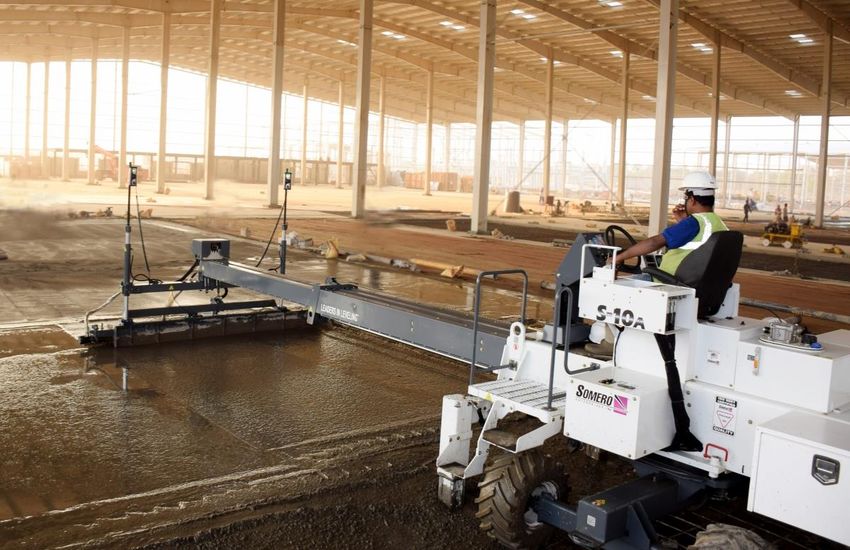
2
H1 2017 OPERATIONAL HIGHLIGHTS

                           Profitable Broad-Based Growth, Investments To Support Strategy
                           • Broad-based geographic and product line growth:
                               - Three of six territories grew in H1 2017 led by Europe, Latin America and the Rest of
                                 World countries
                               - H1 2017 trading in North America ended with June at the highest levels with market
                                 indicators pointing to solid H2 2017 trading
                               - Ride-on Screed sales grew 29% vs. H1 2016
                               - 3-D Profiler System® revenues grew 30% vs. H1 2016
                               - Other revenues grew 14% vs. H1 2016 driven by sales of parts & accessories and STS-
                                 11M Topping Spreaders
                           • New products contributed meaningfully to sales growth:
                               - S-158C in China, the SP-16 Concrete Hose Line Pulling and Placing System, and the
                                 next generation 3-D Profiler System combined for US$ 1.4m in sales growth vs. H1 2016
                           • Investments to support strategy and expansion:
                               - Completed construction of Somero Concrete Institute on Fort Myers, Florida campus and
                                 held first classes in Q2 2017
                               - Completed designs to expand Fort Myers Headquarters with targeted completion in Q2
                                 2018 at a total cost of US$ 1.3m

2017 Interim Results Presentation
3
SALES BY TERRITORY

      US$ MILLIONS
                                                                                H1 2017        H1 2016   CHANGE $    CHANGE %

      North America                                                                 $   28.4    $ 29.8     $ (1.4)        -5%

      Europe                                                                             5.4       2.6         2.8       108%

      China                                                                              2.7       3.8       (1.1)       -29%

      Middle East                                                                        0.8       1.4       (0.6)       -43%

      Latin America                                                                      1.7       0.2         1.5       750%

      Rest of World (1)                                                                  3.4       1.9         1.5       79%

      TOTAL                                                                         $ 42.4      $ 39.7      $ 2.7         7%

    Notes:
    (1) Includes Australia, India, Southeast Asia, Scandinavia, Korea and Russia.

2017 Interim Results Presentation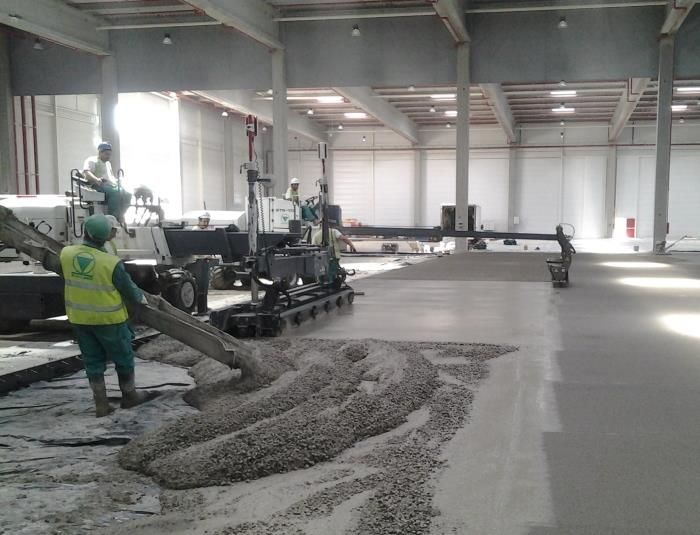
4
SALES BY PRODUCT
US$ MILLIONS
H1 2017 H1 2016 CHANGE $ CHANGE %
Boomed Screeds(1) $ 16.4 $ 17.9 $ (1.5) -8%
Ride-on Screeds (2) 9.4 7.3 2.1 29%
Remanufactured machines 3.0 3.0 - -
3-D Profiler Systems 3.9 3.0 0.9 30%
Other(3) 9.7 8.5 1.2 14%
TOTAL $ 42.4 $ 39.7 $ 2.7 7%
Notes:
(1) Boomed Screeds include the S-22E, S-15R, and S-10A.
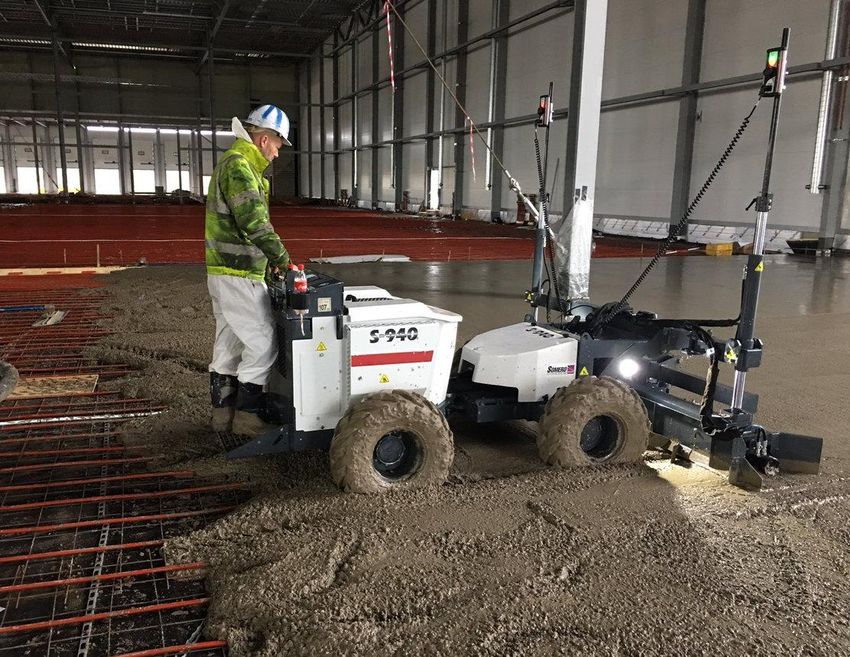
(2) Ride-on Screeds include the S-840, S-940, S-485, and S-158C.
(3) Other revenues include Includes US$ 5.4m and US$ 5.2m in parts and accessories for H1 2017 and H1 2016 respectively, sales of Materials Placement equipment such as the STS-11M,
sales of Lightw eight equipment such as the Copperhead and Min Screed C, as w ell as services revenue, freight, and other miscellaneous items.
2017 Interim Results Presentation
5
OPERATING RESULTS

Highlights:
                                                                                                    US$ IN MILLIONS                                           H1 2017    H1 2016
• Gross margin improved to 56.8% compared
                                                                                                    Revenue                                                     $ 42.4     $ 39.7
  to 56.2% in H1 2016 driven by price
  increases and productivity gains                                                                  Cost of sales                                                 18.3       17.4

                                                                                                    Gross profit                                                  24.1       22.3

• Operating expense growth due to increased                                                         Operating expenses:
  commissions and insurance from higher sales                                                         Selling, marketing & customer support                        5.4        5.2
  volume, as well as increased personnel costs                                                        Engineering & product development                            0.7        0.5
  and marketing spend
                                                                                                      General and administrative                                   6.4        6.3
                                                                                                      Total operating expenses                                    12.5       12.0
• 20% 2016 effective tax rate down from 35%
                                                                                                    Operating income                                              11.6       10.3
  in H1 2016 due to one-time tax benefit from
  settlement of stock options and RSUs in H1                                                        Other income (expense)                                         0.4        0.1
  2017                                                                                              Income before income taxes                                    12.0       10.4
                                                                                                    Provision for income taxes                                     2.4        3.7
• Adjusted net income (1) increased 19%                                                             Net income                                                   $ 9.6      $ 6.7
  compared to H1 2016                                                                               Other data:
                                                                                                      Adjusted EBITDA(1)                                          13.2       12.1
• Capital expenditures of US$1.7m in H1 2017                                                          Adjusted net income(2)                                       8.7        7.3
  represent construction of training facility for
                                                                                                      Depreciation expense                                         0.6        0.5
  Somero Concrete Institute
                                                                                                      Amortization expense                                         0.8        0.8
                                                                                                      Capital expenditures                                         1.7        3.8

Notes:
(1) Adjusted net income as used herein is a calculation of net income plus amortization of intangibles and excluding the tax impact of stock option and RSU
    settlements and other special items.

2017 Interim Results Presentation
6
BALANCE SHEETS

                                                                                                  AS OF            AS OF
Highlights:                                                                                     JUNE 30,     DECEMBER 31,
                                                   US$ IN MILLIONS
                                                                                                   2017              2016
• Cash and equivalents decreased by US$
                                                   Cash and equivalents                           $ 18.3            $ 21.2
  2.9m from the year-end 2016 balance due
                                                   Accounts receivable, net                            9.4               6.3
  primarily to increased H1 2017 dividend
  payments and cash settlements of restricted      Inventory                                           9.0               8.8

  stock units and stock options                    Prepaid expenses and other assets                   2.4               2.4
                                                   Total current assets                               39.1              38.7

• Increase in accounts receivable primarily        Property, plant & equipment, net                   12.7              11.6

  relates to strong trading in North America and   Other assets                                        6.5               7.4
  Europe to end H1 2017                            Total assets                                   $ 58.3            $ 57.7

• Decrease in other assets primarily               Notes payable, current                         $      -          $      -

  attributable to amortization of intangible       Accounts payable                                    4.0               2.8
  assets of US$ 0.8m, which will become fully      Accrued expenses                                   13.2               5.3
  amortized in H2 2017                             Income tax payable                                    -               0.2
                                                   Total current liabilities                          17.2               8.3
• Increase in accrued expense due to dividend      Other liabilities                                   0.2               1.2
  payable of US$ 7.5m relating to special          Total liabilities                                  17.4               9.5
  dividend that was paid on August 14, 2017
                                                   Stockholders’ equity                               40.9              48.2
                                                   Total liabilities and stockholders’ equity     $ 58.3            $ 57.7

2017 Interim Results Presentation
7
CASH FLOWS
SIX MONTHS SIX MONTHS
ENDED ENDED
Highlights: US$ IN MILLIONS
JUNE 30, 2017 JUNE 30, 2016
• Cash provided by operations increased 62% Net income $ 7.6 $ 6.7
in H1 2017 to US$ 9.4m due to earnings Adjustments to reconcile to cash provided
by operating activities:
growth and effective working capital
management Deferred taxes - 0.1
Depreciation & amortization 1.4 1.3
• Cash used for investments primarily driven by Stock based compensation and other 0.2 0.5
Working capital changes 0.2 (2.8)
construction of the training facility for the
Somero Concrete Institute in Fort Myers Net cash provided by operating activities 9.4 5.8
• Financing activity outflows increased in H1 Net cash used in investing activities (1.7) (3.8)
2017 due to dividend payout increase,
retirement of debt, and settlement of stock Payment of dividends (4.9) (2.8)
options and RSUs Stock options and RSUs settled for cash (4.7) (0.5)
Repayment of notes payable (1.0) -
• Net cash at June 30, 2017 of US$18.3m Net cash used in financing activities (10.6) (3.3)
adequately supports special dividend of US$
7.5m paid on August 14, 2017 Effect of exchange rates on cash - (0.2)
Increase in cash and equivalents (2.9) (1.6)
Beginning cash 21.2 13.7
Ending cash $ 18.3 $ 12.1
Note: 1 - See interim results announcement for definition of terms.
2017 Interim Results Presentation8 CURRENT TRADING AND OUTLOOK • Positive trading momentum to end H1 2017 in North America has carried over into H2 providing confidence in expectations for solid H2 2017 trading • Expect that accelerated trading seen in Europe during H1 2017 will continue with broad interest from a number of countries and demand driven by replacement equipment, technology upgrades, and new products • China expected to show improvement in H2 2017 led by focused marketing; sales execution and lead generation activities; and gaining traction with entry level products • Expect to build off strong H1 2017 performance in Middle East, Latin America and Rest of World territories and capitalize on significant opportunities across this broad portfolio of markets in H2 • Based on first half 2017 performance and the outlook across our markets, the Board is confident Somero will deliver another year of profitable growth for our shareholders in line with current market expectations 2017 Interim Results Presentation
9
STRATEGY UPDATE

                                    Photo: Honda Motor Company, 19,200m 2 Distribution Center
                                                                           Barcelona, Spain
                                                             Rinol Rocland Suesco of Spain

2017 Interim Results Presentation
10
GROWTH STRATEGY
LEVERAGE OUR COMPETITIVE ADVANTAGES TO EXPAND GLOBALLY AND
INTRODUCE INNOVATIVE PRODUCTS TO THE MARKET.
Geographic expansion Product innovation
Somero is a truly global business, supplying Somero continually searches for opportunities
90+ countries with our unique products and to leverage our core technology and design
services. capabilities to introduce innovative products to
the industry and enter untapped market
Replicating our success in the North American segments.
market across the globe is a key element of
our strategy. Supporting this commitment to Somero also understands the benefit of strong
grow the business globally is our investment in customer engagement in the product
our international employees. Since 2007, the development effort, with the payoff being the
vast majority of our staffing increases have ability to turn solutions to customer challenges
been employees based outside of North into tangible products with a strong value
America. proposition. This is how we build incredible
customer loyalty and engagement.
From 2011-16 Somero nearly doubled its
revenues from outside North America to US$ Since 2011, Somero launched 6 new products
23m. which combined to represent over 60% of 2016
revenues.
2017 Interim Results Presentation11
5-YEAR PLAN UPDATE
Significant Progress, Objective Remains in
View
We are in the fourth year of our five-year plan BASE YEAR
that targets reaching revenues of US$ 90m in 2013 2016 2018
2018. US$ MILLIONS REVENUES REVENUES TARGET
We reached 75% of the target through three
years of the plan, positioning us well with two North America $ 25.5 $ 56.6
years remaining.
China 6.6 6.4
Given solid fundamentals in the US and
Europe 3.0 8.0
European markets and growth prospects in
China, along with meaningful additional growth Remaining regions 10.0 8.4
opportunities across our portfolio of products
and geographic markets, we remain confident TOTAL $ 45.1 $ 79.4 $ 90.0
in our ability to meet our strategic target in
2018.
2017 Interim Results Presentation12
INVESTMENT THESIS
Why is Somero a Compelling Investment?
• Dominant market position
• Significant barriers to entry for competitors based on technology, education and global
technical support
• Customer driven product development
• Highly knowledgeable and experienced senior management team
• Financial:
- Profitable growth with excellent margins
- Highly cash generative business
- Strong, unleveraged balance sheet
- Disciplined return of cash to shareholders through dividends
• Strategic plan to double revenue by 2018
• Solid growth and market dynamics in developed markets
• Strong potential for growth in emerging markets
2017 Interim Results PresentationBUSINESS MODEL & 13
COMPETITIVE ADVANTAGES
Photo: Somero S-10A
Minitech Floors
Hyderab ad, India
2017 Interim Results Presentation14
OUR MISSION
SOMERO BUILDING OWNERS
APPLICATIONS
CUSTOMERS & END USERS
It all starts with “Why” Small, medium and large Somero equipment that Somero equipment has been
concrete contractors and self- incorporates laser-guided used in construction projects
Our mission revolves around a performing general technology and wide- for a wide-array of the world’s
simple question, “Why?”. For contractors. placement methods is used to largest organizations
place and screed the concrete including:
every Somero employee the Somero operates in markets slab in all building types and
answer is clear. We work hard across the globe, selling our has been specified for use in
products in over 90 countries, a wide range of construction
to deliver world-class products with minimal direct projects including:
and services because we’re competition.
passionate about our customers’ -
-
Warehousing
Industrial/Manufacturing
success and we strive to ensure - Retail
our customers achieve their - Parking structures
- Schools/Hospitals
business and profitability goals. - Other Commercial Projects
Our customers see this passion MULTI-FACETED VALUE PROPOSITION
day in and day out, and as a
result, we earn their loyalty and Key benefits to our customers
Key outcomes for building
owners and end-users
are able to retain them as a increased quality
operational efficiency
customer for life. productivity improved physical
profit appearance
direct access to Somero’s lower floor maintenance
industry expertise, training cost
& support
lower forklift repair cost
2017 Interim Results Presentation15
OUR KEY DIFFERENTIATORS
KEY DIFFERENTIATORS
Innovative Product • Pioneered the Laser Screed® machine market in 1986
How We Pursue Our Mission Makes Us Leadership
Unique • Product portfolio grown to 13 innovative products, all geared
towards helping our customers improve their processes,
The use of our technology and equipment efficiency and quality
enables our customers to install every concrete
slab faster, flatter and with fewer people. • Proprietary designs protected by a portfolio of 63 patents
and patent applications
Somero technology was developed based on a
• Direct, structured engagement with customers in new
deep understanding of the industry and direct product development that funnels ideas and creative energy
customer engagement that to this day drives us on the front-end into focused efforts on new products and
to develop innovative products and services that services solidly supported by a business case
enable our customers to produce higher quality
floors and increase their productivity and Unparalleled Industry • Long, proven commitment to providing exceptional training
ultimately their bottom line. Expertise, Service and in the classroom and on the job site to ensure our
Support customers’ success on their investment in a Laser Screed
Somero’s business is far more than simply selling machine
equipment. Providing customers access to
unparalleled industry expertise, training and • 24/7 direct global support & consulting (guaranteed
response in 10 minutes in all major languages)
support is core to our success as an educator
and innovator in the concrete industry. • Overnight spare parts delivery
• Next day world travel
• Launched Somero Concrete College in Shanghai and
opened Somero Concrete Institute in Fort Myers, Florida in
Q2 2017
2017 Interim Results Presentation16
OUR PRODUCTS AND SERVICES
Machine Applications
What We Provide
BOOMED MACHINES:
Somero offers customers equipment with S-22E
unsurpassed quality and performance (25,000-50,000+ sq. ft. placements)
S-15R warehouses, manufacturing assembly
combined with unparalleled global service,
plants, agricultural buildings
technical support, training and education. S-10A
Somero offers a wide portfolio of products that RIDE-ON MACHINES:
cover concrete slab placements in all types of S-940
(5,000-30,000 sq. ft. placements)
construction projects. In addition to equipment schools, medical centers, retail centers
S-485
and software products, Somero also sells and multi-level commercial construction,
parts, accessories and provides service and S-158 agricultural buildings
training to customers to keep their machines
up and running and operating optimally. OTHER EQUIPMENT:
3-D Profiler System ® Exterior concrete paving and parking
structures
SiteShape ® system Exterior sub-grade
STS-11M Projects requiring dry shake-on
hardener
SP-16 Projects involving concrete hose pumps
Mini Screed™ Small commercial, residential and multi-
S-940 level placements
S-22E
Somero Floor Operator performance improvement
Levelness System ® feedback system for the S-22E
Remanufactured Factory certified remanufactured
Machines machines in all categories
2017 Interim Results Presentation17
IMPORTANCE OF QUALITY, FLAT, LEVEL CONCRETE FLOORS
Is a Quality Floor Important to the Building
Owner/End-User?
The roof and walls of a building protect contents from
outside elements, but the floor carries the load of the
entire business operation. The concrete floor is the
most critical component of any building. The floor is
the base or the foundation from which all other trades
start their work and, if improperly installed, will show in
the finished product and the efficiency of the building.
Photo: The Barley Project (100,000m 2 Distrib ution Center)
Commercial construction projects have floor flatness Milton Keynes, UK
and levelness requirements specified in the design. Stanford Flooring
Once a contractor finishes placing and finishing the
floor on such a job, it is measured against the
Photo: Kiva rob ots moving inventory at an Amazon fulfillment center in Tracy, California
specification. Failing to meet the specifications can
result in a significant loss to the contractor for rework or Building Owners/End-Users Specifying Flat, Level Floors:
potential tear-out and replacement of the floor.
The use of Somero technology and equipment allows
contractors to rest assured that every installation will be
completed faster, flatter, and with fewer people so they
can efficiently meet these specifications.
That is the value we provide.
2017 Interim Results Presentation18
ADDITIONAL SLIDES
Photo: Somero SiteShapeTM System
2017 Interim Results Presentation19
HISTORICAL FINANCIAL RESULTS
YEARS ENDED DECEMBER 31,
US$ Millions, except per
share data 2007 2008 2009 2010 2011 2012 2013 2014 2015 2016
Revenue 66.4 51.9 24.2 21.0 21.9 32.2 45.1 59.3 70.2 79.4
Revenue growth 19% -22% -53% -13% 4% 47% 40% 32% 18% 13%
Cost of sales 28.8 23.1 12.5 11.2 11.7 16.5 21.6 27.3 31.0 34.3
Gross Profit 37.6 28.8 11.7 9.8 10.2 15.7 23.5 32.0 39.2 45.1
Gross profit % 57% 55% 48% 47% 47% 49% 52% 54% 56% 57%
SG&A 24.3 26.0 27.4 11.5 12.0 14.3 17.1 19.4 21.6 23.9
Operating income/(loss) 13.3 2.8 -15.7 -1.7 -1.8 1.4 6.4 12.6 17.6 21.2
Interest expense -1.5 -0.8 -1.0 -0.5 -0.4 -0.3 -0.2 -0.1 -0.2 -0.1
Other income -1.1 0.2 0.1 -0.2 -0.1 0.1 0.3 -0.1 - 0.2
Income before tax 10.7 2.2 -16.6 -2.4 -2.3 1.2 6.5 12.4 17.4 21.3
Tax 3.8 0.5 -1.2 -0.2 - 0.2 1.1 -2.1 5.8 7.0
Net income 6.9 1.7 -15.4 -2.2 -2.3 1.0 5.4 14.5 11.6 14.3
Other data:
Adjusted EBITDA (1) 16.5 6.0 0.8 1.0 0.9 4.2 9.0 15.0 20.0 24.6
Adjusted EBITDA margin 25% 12% 3% 5% 4% 13% 20% 25% 29% 31%
Depreciation & amortization 2.8 2.7 2.7 2.6 2.6 2.6 2.4 2.0 2.3 2.7
Capital expenditures 0.5 0.6 - - 0.1 0.6 0.8 1.2 4.2 4.4
Notes:
(1) - Adjusted EBITDA as used herein is a calculation of its net income/(loss) plus tax provision/(benefit), interest expense, inte rest income, foreign exchange
gain, other expense, depreciation, amortization, stock based compensation and write -down of goodwill as applicable.
2017 Interim Results Presentation20
NORTH AMERICA
Market Dynamics
• Strong recovery in equipment pricing and sales FY 2013 FY 2014 FY 2015 FY 2016 H1 2017
US$ MILLIONS
since recessionary low point in 2011
North America $25.5 $37.2 $49.2 $56.6 $28.4
• US non-residential construction fundamentals
remain sound
• Proposed corporate tax reform, fiscal policies for
infrastructure investment are positive factors for H1 2017 Highlights:
US construction outlook
• Non-residential construction activity remains solid as highlighted by
• Cement consumption from non-residential building projects backlogs reported by our customers that extend well into 2018
construction increased 10.9% in 2016 (1)
• Activity level in the market remains high, which has spurred customer
demand for replacement machines, fleet additions, technology
upgrades and new products
Growth Drivers
• H1 2017 trading in North America ended with June at the highest levels
• US non-residential building construction spend of the year as weather conditions across the country improved and the
forecast to grow 4%-7% through 2020(2) heavy rains seen throughout H1 2017 began to subside
• Technology upgrades to aging installed base • While overall H1 2017 sales in North America were US$ 28.4m, down
• Fleet additions from the US$ 29.8m in H1 2016, we are encouraged by the high level of
activity that has carried forward which supports our expectation for solid
• New product introductions H2 2017 trading
• Shortage of skilled labor in the concrete
construction industry
Notes:
(1) Percentage derived from Portland Cement Association Market Intelligence Fall Cement Outlook report dated November 2016.
(2) Estimates obtained from FMI Research Services Group 2017 US Markets Construction Overview Report.
2017 Interim Results Presentation21
CHINA
Market Dynamics
• Greatest market opportunity for growth outside FY 2013 FY 2014 FY 2015 FY 2016 H1 2017
US$ MILLIONS
North America
China $6.6 $9.5 $6.1 $6.4 $2.7
• Massive quantity of cement consumption forecast
to represent over 50% of 2018 world cement
consumption compared to 3.5% for North
America(1)
H1 2017 Highlights:
• Current market penetration very low
• Slow start to 2017 led to H1 2017 sales of US$ 2.7m, down from US$
3.8m in H1 2016
Growth Drivers • However, sales in China also ended the first half on a positive note with
June trading at the highest level of the year, and we expect to build off
• Increased demand for higher quality concrete this momentum and see improvement in H2 2017 driven by focused
floors marketing, sales execution and lead generation activities, and gaining
• Broader domestic acceptance of wide-placement traction with entry-level products
methods and flatness, levelness floor • Late in 2016 introduced the newly designed entry-level S-158C along
specifications with the S-940 to China geared to attract new productivity-oriented
• Increasing shortage of skilled labor customers
• Experience with our China long-term financing program remains
positive and in-line with our previous reporting
• Positive underlying market fundamentals and long-term growth
prospects remain intact
Notes:
(1) Percentage derived from Portland Cement Association Market Intelligence World Cement Consumption report dated May 2015.
2017 Interim Results Presentation22
EUROPE
Market Dynamics
• Second largest installed base of Somero FY 2013 FY 2014 FY 2015 FY 2016 H1 2017
US$ MILLIONS
equipment
Europe $3.0 $3.6 $5.7 $8.0 $5.4
• Accelerating improvement from the recessionary
low-point in 2011, though region remains at an
earlier stage of recovery than North America
H1 2017 Highlights:
Growth Drivers • Particularly strong performance in H1 2017 with sales increasing to
US$ 5.4m, up 108% from the US$ 2.6m in H1 2016 as the recovery
• Continued recovery of the non-residential throughout Europe accelerated and economic conditions have
construction market across mainland Europe improved.
• Technology upgrades • Sales came from a broad range of countries in H1 2017, with the most
• Fleet additions significant contributions from the United Kingdom, Germany, and the
Czech Republic.
• New product introductions
• Demand was also well-balanced across our product line, aided in part
• Shortage of skilled labor in the concrete by new products since the previous peak sales period in Europe.
construction industry
2017 Interim Results Presentation23
REST OF WORLD (1)
Market Dynamics
• Current market penetration very low FY 2013 FY 2014 FY 2015 FY 2016 H1 2017
US$ MILLIONS
• Most significant opportunity in region is India, with Rest of World $10.0 $9.0 $9.2 $8.4 $5.9
cement consumption second only to China and
forecast to represent over 15% of 2018 world
cement consumption (more than 4 times that of
North America)(2)
H1 2017 Highlights:
• Significant opportunities in the Middle East,
• Latin American sales were particularly strong, increasing to US$ 1.7m,
Southeast Asia, Latin America and Australia
from US$ 0.2m in H1 2016 driven by meaningful contributions from
Mexico and Peru.
Growth Drivers • Middle East H1 2017 sales were US$ 0.8m, down from US$ 1.4m in H1
2016, but we continue to see a high-level of interest in our equipment
• Large multinational projects requiring high-quality and have carried a solid pipeline of opportunities over into H2 2017.
floors adhering to Western standards
• Sales in our Rest of World territories which include Australia, Southeast
• Broader domestic acceptance of wide-placement Asia, Korea, India, Scandinavia, and Russia sales grew 79% to US$
methods and flatness, levelness floor 3.4m compared to US$ 1.9m in H1 2016, with Korea and Scandinavia
specifications the most significant contributors to growth and with Australia and India
• Increased availability of long-term financing also reporting sales increases compared to the previous year.
options for customers
• New product introductions
• Increasing shortage of skilled labor
Notes:
(1) Includes Middle East, Latin America, Australia, India, Southeast Asia, Scandinavia, Korea and Russia
(2) Percentage derived from Portland Cement Association Market Intelligence World Cement Consumption report dated May 2015.
2017 Interim Results Presentation24
MANAGEMENT TEAM: STABILITY, EXPERIENCE, DEPTH
Yrs. of Somero
Name Title Age
experience
Senior Management
Jack Cooney President, Chief Executive Officer and Director 70 19
John Yuncza Chief Financial Officer and Director 45 2
Howard Hohmann Executive Vice President of Sales and Director 56 28
Lance Holbrook Vice President Sales, North America and International 46 16
Mark Pietila Engineering 51 18
Jesse Aho Production 35 9
Dave Raasakka Global Customer Support 45 3
Adam Kruzich Vice President Finance & Controller 42 1
Laura Rannals Director of Marketing 32 1
TR Kunesh Business Development Manager 54 8
Paul Kelly International Consulting Manager 56 27
Non Executive Directors
Lawrence Horsch Non-Executive Chairman of the Board 82 7
Thomas Anderson Non-Executive Director 65 10
Robert Scheuer Non-Executive Director 59 1
2017 Interim Results Presentation25
THANK YOU
Jack Cooney, CEO
+1 (0) 239 210 6500
jcooney@somero.com
www.somero.com
John Yuncza, CFO
+1 (0) 239 210 6500
jyuncza@somero.com
www.somero.com
Photo: Boomed Screed assembly, Houghton, MichiganYou can also read