NEXT GENERATION
    Synlait Milk Limited Interim Results FY18
←
→
Page content transcription
If your browser does not render page correctly, please read the page content below

NEXT GENERATION
Synlait Milk Limited Interim Results FY18
2
                                                                                                                                                                                                                                        I PG
                                                                                            DISCLAIMER

                                                                                                                                                                                                                                         Synlait Milk Limited Interim Results 2018
-   This presentation is intended to constitute a summary of certain             performance or achievements may differ materially from those            -   Forward looking statements in this presentation are unaudited and
    information about Synlait Milk Limited (“Synlait”). It should be read        expressed or implied in this presentation. No person is under any           may include non-GAAP financial measures and information. Not all
    in conjunction with, and subject to, the explanations and views in the       obligation to update this presentation at any time after its release        of the financial information (including any non-GAAP information)
    documents previously released to the market by Synlait, including            except as required by law and the NZX Main Board Listing Rules.             will have been prepared in accordance with, nor is it intended to
    Synlait’s Interim Report for the period ended 31 January 2018.                                                                                           comply with: (i) the financial or other reporting requirements of any
                                                                             -   Past performance information is given for illustration purposes only        regulatory body; or (ii) the accounting principles generally accepted
-   This presentation is provided for information purposes only. The             and is not indicative of future performance and no guarantee of             in New Zealand or any other jurisdiction with IFRS. Some figures
    information contained in this presentation is not intended to be             future returns is implied or given.                                         may be rounded and so actual calculation of the figures may differ
    relied upon as advice to investors and does not take into account                                                                                        from the figures in this presentation. Some of the information in this
    the investment objectives, financial situation or needs of any       -       While all reasonable care has been taken in relation to the                 presentation is based on non-GAAP financial information, which
    particular investor. Investors should assess their own individual            preparation of this presentation, to the maximum extent permitted           does not have a standardised meaning prescribed by GAAP and
    financial circumstances and should consult with their own legal,             by law, no representation or warranty, expressed or implied, is             therefore may not be comparable to similar financial information
    tax, business and/or financial advisers or consultants before making         made as to the accuracy, adequacy, reliability, completeness or             presented by other entities. Non-GAAP financial information in this
    any investment decision.                                                     reasonableness of any statements, estimates or opinions or other            presentation has not been audited or reviewed.
                                                                                 information contained in this presentation, any of which may
-   Certain statements in this presentation constitute forward looking           change without notice. To the maximum extent permitted by law,          -   All values are expressed in New Zealand currency unless otherwise
    statements and projections as they relate to matters other than              Synlait, its subsidiaries, and their respective directors, officers,        stated.
    statements of historical fact. Such forward looking statements               employees, contractors, agents, advisors and affiliates disclaim
    and projections are provided as a general guide only based                   and will have no liability and responsibility (including, without       -   All intellectual property, proprietary and other rights and interests in
    on management’s current expectations and assumptions and                     limitation, liability for negligence) for any direct or indirect loss       this presentation are owned by Synlait.
    should not be relied upon as an indication or guarantee of future            or damage which may be suffered by any person through use
    performance. Forward looking statements and projections involve              of or reliance on anything contained in, or omitted from, this          -   This presentation is not an offer or an invitation to acquire Synlait’s
    known and unknown risks, uncertainties, assumptions and other                presentation.                                                               shares or any other financial products and is not a product
    important factors, many of which are beyond the control of Synlait                                                                                       disclosure statement, prospectus or other offering document, under
    and which are subject to change without notice. Actual results,                                                                                          New Zealand law or any other law.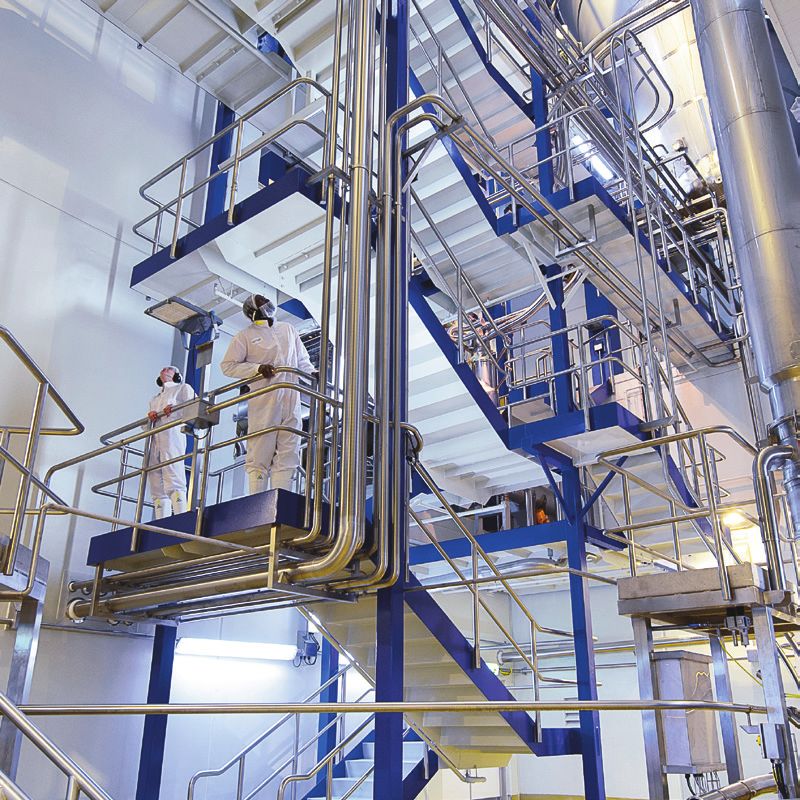
STRATEGIC UPDATE

                John Penno
MANAGING DIRECTOR AND CHIEF EXECUTIVE OFFICER
4
                                                                                                         I PG
                                   OPENING REMARKS

                                                                                                          Synlait Milk Limited Interim Results 2018
- RECORD HALF YEAR NET PROFIT OF $40.7 MILLION COMPARED TO $10.6 MILLION FOR THE SAME PERIOD LAST YEAR
  (H1 FY17) GENERATED FROM INCREASING CANNED INFANT FORMULA VOLUMES, AND IMPROVED INGREDIENTS MARGINS

- STRENGTHENED BALANCE SHEET WITH REDUCTION OF NET DEBT TO $50 MILLION FROM $147 MILLION

- ACHIEVED ORGANIC GROWTH IN INFANT FORMULA CAPACITY, WITH VOLUMES UP 36% OVER H2 FY17

- GEOGRAPHIC GROWTH INITIATED WITH COMMISSIONING OF SYNLAIT AUCKLAND AND PURCHASE OF SYNLAIT POKENO

- ANNOUNCED FOODSTUFFS SOUTH ISLAND CONTRACT TO MANUFACTURE FRESH MILK AND CREAM WITH A $125 MILLION
  INVESTMENT IN ADVANCED LIQUID DAIRY PACKAGING FACILITY TO EXPAND INTO NEW CATEGORIES

- ENHANCED CAPABILITY WITHIN SENIOR LEADERSHIP TEAM WITH THREE NEW APPOINTMENTS

- INVESTMENT IN RESEARCH AND DEVELOPMENT WITH THE OPENING OF SYNLAIT PALMERSTON NORTH

- UNLOCKING CAPACITY WITH THE COMMISSIONING OF THE NEW WETMIX KITCHEN AT SYNLAIT DUNSANDEL

- ACHIEVED CFDA REGISTRATION FOR THE a2 MILK COMPANY’STM INFANT FORMULA IN CHINA
WE ARE A
GROWTH COMPANY

                 Synlait Milk Limited Interim Results 2018          5
                                                             I PG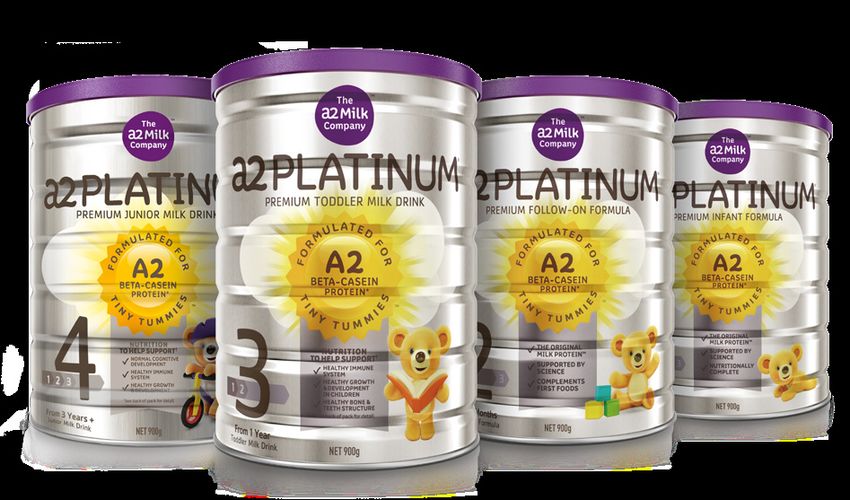
6
                                                                                                                                                 I PG
                      INGREDIENTS                         INFANT NUTRITION                EVERYDAY DAIRY                     ADULT NUTRITION

                                                                                                                                                  Synlait Milk Limited Interim Results 2018
OUR CATEGORIES

                                                                               WE WILL LEVERAGE OUR UNIQUE VALUE CHAIN IN
                   TO SUCCEED                                                  EACH CATEGORY TO BUILD SUCCESSFUL BUSINESSES
                                                                               THAT CONTRIBUTE TO OUR LONG-TERM SUCCESS

OUR VALUE CHAIN

                  DIFFERENTIATED    RESEARCH + CATEGORY        MANUFACTURING            CONSUMER           QUALITY TESTING         REGULATORY
                    MILK SUPPLY         DEVELOPMENT             EXCELLENCE              PACKAGING           LABORATORY              CAPABILITY
7
                                                                                                                                                                           I PG
                                                              OUR CATEGORIES

                                                                                                                                                                            Synlait Milk Limited Interim Results 2018
                                                                INGREDIENTS        INFANT NUTRITION                  EVERYDAY DAIRY            ADULT NUTRITION

DELIVERED IN CONSUMER,                                          BUILD SALES -
                                                                                  BLENDING + CONSUMER
                                                                                      PACKAGING II
                                                                                                                                             PRODUCT DEVELOPMENT
                                                                                                                       FRESH MILK
FOODSERVICE AND                                               PEOPLE, TECHNICAL

INGREDIENTS PACKAGING                                                                  WETMIX II                                               MARKET RESEARCH

                                                              TAILOR PRODUCT TO                                      EXPORT CREAM
                                                                CUSTOMER NEED                                        OPPORTUNITIES               RTD BLENDED
                                                                                  RTD INFANT FORMULA
                                                                                                                                                DAIRY BEVERAGE

      DIVERSIFY MARKETS - CATEGORIES, CUSTOMERS, GEOGRAPHY

                            DELIVER HIGHER VALUE PRODUCTS

                  ADAPT TO A CHANGING WORLD DEMOGRAPHIC

FOCUS ON B2B, BUT MOVE CLOSER TO CUSTOMERS AND CONSUMERS

                               BUILD SUPPLY CHAIN INTEGRITY

                                                                                               STRONG CONTRIBUTOR TO STRATEGIC GOAL   WEAK CONTRIBUTOR TO STRATEGIC GOAL
8
                                                                                                                                                                                     I PG
A PORTFOLIO OF INFANT FORMULA CUSTOMER PARTNERSHIPS

                                                                                                                                                                                      Synlait Milk Limited Interim Results 2018
                                                                                                               -   CURRENTLY AVAILABLE IN AUSTRALIA AND NEW ZEALAND

                                                                                                               -   DISTRIBUTING NATIONWIDE IN AUSTRALIA THROUGH COLES SUPERMARKETS

                                                                                                               -   PENDING U.S. FOOD AND DRUG ADMINISTRATION (FDA) REVIEW

  -   STAGE 4 INFANT FORMULA MANUFACTURED SINCE JUNE 2017

  -   CHINESE FOOD AND DRUG ADMINISTRATION (CFDA) REGISTRATION RECEIVED IN FY17

  -   EXCLUSIVE SUPPLIER OF THE a2 MILK COMPANY’S TM INFANT FORMULA TO CHINA AND
      AUSTRALASIA MARKETS

                                                    -   NEW FIVE-YEAR SUPPLY AGREEMENT SIGNED IN AUGUST 2017   -   NEW SUPPLY AGREEMENT SIGNED IN FEBRUARY 2018

                                                    -   CFDA REGISTRATION APPLICATION SUBMITTED                -   CFDA APPLICATION TO BE SUBMITTED APRIL 2018
9
                                                                                                                                                                                                                        I PG
             WE HAVE UNLOCKED INFANT FORMULA CAPABILITY

                                                                                                                                                                                                                         Synlait Milk Limited Interim Results 2018
                                                                                                 WETMIX                      THREE HIGH SPECIFICATION
                                                                                                KITCHENS                          SPRAY DRYERS
CONTRACTED FARMS                                  MILK SOLIDS                                    80,000 MT                             120,000 MT                      CONSUMER PACKAGING
      APPROX 200                               65.0m kgMS (FY17)                              MAX. CAPACITY                         MAX. CAPACITY                      93,000 MT TOTAL CAPACITY

                                                                                                                                                              BASE POWDER
                                                                                               40,000MT - November 2017
                                                                                                                                    D3 (INFANT
       62 a2 MILK   TM                                                                         WETMIX ONE                                                                        35,000 MT
                                                                                                                                 FORMULA CAPABLE)
          FARMS                                        19.8m                                    40,000 MT                                                                        (CANNING)
                                                                                                                                    40,000 MT
                                                                                                                                                                                DUNSANDEL

                                                                                                                                                                               35,000 MT
     20 GRASS FED™                                                                            WETMIX TWO                                                                       (CANNING)
                                                        6.9m                                                                        D2 (INFANT
         FARMS                                                                                 40,000 MT                                                                       AUCKLAND
                                                                                                                                 FORMULA CAPABLE)
                                                                                           (Commissioned Nov 17)                                                           (Commissioned Nov 17)
                                                                                                                                    40,000 MT
      25 LEAD WITH

                                                                                                                                                                                                            CUSTOMERS
     PRIDETM FARMS*                                     8.8m
                                                                                                                                                                               23,000 MT
                                                                                                                                                                              SACHET LINES
                                                                                                                                                                                PLANNED
                                                                                      Wetmix Two enables both of our
                                                                                   large-scale infant formula spray dryers         D1 (INFANT-GRADE                   Synlait Auckland’s new blending and
       91 REGULAR                                                                      to simultaneously manufacture                  WMP + SMP)                       canning line doubles our canned
          FARMS                                        27.6m                             infant formula base powder.                    40,000 MT                            infant formula capacity.

                                                                                                                                       20,000 MT
                                                                                                                                      AMF(1) PLANT

                                               1.7m Other Suppliers

 *Some Lead With PrideTM farms also supply a2 MilkTM and Grass FedTM, total Lead With PrideTM farms is 53.                       Note: (1) AMF = Anhydrous Milk Fat
10
                                                                                 I PG
                 SECOND NUTRITIONAL POWDER MANUFACTURING

                                                                                  Synlait Milk Limited Interim Results 2018
                           SITE: POKENO, WAIKATO

- Synlait is investing in nutritional powder manufacturing capacity
  to meet customer demand for infant formula products

- Establishing this capacity on a second site allows mitigation of our
  current single-site risk

- Also introduces access to a second milk pool which further reduces
  our risk profile

- Our site acquired in Pokeno, North Island meets these needs while
  also providing a platform for growth in other categories

- Initial investment on site will be one infant formula capable spray
  dryer and related infrastructure at a cost of circa $260 million, capable of
  manufacturing 40,000 MT of infant base powder per annum

- Investment to be funded through debt facilities
11
I PG
Synlait Milk Limited Interim Results 2018
TRANSFORMATIONAL IN THE DAIRY INDUSTRY, SYNLAIT’S LEAD WITH PRIDE™
PROGRAMME RECOGNISES AND REWARDS THOSE SUPPLIERS WHO ARE ACHIEVING
DAIRY FARMING EXCELLENCE. LEAD WITH PRIDE™ IS AUSTRALASIA’S ONLY
INTERNATIONALLY ACCREDITED ISO / IEC 17065 DAIRY FARM ASSURANCE SYSTEM
AND MEASURES DAIRY FARMS ON FOUR PILLARS OF DAIRY FARMING; ENVIRONMENT,
ANIMAL HEALTH AND WELFARE, MILK QUALITY, AND SOCIAL RESPONSIBILITY.
LEAD WITH PRIDE™
PROGRAMME PILLARS
ENVIRONMENT MILK QUALITY ANIMAL HEALTH AND WELFARE SOCIAL RESPONSIBILITY12
I PG
ENTRY INTO EVERYDAY DAIRY WITH LIQUID MILK
Synlait Milk Limited Interim Results 2018
- Exclusive supply arrangement with Foodstuffs South Island to supply private label
fresh milk and cream (Value and Pams brands) from early 2019
- Distributed in their network of PAK’n SAVE, New World, Four Square and On The Spot stores
- Ten year agreement with demand to underpin capital investment
- $125 million modern and sophisticated advanced liquid dairy packaging facility
to be constructed at our Dunsandel site
- Investment to be funded through debt facilities
- Annual capacity of 110 million litres of which one third will be initially utilised for
Foodstuffs South Island products
- Synlait’s current milk supply adequate to meet the volumes of the contract
- New facility will be capable of manufacturing a range of traditional and new products
- New product development to be supported from our new R+D centre in Palmerston North
- Long life cream export category also presents attractive opportunities we intend to pursue13
I PG
MASSEY AND FOODPILOT CORE TO
Synlait Milk Limited Interim Results 2018
DELIVERING SYNLAIT’S ASPIRATIONS
- Synlait Palmerston North was opened on Friday 2 March by Massey
University’s Vice Chancellor, Professor Jan Thomas, and the mayor of
Palmerston North, Grant Smith
- Our Palmerston North R+D capability consists of a laboratory, office
and access to Massey University’s FoodPilot plant
- FoodPilot is the largest and best equipped publically accessible
pilot plant in the Southern Hemisphere
- Massey University offers access to an extensive network of expertise
- Extensive lab facilities covering multiple disciplines
- Palmerston North is the hub of dairy R+D in New Zealand
(surrounded by Crown Research Institutes like Ag Research, Plant and Food)
- While Palmerston North will initially focus on dairy liquids, we have R+D
teams elsewhere working on nutritional powders, packaging and many
other areas14
I PG
PEOPLE
Synlait Milk Limited Interim Results 2018
Deborah Marris - GENERAL COUNSEL AND Dr. Suzan Horst - DIRECTOR OF QUALITY, REGULATORY Hamish Reid - GENERAL MANAGER OF BRAND AND
HEAD OF COMMERCIAL AND LABORATORY SERVICES CHIEF SUSTAINABILITY OFFICER
Deborah Marris is joining Synlait from her previous role Suzan Horst has most recently been Director Quality Hamish Reid takes the lead on developing Synlait’s
as Managing Director, Global Compliance with Barclays Affairs, Business Group EMEA (Europe, the Middle strategy for sustainability with a particular focus on our
Bank, India. East and Africa) for FrieslandCampina. She has held aspiration to further improve our environmental and
other senior roles since joining them in 2005, including social performance from farm to fridge. He will also lead
Prior to that she held senior executive roles with other Director Corporate QA, crisis and issue management and our thinking as we continue evaluating potential B2C
global organisations, including as General Counsel (Asia Corporate Quality Assurance Manager. opportunities.
Pacific, Europe and America), Chief of Staff (New Zealand)
and also Head of Tax (New Zealand) for ANZ Bank. Prior to joining FrieslandCampina, Suzan was Global Food Hamish has deep experience in food and beverage
Safety Competence Manager for Nutreco B V and lectured marketing, predominantly for Danone in Paris and
Deborah established her career initially with 15 years agricultural economics and food safety before that. Saatchi & Saatchi in London. More recently, Hamish
working as a senior lawyer for firms throughout New has established an award-winning not-for-profit in New
Zealand, the United Kingdom and Hong Kong. Suzan holds a Ph.D. in Agricultural Economics and Zealand and consulted to businesses around the world
a Bachelor of Science in Animal Husbandry from the developing environmental and social programmes that
Deborah holds a Bachelor of Commerce and Wageningen University and Research Centre in the boost economic performance.
Administration and a Bachelor of Laws (Hons) from Netherlands, part of which involved study at Massey
Victoria University of Wellington and is a qualified barrister University in New Zealand.
and solicitor in New Zealand.OUR FINANCIAL RESULTS
Nigel Greenwood
CHIEF FINANCIAL OFFICER16
I PG
OVERVIEW
Synlait Milk Limited Interim Results 2018
$ MILLIONS NET PROFIT AFTER TAX
45.0
40.7
40.0
35.0
- First half profit eclipses all previous results 30.0 27.6
24.2
25.0
- Profit growth is product margin led, driven by increasing 20.0
canned infant formula volumes, and improved ingredients 15.0
10.2 10.6
margins 10.0
5.0
- First half performance includes some gains not expected 0
to be repeated in the second half H1 FY16 H2 FY16 H1 FY17 H2 FY17 H1 FY18
$ MILLIONS IFC VOLUME DRIVES NPAT IFC SALES MT
- Lower debt levels have continued to improve profit and 45.0 16,839 18,000
loss leverage 40.0 16,000
35.0 14,000
12,427
30.0 12,000
10,753
EBIT INCREASED TO NET DEBT DECREASED FROM 25.0 10,000
$61.2m $147m
20.0 8,000
6,349
15.0 5,246 6,000
$50m
10.0 4,000
TO
(H1 FY17: $21.9m)
5.0 2,000
0 0
H1 FY16 H2 FY16 H1 FY17 H2 FY17 H1 FY18
IFC Volume Underlying NPAT17
I PG
SALES VOLUME
Synlait Milk Limited Interim Results 2018
MT SALES VOLUME
100,000
80,000
12,427
- H1 FY18 powders and cream volumes down on prior year due to:
60,000
10,753
6,349 67,895 16,839
- Increase of milk consumed in canned infant formula
40,000 5,246 59,285
54,693
- Sell down of distressed inventory in H1 FY17 44,435
20,000
41,102
- Despite lower sales volume, the proportion of powders and
cream sold in the first half relative to full year expectations was 0
H1 FY16 H2 FY16 H1 FY17 H2 FY17 H1 FY18
48% (H1 FY17 45%)
Powders and Creams Consumer Packaged
- Growth trajectory of canned infant formula has continued, with
total consumer packaged volumes nearly tripling from the same MT FINISHED GOODS INVENTORY
period last year and up 36% on H2 FY17 60,000
50,000
45,185
- Finished goods inventory of 35,040 MT was 18% lower than 42,962
H1 FY17, reflecting improved inventory management and 40,000
35,040
supporting growth in operating cash flow 30,000
21,042
20,000
14,504
10,000
0
H1 FY16 H2 FY16 H1 FY17 H2 FY17 H1 FY18
Sales volumes for specialty ingredients are not shown on the graph.18
I PG
PRODUCTION VOLUME
Synlait Milk Limited Interim Results 2018
MT PRODUCTION VOLUME MILLIONS KGMS
100,000 45.0
- First half contracted milk supply consistent with prior
years’ collections at 41.4 million kgMS
40.0
- Total production volumes slightly down on H1 FY17 80,000
7,088 17,821
35.0
(81,815 MT vs 82,980 MT) 5,714
- Increased infant base powder production to meet 60,000
25.0
75,886 64,001
canned infant formula demand has seen 3.3 million kgMS
69,257
sold (0.4 million kgMS H1 FY17) 12,315
20.0
10,329
40,000
- Milk production exhibits seasonality that drives overhead 15.0
recovery, with 61% of expected FY18 milk processed in H1
10.0
35,541 39,550
20,000
5.0
0 0
H1 FY16 H2 FY16 H1 FY17 H2 FY17 H1 FY18
Powders and Creams Consumer Packaged Milk Processed
Sales volumes for specialty ingredients are not shown on the graph.19
I PG
GROSS PROFIT PER METRIC TONNE
Synlait Milk Limited Interim Results 2018
- Consumer packaged sales volume growth and improved ingredient
margins have driven the increase in gross profit per MT from $830 per MT
$ GROSS PROFIT PER MT
to $1,390 per MT 1,600
1,390
1,400
- Margin expansion has been:
1,200
- Reduced sales of powders and cream products (18.8%) following 1,000 900
839 830
the uncommon sell down in H1 FY17 800 716
- High utilisation of all facilities, particularly Wetmix and consumer 600
packaging 400
- Intra-seasonal timing differences that are not forecast to repeat in the 200
second half 0
H1 FY16 H2 FY16 H1 FY17 H2 FY17 H1 FY18
- Reduction of onerous contracts provision from $6.2 million in H1 FY17
to $0.2 million in H1 FY18 $ MILLIONS GROSS PROFIT
90.0 85.2
- All of these have supported a $41.5 million increase in Gross Profit to 80.0
66.7
$85.2 million 70.0
58.7
60.0
- Management expect some of this margin expansion to retrace in the 50.0
41.7 43.7
40.0
second half due to:
30.0
- Spare capacity following commissioning of our new Wetmix and 20.0
consumer packaging facilities 10.0
- Seasonal variation in milk production 0
H1 FY16 H2 FY16 H1 FY17 H2 FY17 H1 FY18
- Sales phasing upside not expected to be repeated in H2 FY1820
I PG
OVERHEADS
Synlait Milk Limited Interim Results 2018
$ MILLIONS OVERHEADS
30.0
3.5 0.6 (0.4) (0.9)
- Net overheads have increased by 13.1% over H1 FY17 to $24.5 million, 24.5
25.0
21.7
however only $1.4 million, or 6%, above H2 FY17
20.0
- Largest driver of the increase is employee costs, which reflects the 15.0
continued investment into capability for research and development,
10.0
business development and leadership to support continuing growth
and diversification 5.0
0
H1 FY17 Employee costs Consultancy ASX Listing Other H1 FY18
$ MILLIONS
OVERHEADS
30.0
24.5
25.0 23.1
21.7 21.7
20.0
17.0
15.0
10.0
5.0
0
H1 FY16 H2 FY16 H1 FY17 H2 FY17 H1 FY1821
I PG
OPERATING CASH FLOW
Synlait Milk Limited Interim Results 2018
$ MILLIONS YEAR-ON-YEAR OPERATING CASH FLOW
100.0
13.8 (12.1)
- Synlait generated strong operating cash flows in H1 FY18 of 75.0
80.0 21.9
$75.0 million. This is an improvement of $89.2 million from the
same period last year and pleasing in the part of the year that 60.0 32.0
typically experiences weak cash flows
40.0
33.6
- The improvement in operating cash flow has been driven by: 20.0
(14.2)
- Better sales deliveries resulting in lower inventory on hand, 0
generating $33.6 million (20.0)
Inventory Reduction Milk payments Other
- Increased sales to customers in our receivables H1 FY17 Receivables Assigned Customer Deposits H1 FY18
assignment program increasing from $38.5 million $ MILLIONS OPERATING CASH FLOW
to $70.5 million 140.0 129.3
120.0
- Returning to more traditional advance rate profiles for 100.0
100.4
contracted milk suppliers from abnormally high rates 80.0
75.0
in H1 FY17, generating a further $21.9 million of 60.0
operating cash flow 40.0
20.0
- Increased infant formula sales leading to increased 4.0
0
customer deposits of $13.8 million
-20.0
(14.2)
-40.0
H1 FY16 H2 FY16 H1 FY17 H2 FY17 H1 FY1822
I PG
NET DEBT
Synlait Milk Limited Interim Results 2018
$ MILLIONS NET DEBT
300.0
250.0
89.6 (204.3)
- Record operating cash flow generation of $204.3 million
200.0
for the 12 months ended 31 January 2018 has fully
146.6
funded our capital expenditure program and enabled the 150.0
reduction of debt to low levels
100.0
7.1 49.7
10.7
- In the 12 months to 31 January 2018, Synlait has 50.0
invested $89.6 million in capital expenditure. The major
0
components of this were Synlait Auckland ($49.1 million) H1 FY17 Capex Operating Cash Flow Interest Other H1 FY18
and our new Wetmix kitchen ($29.2 million)
$ MILLIONS NET DEBT NET DEBT / EBITDA
5.0
- This leaves the company well placed to fund its expansion 350.0
292.0 4.5
plans in Dunsandel (advanced liquid dairy packaging 300.0
4.0
facility $125 million) and Pokeno ($260 million infant 250.0 3.5
213.4
formula manufacturing facility) 3.0
200.0
2.5
146.6
150.0
2.0
100.0 82.3 1.5
49.7 1.0
50.0
0.5
0 0.0
H1 FY16 H2 FY16 H1 FY17 H2 FY17 H1 FY18
1
Based on a rolling 12 month EBITDA (trailing) 4.6X 0.4X
DEBT / EBITDA 1OUTLOOK
John Penno
MANAGING DIRECTOR AND CHIEF EXECUTIVE OFFICER24
I PG
SECOND HALF RETURNS
Synlait Milk Limited Interim Results 2018
MT CANNED INFANT FORMULA SALES
20,000
- The material increase in first half earnings has been
18,000
achieved from both large increases in manufacture and 18,000
16,839
sales of our highest margin products, and through improved
16,000
margin, and earlier sales of our ingredients products
14,000
- This earlier phasing of ingredients, combined with 12,427
increasing commitments to R+D and business development, 12,000
10,753
means earnings in the second half are expected to be lower
10,000
than the first half
8,000
- Although the second half of FY18 is not expected to be as 6,349
strong as the first half, we continue to forecast strong overall 6,000 5,246
earnings growth for the full year
4,000
- Looking forward into FY19, ongoing growth in infant formula 2,000
volumes are expected to continue to grow earnings
0
H1 FY16 H2 FY16 H1 FY17 H2 FY17 H1 FY18 H2 FY18
ACTUAL FORECASTAPPENDIX
Synlait Milk Limited Interim Results 2018 25
I PG26
I PG
GROSS PROFIT PER MT (POWDERS AND CREAM)
Synlait Milk Limited Interim Results 2018
$ POWDERS AND CREAM GROSS PROFIT PER MT
1,200
1,115
1,000
837
800
726
692
667
600
400
200
0
H1 FY16 H2 FY16 H1 FY17 H2 FY17 H1 FY1827
I PG
GROSS PROFIT PER MT (CONSUMER PACKAGED)
Synlait Milk Limited Interim Results 2018
$ CONSUMER PACKAGED GROSS PROFIT PER MT
900
842
800
800
762
700
600
490
500 463
400
300
200
100
0
H1 FY16 H2 FY16 H1 FY17 H2 FY17 H1 FY1828
I PG
LACTOFERRIN UPDATE
Synlait Milk Limited Interim Results 2018
$ LACTOFERRIN GROSS PROFIT PER MT
250,000
- Synlait has a strong and growing customer base for lactoferrin,
spanning from use in health supplements to infant formula 213,681
200,000
- A demand and supply imbalance is driving a global strengthening
in lactoferrin prices 150,000
145,030
- Demand for lactoferrin is driven by increasing use in infant
formula, particularly in China 100,000
- Synlait is well placed to deliver to global demand, with significant 50,000 40,540
expertise in lactoferrin production 19,203
0
- In FY17, Synlait also gained FDA approval to export lactoferrin
to the U.S. market for use in infant formula, enabling further
market opportunities -50,000 -37,510
-100,000
H1 FY16 H2 FY16 H1 FY17 H2 FY17 H1 FY18INVESTORS MEDIA Casey Blatch, Strategic Finance Manager Dan Walraven, Communications Manager +64 3 373 3091 +64 27 836 7532 Casey.Blatch@synlait.com Daniel.Walraven@synlait.com
You can also read