Frasers Centrepoint Trust - Investor Presentation November 2020 - Frasers Property
←
→
Page content transcription
If your browser does not render page correctly, please read the page content below
Frasers Centrepoint Trust
Investor Presentation
November 2020
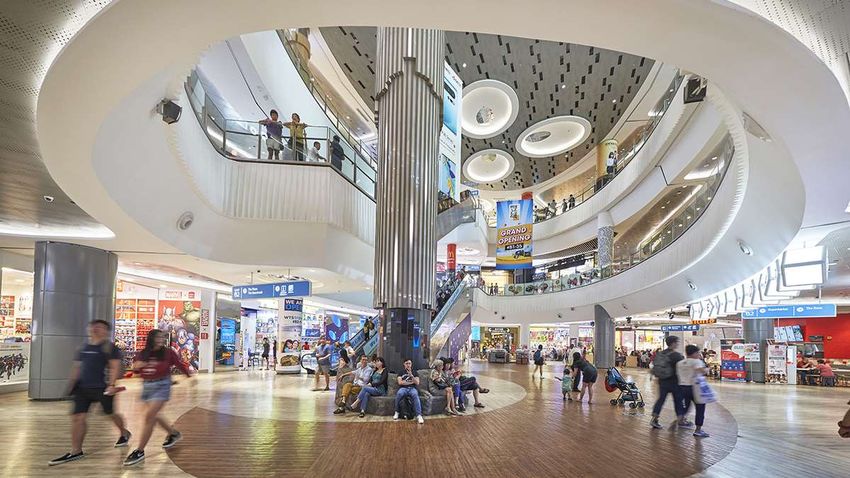
WATERWAY POINT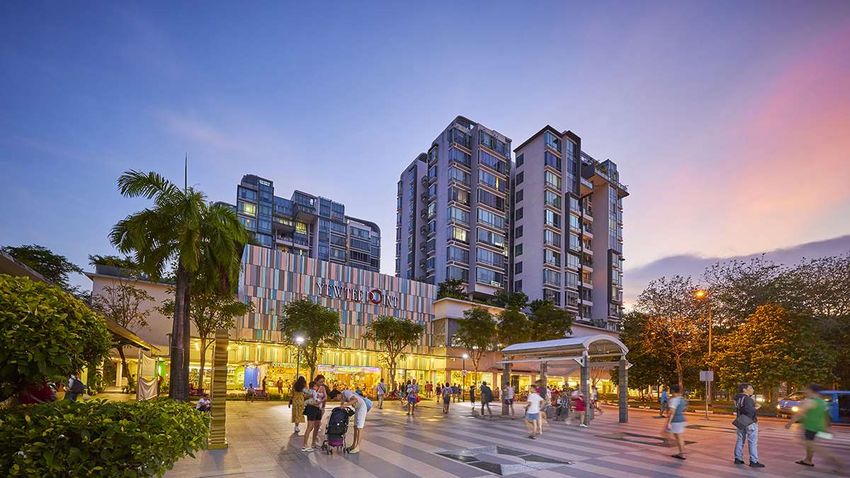
•   Certain statements in this Presentation constitute “forward-looking statements”, including forward-looking financial information. Such forward-looking statement and financial information involve known
    and unknown risks, uncertainties and other factors which may cause the actual results, performance or achievements of FCT or the Manager, or industry results, to be materially different from any
    future results, performance or achievements expressed or implied by such forward-looking statements and financial information. Such forward-looking statements and financial information are based
    on numerous assumptions regarding the Manager’s present and future business strategies and the environment in which FCT or the Manager will operate in the future. Because these statements and
    financial information reflect the Manager’s current views concerning future events, these statements and financial information necessarily involve risks, uncertainties and assumptions. Actual future
    performance could differ materially from these forward-looking statements and financial information.
•   The Manager expressly disclaims any obligation or undertaking to release publicly any updates or revisions to any forward-looking statement or financial information contained in this Presentation to
    reflect any change in the Manager’s expectations with regard thereto or any change in events, conditions or circumstances on which any such statement or information is based, subject to compliance
    with all applicable laws and regulations and/or the rules of the SGX-ST and/or any other regulatory or supervisory body or agency. The value of Units in FCT and the income derived from them may
    fall as well as rise. The Units in FCT are not obligations of, deposits in, or guaranteed by, the Manager or any of their affiliates. An investment in the Units in FCT is subject to investment risks,
    including the possible loss of the principal amount invested. Unitholders of FCT should note that they have no right to request the Manager to redeem their Units while the Units are listed. It is intended
    that Unitholders of FCT may only deal in their Units through trading on the SGX-ST. Listing of the Units on the SGX-ST does not guarantee a liquid market for the Units.
•   This Presentation contains certain information with respect to the trade sectors of FCT’s tenants. The Manager has determined the trade sectors in which FCT’s tenants are primarily involved based
    on the Manager’s general understanding of the business activities conducted by such tenants. The Manager’s knowledge of the business activities of FCT’s tenants is necessarily limited and such
    tenants may conduct business activities that are in addition to, or different from, those shown herein.
•   This Presentation is for information only and does not constitute an invitation or offer to acquire, purchase or subscribe for any securities of FCT. The past performance of FCT and the Manager is not
    necessarily indicative of the future performance of FCT and the Manager.
•   This Presentation includes market and industry data and forecast that have been obtained from internal survey, reports and studies, where appropriate, as well as market research, publicly available
    information and industry publications. Industry publications, surveys and forecasts generally state that the information they contain has been obtained from sources believed to be reliable, but there
    can be no assurance as to the accuracy or completeness of such included information. While the Manager has taken reasonable steps to ensure that the information is extracted accurately and in its
    proper context, the Manager has not independently verified any of the data from third party sources or ascertained the underlying economic assumptions relied upon therein.
•   This advertisement has not been reviewed by the Monetary Authority of Singapore.

                                                                                                                                                                                                              2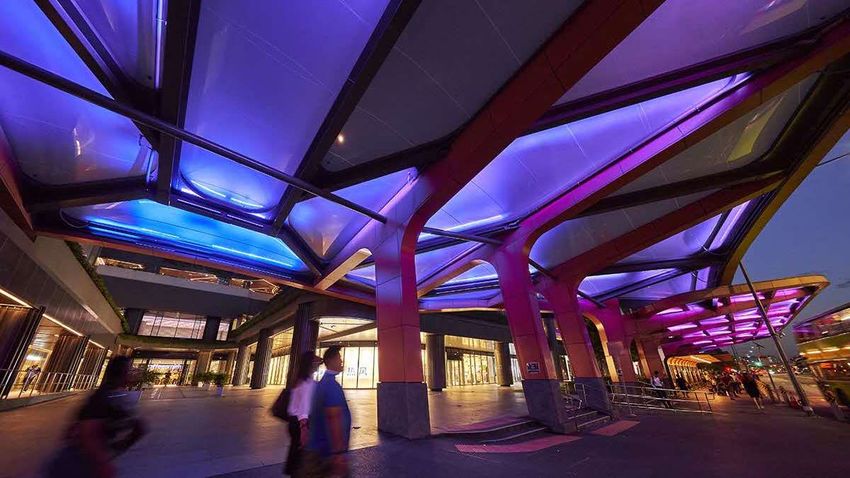
• Listed on the Main Board of the Singapore Exchange
  Securities Trading Limited since 5 July 2006
• Market capitalisation of approximately S$3.6 billion as at
  30 Oct 2020
• Managed by Frasers Centrepoint Asset Management Ltd.                                                  Causeway Point      Northpoint City North Wing   Waterway Point

  a wholly-owned subsidiary of Frasers Property Limited

                    Key Figures of the FCT’s Retail Portfolio1
                                                                                                        Tampines 1          Century Square               Changi City Point

               11                         >2.3 million sq ft                      S$    6.65 billion
        Suburban malls                       Retail portfolio NLA                       Total assets2

        >1,500                                   3.0million                             800,000         Tiong Bahru Plaza   White Sands                  YewTee Point

     Retail portfolio leases              Catchment population3                         FRx members4

1.    Excludes Central Plaza (an office building) and FCT’s investment in Hektar REIT
2.    FCT’s total assets including Central Plaza and investments in H-REIT
3.    Based on 3km catchment of the retail properties. Source: Cistri, August 2020                      Hougang Mall        Anchorpoint
4.    FRx: Frasers Experience. As at end September 2020
                                                                                                                                                                             3
Share of suburban retail mall space in Singapore

  10.6%               10.2%
                                            8.8%

                                                                 7.0%
                                                                                     6.1%
                                                                                                          5.5%
                                                                                                                              4.7%
                                                                                                                                     3.3%
                                                                                                                                            2.4%

CapitaLand          Frasers               NTUC               Lendlease                HDB             Mapletree    Changi      Far East    UOL Group
 Mall Trust1       Centrepoint          Entrerprise                                                  Commercial Airport Group Organisation  Limited
                     Trust                                                                             Trust

Source: Cistri , August 2020. Data as at the first quarter of 2020 ended 31 March 2020. FCT’s market share excludes Bedok Point.
1 CapitaLand Mall Trust was renamed as CapitaLand Integrated Commercial Trust from 3 November 2020

                                                                                                                                                       4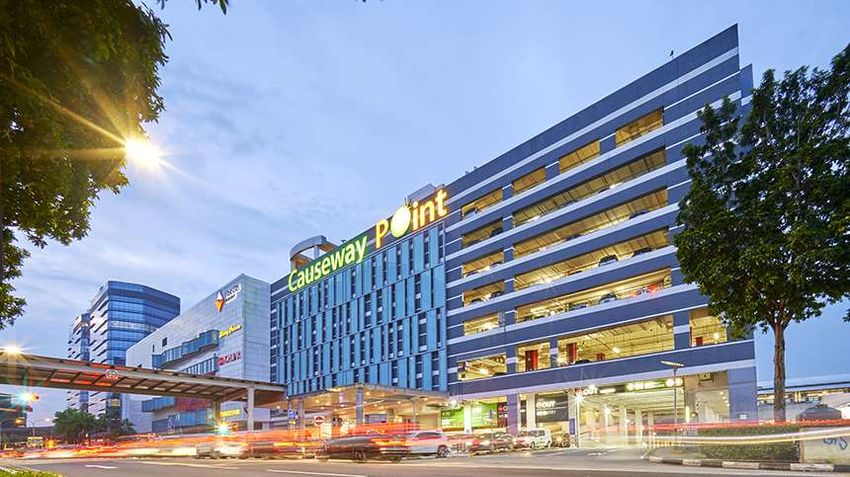
◆   Properties are near homes and within minutes to transport nodes

                                                                                              All retail properties are conveniently located
                                                                                              near homes and within minutes to transport
                                                                                                                 amenities

                                                                                                  Catchment population of 3 million1
                                                                                                underpins stable and recurring shopper
                                                                                                                footfall

                                                                                               High proportion of necessity spending, F&B
                                                                                              and Essential Services that provide relevance
                                                                                                             to consumers

     1. Population in overlapping areas are only counted once. Source: Cistri, August 2020.

                                                                                                                                               5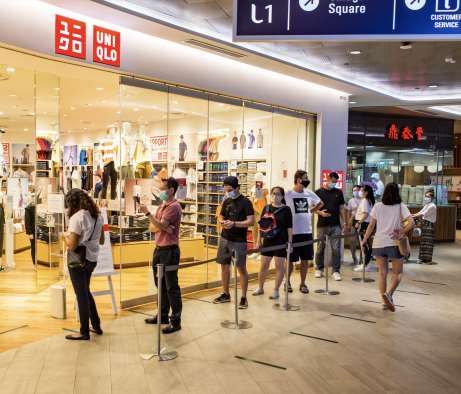
• The suburban retail sector in Singapore has a lower retail space per capita compared with the national average
  of 6.4 sq ft per capita, which is comparatively lower than regional cities like Hong Kong and Kuala Lumpur

                                                                                              Shopping Centre Floor Space per Capita (sq ft NLA)
     National Average: 6.4

                                                                                                       USA (2018)                         23.1

                                                                                                   Australia (2018)                11.4
                                                                                                                      1
                                                                                                 Hong Kong (2015)                 10.1

                                                                                              Kuala Lumpur (2019)                 9.9

                                                                                                 Singapore (2025)           6.5

                                                                                                 Singapore (2019)           6.4

                                                                                                        UK (2018)         4.6

 Source: Cistri
 1.   Based on 2015, which is the Independent Market Research Consultant’s most recent data
                                                                                                                                                   6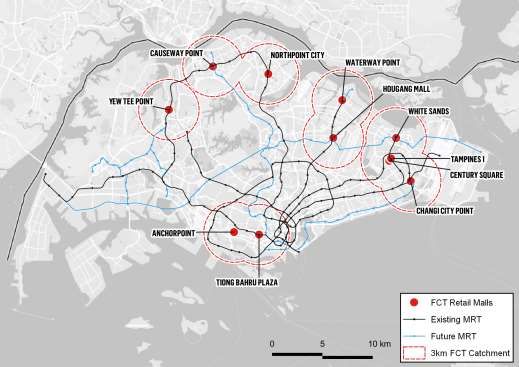
Proportion of Nett Lettable Area allocated To                                                                             FCT Retail Portfolio3
                   Essential Services1 (%)                                                                                         Essential Services1 by Gross Rental Income

•        Suburban retail malls generally have higher proportion of NLA
         allocated to Essential Services than central malls
                                                                                                                                        Non-
                                                                                                                                      essential
                                                        FCT Retail      Portfolio3:                                                   Services
                                                        45.2%                                                                          46.4%                                                 F&B,
                                                                                                                                                                                            36.7%

  Suburban
                                 40.0%                                   60.0%
 Retail Malls 2
                                                                                                                                                                                             Essential
                                                                                                                                                                                             Services
                                                                                                                                                                                              53.6%
                   2
Central Malls          20.0 - 30.0%                           70.0 – 80.0%

                                                                                                                                                                          Services,
                                                                                                                                                                             8.3%
                                                                                                                                            Beauty & Health,  Supermarket &
                   % of Essential Services            % of Non Essential Services                                                                2.9%        Hypermarket, 5.7%

    1.     The groupings of essential and non-essential services are based on Ministry of Trade and Industry’s press release on 21 April 2020. Note that the individual product group may
           not align perfectly to the announced Essential Services
    2.     Source: Cistri
    3.     Based on the FCT’s portfolio of 11 retail malls
                                                                                                                                                                                                         7
No single property represents more than 22% of the portfolio’s aggregate value

                                                                                                                                        Asset Value by Property 1,2
                                                                                                                                  YewTee Point             Anchorpoint
                                                                                                                                      3.1%                    1.8%
                                                                                                                          Changi City
                                                                                                                            Point                                                            Causeway
                                                                                                                            5.6%                                                               Point
                                                                                                                                                                                              21.5%
                                                                                                                      White Sands
                                                                                                                         7.0%

                                                                                                                    Hougang Mall
                                                                                                                       7.1%
                                                                                                                                                                                                    Northpoint
                                                                                                                                                                                                    City North
                                                                                                                                                                                                      Wing
                                                                                                                                                                                                     13.3%
                                                                                                                      Waterway
                                                                                                                       Point3
                                                                                                                       8.6%

                                                                                                                       Century                                                                  Tampines 1
                                                                                                                       Square                                                                     11.8%
                                                                                                                                       Tiong Bahru
                                                                                                                        9.4%              Plaza
                                                                                             Tampines 1
                                                                                                                                          10.8%

1.   The asset values of Causeway Point, Northpoint City North Wing (including Yishun 10 retail podium), Waterway Point, Changi City Point, YewTee Point and Anchorpoint are based on appraised values as
     announced on 25 September 2020.
2.   The asset values of Tampines 1, Tiong Bahru Plaza, Century Square, Hougang Mall and White Sands are based on agreed values as disclosed in the Circular to Unitholders Dated 3 September 2020 in relation to
     the acquisition of the remaining 63.11% in AsiaRetail Fund Limited (ARF). Central Plaza is not included in this chart.
3.   Valuation based on 40.0% stake in SST. FCT owns 40% stake in SST which holds the interest in Waterway Point and the proportionate valuation is S$520.0 m
                                                                                                                                                                                                                    8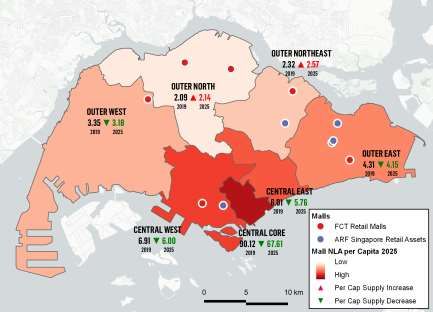
Highlights
                                                                                                   Debt maturity profile of FCT post the Acquisition of ARF1
     Gearing     ratio2   (%)                                  39.3                                Amount in S$ million

     Average cost of debt (%)                                  2.33
                                                                                                                                                         $608 m
     Weighted average debt maturity
                                                               4.34
     (years)
                                                                                                                                                           119

     ✓         Well-spaced out debt maturity                                                                                           $391 m                             $382 m
                                                                                                                                                                                            $350 m
                                                                                                                                                                                                             $370 m

     ✓
                                                                                                                                                                             70
               Minimal near-term refinancing needs
                                                                                                                      $235 m              200

     ✓
                                                                                                                         5                                 489
                                                                                                                        30
               Low cost of debt at 2.3%                                                                                                                                                                          370
                                                                                                                                                                                              350
                                                                                                                                                                             312

     ✓         S$545 million of undrawn revolving credit
               facilities provides for sufficient liquidity
                                                                                                      $50 m

                                                                                                        50
                                                                                                                         200              191

                                                                                     FY20             FY21              FY22             FY23             FY24             FY25              FY26                FY27

                                                                                                    Secured bank borrowings         Unsecured bank borrowings          MTN         Revolving Credit Facilities

1.   As disclosed in the announcements on 3 September 2020 and 16 September 2020
2.   Computed as gross borrowings over total assets. In accordance with the Property Funds Appendix, the gearing ratio included FCT’s 40% proportionate share of deposited property value and borrowing in SST
3.   Blended average cost of borrowing of FCT and ARF Singapore Retail Assets
4.   Blended weighted average debt maturity of FCT and ARF Singapore Retail Assets
                                                                                                                                                                                                                        9
Highlights from Financial Results for the
Second Half and Financial Year 2020 ended
30 September 2020
Released on 3 November 2020

                                            Waterway Point, Singapore
Key events in FY2020
Steadfast in our goals amidst tough times
7 April: Start of Circuit 1 June: The Circuit 19 June: Start of 30 June: FCT 3 Sep: FCT announced the 28 Sep: Unitholders’ approval
Breaker:- Only essential trades Breaker lifts and Phase 2 : Reopening announced the acquisition of the remaining 63.1% obtained for the ARF Acquisition and
like supermarkets, pharmacies Singapore enters of most retail trades acquisition of an interest in ARF for S$1.06 billion divestment of Bedok Point at an EGM
and F&B (takeaway only) Phase One of and F&B dine-in additional 12% (“ARF Acquisition”) and the
allowed to operate reopening allowed interest in ARF divestment of Bedok point FCT launched equity fund raising
(“EFR”) to raise gross proceeds of no
less than approximately S$1327.3
March 26: All bars, million. Proceeds from the EFR are
cinemas and to, inter alia, fund the ARF Acquisition
entertainment outlets and to pare down debts
are closed
Feb 7: MOH raises
the Dorscon level
from yellow to orange
23 Jan: Singapore's Frasers Property Retail rolled out two tenant Tenants’ sales and shopper traffic started to recover
first confirmed support packages in February and March 2020 since phase 2 re-opening
COVID case
------ Significant COVID-19 event and Circuit Breaker
------ Phased re-opening of the economy
------ FCT’s acquisitions of AsiaRetail Fund Limited (”ARF”)
11FY2020 Results overview
Unprecedented challenges due to the COVID-19 pandemic
FY2020
(year-on-year change)
Gross Revenue S$164.38 million
▼ 16.3%
Net property income (NPI) S$110.89 million
▼ 20.4%
Distribution per Unit (DPU) 9.042 S cents
▼ 25.1%
Gearing level 35.9%
as at 30 September 2020 ▲ 3.0%-point
2.4%
Average cost of borrowings
▼ 0.2%-point
94.9%
Portfolio occupancy1
▼ 1.6%-point
Year-to-date rental reversion 4.2%
(mid-point to mid-point) ▼ 0.6%-point
Net asset value per Unit S$2.27
Waterway Point, Singapore as at 30 September 2020 ▲ 2.7%
1. Includes Waterway Point
122H20 and FY2020 results highlights
• Excluding the impact from the rental relief1 which amounted to S$27.35 million1,2, FY2020 revenue and net
property income (“NPI”) would have decreased 2.4% and 0.7% year-on-year, respectively
S$ million 2H20 2H19 Change FY2020 FY2019 Change
Gross revenue 64.46 97.37 ▼ 33.8% 164.38 196.39 ▼ 16.3%
Gross revenue if rental relief impact was excluded3 91.81 97.37 ▼ 5.7% 191.73 196.39 ▼ 2.4%
Property expenses 25.85 29.92 ▼ 13.6% 53.49 57.10 ▼ 6.3%
NPI 38.61 67.45 ▼ 42.8% 110.89 139.28 ▼ 20.4%
NPI if rental relief impact was excluded3 65.96 67.45 ▼ 2.2% 138.24 139.28 ▼ 0.7%
Income available for distribution before dividends 5.85 50.71 ▼ 88.5% 57.40 105.05 ▼ 45.4%
Dividends from associates and joint ventures4 24.27 11.51 ▲ 110.9% 43.75 13.67 ▲ 220.0%
Income available for distribution 30.12 62.22 ▼ 51.6% 101.15 118.72 ▼ 14.8%
Distribution to Unitholders 48.94 62.47 ▼ 21.7% 101.15 119.65 ▼ 15.5%
Distribution per Unit (S cents) 4.372 5.913 ▼ 26.1% 9.042 12.070 ▼ 25.1%
1. Qualifying commercial landlords are mandated under the Government’s rental relief framework to provide 2 months of rental waivers for eligible tenants. FCT has complied fully with this requirement. This amount
is for the six properties: Causeway Point, Northpoint City North Wing (including Yishun 10 retail podium), Changi City Point, YewTee Point, Bedok Point and Anchorpoint.
2. Up to 30 September 2020
3. For illustration and reference only
4. Includes dividends from FCT’s stake in ARF and SST. This amount excludes interest income from SST. The increase was due mainly to the full year contributions of dividend received from FCT’s investments in
ARF and Sapphire Star Trust 13Gross revenue by properties in FY2020
Impact to performance due mainly to rental rebate provided to tenants in 2H20
Gross Revenue (S$ million)
(year-on-year change)
FY2020 FY2019
Based on FCT’s
40.0% share of results
in joint venture
Sapphire Star Trust
196.39 which holds Waterway
▼16.3% Point. FCT acquired
164.38 the stake in SST in 12
July 2019, hence
there is no year-on-
year comparison with
FY2019
▼15.3%
86.46
73.24 ▼16.4%
53.09
44.40 ▼20.5%
▼13.5%
▼19.7% ▼13.2%
21.73 27.34 26.21
12.49 14.44 6.87 8.55 5.65 6.51
1 2
FCT Invt. Causeway Point Northpoint City Changi City Point YewTee Point Anchorpoint Bedok Point Waterway Point
Properties North Wing
1. Includes Causeway Point, Northpoint City North Wing (and Yishun 10 retail podium), Changi City Point, YewTee Point, Anchorpoint and Bedok Point
2. FCT acquired the initial shares in SST (which holds Waterway Point) on 12 July 2019. FCT ’s share of revenue in SST in FY2019 for the period 12 July – 30 September 2019 (approximately 2.5 months) was S$5.72 million
14Property expenses by properties in FY2020
Property expenses (S$ million)
(year-on-year change)
FY2020 FY2019
Based on FCT’s
40.0% share of results
in joint venture
Sapphire Star Trust
▼6.3%
57.10 which holds Waterway
53.49 Point. FCT acquired
the stake in SST in 12
July 2019, hence
there is no year-on-
year comparison with
FY2019
▼1.8%
20.31 20.69
▼7.3%
12.87 13.88 ▼12.0%
8.63 9.81 ▲ 1.2% ▼18.3% ▼5.5%
6.71
4.18 4.13 3.88 4.75 3.63 3.84
2
FCT Invt. 1 Causeway Point Northpoint City Changi City Point YewTee Point Anchorpoint Bedok Point Waterway Point
Properties North Wing
1. Includes Causeway Point, Northpoint City North Wing (and Yishun 10 retail podium), Changi City Point, YewTee Point, Anchorpoint and Bedok Point
2. FCT acquired the initial shares in SST (which holds Waterway Point) on 12 July 2019. FCT ’s share of property expense in SST in FY2019 for the period 12 July – 30 September 2019
(approximately 2.5 months) was S$1.24 million
15Net property income by properties in FY2020
Impact to performance due mainly to rental rebate provided to tenants in 2H20
Net property income (S$ million)
(year-on-year change)
FY2020 FY2019
Based on FCT’s
40.0% share of results
in joint venture
Sapphire Star Trust
which holds Waterway
Point. FCT acquired
139.28 the stake in SST in 12
▼20.4% July 2019, hence
110.89 there is no year-on-
year comparison with
FY2019
▼19.5% 65.77
52.93
▼19.6%
39.21
31.53
▼25.3% ▼19.4%
17.53 ▼21.3% ▼24.1% 19.50
13.10 8.31 10.31
3.00 3.81 2.02 2.66
2
FCT Invt. 1 Causeway Point Northpoint City Changi City Point YewTee Point Anchorpoint Bedok Point Waterway Point
Properties North Wing
1. Includes Causeway Point, Northpoint City North Wing (and Yishun 10 retail podium), Changi City Point, YewTee Point, Anchorpoint and Bedok Point
2. FCT acquired the initial shares in SST (which holds Waterway Point) on 12 July 2019. FCT ’s share of NPI in SST in FY2019 for the period 12 July – 30 September 2019 (approximately 2.5 months) was S$4.48 million
16Financial position
Causeway Point, Singapore30 September 2020 30 September 2019
Gearing ratio1 35.9% 32.9%
Interest cover ratio for the financial year2 4.95 times 5.34 times
Total borrowings S$1,255 million S$1,042 million
% of borrowing on fixed rates or hedged via interest rate swaps 54.3% 50%
Average cost of borrowings (all-in) 2.4% 2.6%
S&P: BBB/Stable3 S&P: BBB+/Stable
Credit ratings Moody’s: Baa1/Stable
Moody’s: Baa2/Stable4
1. In accordance with the Property Funds Appendix, the gearing ratio included FCT’s 40% proportionate share of deposited property value and borrowing in SST
2. Calculated as earnings before interest and tax (EBIT) divided by interest expense
3. On 9 September 2020, S&P affirmed FCT's "BBB" long-term issuer rating with stable outlook and "BBB" issue ratings on the outstanding senior unsecured notes issued by FCT MTN Pte. Ltd. and guaranteed by FCT
and removed the ratings from CreditWatch where they were placed with negative implications on 13 April 2020
4. On 7 September 2020, Moody’s affirmed FCT's Baa2 Rating and changes Outlook To Stable From Negative
1830 Sep 2020 30 Sep 2019
As at
S$’000 S$’000
Investment Properties 2,749,500 2,846,000 Notes:
a. The number of units used for computation of NAV and NTA per
Investment in associates 696,406 457,470 unit as at 30 September 2020 is 1,120,330,196. This comprises:
Loans to and investment in joint venture 291,007 291,083 (i) 1,119,447,127 units in issue as at 30 September 2020;
Fixed assets 229 85 (ii) 255,647 units issuable to the Manager in November 2020, in
Total non-current assets 3,737,142 3,594,638 satisfaction of 20% of the base fee component of the Manager’s
management fees payable to the Manager for the quarter ended
Asset held for sale (Bedok Point) 108,000 - 30 September 2020; and
3,142 (iii) 627,422 units issuable after financial year ending 30
Trades and other receivables 9,686 September 2020, in satisfaction of 20%, 20%, 50% and 20% of
Cash and cash equivalents 28,583 13,103 the performance fee component of the Manager’s management
16,245 fees payable to the Manager for the quarters ended 31 December
Total current assets 146,269 2019, 31 March 2020, 30 June 2020 and 30 September 2020
respectively.
Total assets 3,883,411 3,610,883
b. The number of units used for computation of NAV and NTA per
Current liabilities (317,113) (365,000) unit as at 30 September 2019 is 1,117,509,051. This comprises:
(i) 1,116,284,043 units in issue as at 30 September 2019;
Non-current liabilities (1,028,022) (774,824) (ii) 373,973 units issued to the Manager in October 2019, in
satisfaction of 35% of the base fee component of the Manager’s
Total liabilities (1,345,135) (1,139,824) management fees payable to the Manager for the quarter ended
30 September 2019; and
Net assets 2,538,276 2,471,059 (iii) 851,035 units issued to the Manager in October 2019, in
satisfaction of 20%, 20%, 55% and 35% of the performance fee
component of the Manager’s management fees payable to the
Manager for the quarters ended 31 December 2018, 31 March
NAV and NTA per Unit S$2.27a S$2.21b 2019, 30 June 2019 and 30 September 2019 respectively.
19Debt maturity profile as at 30 September 2020 Type of borrowings Aggregate amount
Average debt maturity: 2.1 years ■ Unsecured bank borrowings S$635.0 million (50.6%)
■ Medium Term Notes S$350.0 million (27.9%)
■ Secured bank borrowings S$270.0 million (21.5%)
Total Borrowings S$1,255.0 million (100.0%)
S$391m
(31.2% of total borrowing)
S$350m
(27.9% of total borrowing)
30
S$255m
(20.3% of total borrowing) 200
120 S$189m
50 (15.1% of total borrowing)
80 * 70
S$70m
200 ** 191 (5.6% of total borrowing)
125 ** 119
70
-
FY2021 FY2022 FY2023 FY2024 FY2025
Figures indicated in the chart are in S$ million. Any discrepancy between individual amount and the aggregate is due to rounding.
* The S$80 million secured loan has been prepaid on 7 October 2020.
** Paid down using the proceeds from the equity fund raising and the balance to be refinanced by a 5-year S$150 million unsecured term loan.
20Operational performance
Waterway Point, Singapore• Portfolio occupancy maintained at 94.9%, slightly higher compared to the previous quarter.
Mall Occupancy1 30 Sep 19 31 Dec 19 31 Mar 2020 30 Jun 2020 30 Sep 2020
Causeway Point 97.0% 97.8% 97.9% 96.7% 96.6%
Northpoint City North Wing2 99.0% 99.2% 97.0% 96.2% 95.0%
Waterway Point 98.0% 97.3% 96.3% 94.4% 96.0%
Changi City Point 95.9% 95.8% 91.8% 90.8% 90.4%
Bedok Point 95.7% 95.7% 94.3% 90.6% 92.0%
YewTee Point 97.1% 98.6% 98.6% 96.0% 97.1%
Anchorpoint 79.0% 93.5% 93.1% 92.6% 92.7%
FCT Portfolio 96.5% 97.3% 96.1% 94.6% 94.9%
1. Occupancy is based on net lettable area
2. Includes Yishun 10 Retail Podium
22• Total tenant sales has recovered close to pre-COVID-19 level although there are variances across trades and tenants
• All retailers with the exception of a few such as family karaoke and travel agencies, have resumed businesses
• Mall shopper traffic has stabilised at 60% to 70% of pre-COVID-19 level. Easing of safe distancing measures with Phase
3 re-opening would likely support further recovery of shopper traffic and tenant sales
FCT Portfolio Total Tenant Sales (Y-o-Y) FCT Portfolio Shopper Traffic (Y-o-Y)
2019 2020 2019 2020
▲2.6%
▼1.0%
▼2.2% ▼0.4% ▼9.1%
▼3.0% ▼5.6%
▼4.7%
▼6.8%
▼36.4% ▼39.8%
▼31.2% ▼38.5%
▼46.7%
▼57.4% ▼51.8%
▼60.3% ▼68.3%
Jan Feb Mar Apr May Jun Jul Aug Sep Jan Feb Mar Apr May Jun Jul Aug Sep
1. FCT Portfolio includes Causeway Point, Northpoint City, Waterway Point, Changi City Point, YewTee Point, Bedok Point and Anchorpoint . The shopper traffic for Northpoint City North Wing is taken as the total traffic
for Northpoint City, which includes Northpoint City South Wing.
23Lease expiry profile as % of Total GRI
■ Expiries as at 30 September 2020
32.6% 33.6%
◆ WALE by NLA: 1.55 years
27.0%
(3Q20: 1.69 years)
◆ WALE by GRI: 1.51 years
(3Q20: 1.61 years)
6.4%
0.2% 0.2%
Lease expiry1 as at 30 FY2026
FY2021 FY2022 FY2023 FY2024 FY2025
September 2020 and Beyond
Number of leases expiring 341 286 215 22 2 1
Leased area expiring (sq ft) 433,861 505,344 333,453 82,832 2,699 21,248
Expiries as % of total leased area 31.5% 36.6% 24.2% 6.0% 0.2% 1.5%
Expiries as % of GRI 32.6% 33.6% 27.0% 6.4% 0.2% 0.2%
1. Calculations exclude vacant floor area.
24Lease Expiries1 in FY2021 Number of leases Leased area expiring as % of leased area of as % of total GRI
(As at 30 September 2020) expiring (sq ft) property of property
Causeway Point 78 98,007 24.2% 30.0%
Northpoint City North Wing2 72 73,394 33.6% 34.5%
Waterway Point 53 110,275 30.9% 29.5%
Changi City Point 62 84,341 45.5% 43.8%
Bedok Point 16 25,084 33.0% 43.4%
YewTee Point 36 22,238 31.1% 36.3%
Anchorpoint 24 20,522 31.1% 31.1%
Total 341 433,861 31.5% 32.6%
1. Calculations exclude vacant floor area.
2. Includes Yishun 10 retail podium
25Leased area Net Lettable Area Change compared
Number of As % of
(1 Oct 2019 – 30 Sep 2020) renewed (NLA) with preceding
renewals property’s NLA
(square feet) (square feet) rental rates1
Causeway Point 59 112,316 419,840 26.8% 3.8%
Northpoint City North Wing2 57 59,264 229,709 25.8% 3.6%
Waterway Point 51 77,432 371,382 20.8% 4.7%
Changi City Point 28 49,342 205,007 24.1% 4.8%
Bedok Point 12 12,066 82,713 14.6% 3.8%
YewTee Point 15 18,591 73,669 25.2% 5.6%
Anchorpoint 13 23,978 71,213 33.7% 4.1%
FCT portfolio average 235 352,989 1,453,533 24.3% 4.2%
1. Based on the variance between the average rental rates between the new lease and the preceding lease, based on same retail space. Reconfigured or
amalgamated retail space is excluded from calculation of rental reversion. Average lease tenure is 3 years.
2. Includes Yishun 10 Retail Podium
26Summary
YewTee Point, SingaporeUnderpinning the relevance and resilience of suburban retail malls
Focus on Essential Services, F&B and necessity shopping
which are relevant to shoppers
The proximity to homes makes FCT’s malls ideal fulfilment hubs for
“last-mile” delivery and / or “Click-and-collect”, as “work from home”
becomes more prevalent and with more retailers and F&B businesses
moving towards omnichannel retailing
FCT portfolio comprises mainly dominant malls which are well-located
in populous residential estates and within walking distance to public
transport nodes.
FCT’s malls are near homes and are convenient one-stop venues for
families and social meetings
28Northpoint 2 Bedok Changi City Yishun 10 Investment Waterway Point Acquisition Future
YewTee Point Point Point Retail Podium in ARF (40%-stake) of ARF Opportunities
2010 2011 2014 2016 2019 2019 2020
Acquisition • Northpoint City South
Growth 24.82% Full ownership Wing
in ARF in ARF • Opportunities from 3rd
party assets
Northpoint City Causeway Point
Anchorpoint Northpoint Causeway Point North Wing 2019
2008 2010 2012 2017 Underground Pedestrian Link
Asset
Enhancement AEI opportunities within
the enlarged FCT
Growth portfolio
Omnichannel and
Organic Growth digital retail strategies
Rental growth Active lease Maintain high Environmental, social
Grow footfall and governance (ESG)
management occupancy initiatives
29NORTHPOINT CITY
30◆ 2H19: Second Half 2019 ended 30 September 2019 ◆ NAV: Net asset value
◆ 2H20: Second Half 2020 ended 30 September 2020 ◆ NLA: Net Lettable Area
◆ AEI: Asset Enhancement Initiative ◆ NPI: Net Property Income
◆ ARF: AsiaRetail Fund Limited ◆ NTA: Net Tangible Value
◆ ARF Acquisition: The acquisition of the remaining approximately 63.11% ◆ q-o-q: quarter-on-quarter, refers to the comparison with the previous
interest in ARF, announced on 3 September 2020 quarter
◆ COVID-19: Coronavirus disease ◆ RCF: Revolving Credit Facilities – short-term unsecured borrowings
◆ DPU: Distribution per Unit ◆ REIT: Real Estate Investment Trust
◆ EMTN: Medium Term Notes under FCT’s S$3 billion Multicurrency Debt ◆ RSI: Retail Sales Index, published by the Department of Statistics
Issuance Programme ◆ S&P: Standard and Poor’s (credit rating agency)
◆ F&B: Food and Beverage ◆ Square Feet: sq ft
◆ FCT: Frasers Centrepoint Trust ◆ SST: Sapphire Star Trust, which holds Waterway Point; it is a joint
◆ FCAM: Frasers Centrepoint Asset Management Ltd., the manager of FCT venture of FCT
◆ FPL: Frasers Property Limited, the sponsor of FCT ◆ UPL: refers to the Underground Pedestrian Link between the basement
◆ GRI: Gross Rental Income of Causeway Point and Wood Square
◆ Moody’s: Moody’s Investors Service (credit rating agency) ◆ WALE: Weighted Average Lease Expiry
◆ MTN: Medium Term Notes under FCT’s S$1 billion multi-currency MTN ◆ y-o-y: year-on-year, refers to the comparison with the same period in the
program previous yearAverage cost of Borrowings (all-in) 2.4% Annualised based on rates fixed @ 30 September 2020
Moody's rating Baa2 Outlook: Stable
S&P rating BBB Outlook: Stable
Interest cover (EBIT/Σ interest) 4.95 times FY2020: 1 October 2019 to 30 September 2020
Gearing 35.9%1 as at 30 September 2020
as % of total
Description of borrowing Amount (S$ m) Maturity
borrowing
Short-term unsecured loan 325 25.9% -
S$80m secured loan2 80 6.4% 10-Mar-21
S$50m FCT MTN (10) 50 4.0% 21-Jun-21
S$120m secured loan 120 9.6% 11-Apr-22
S$30m FCT MTN (12) 30 2.4% 5-Jun-22
S$200m EMTN (1) 200 15.9% 11-May-23
S$191m unsecured loan 191 15.2% 26-Sep-23
S$119m unsecured loan 119 9.5% 18-Dec-23
S$70m secured loan 70 5.6% 21-Jun-24
S$70m FCT MTN (13) 70 5.6% 8-Nov-24
Total 1,255 100.0%
1. In accordance with the Property Funds Appendix, the gearing ratio included FCT’s 40% proportionate share of deposited property value and borrowing in SST.
2. S$80 million secured loan has been prepaid on 7 October 2020.
Any discrepancy between individual amount and the aggregate is due to rounding.
3215 September 2020 30 September 2019
Appraised Value Appraised Value Capitalisation Appraised Value Appraised Value Capitalisation
(S$ million) (S$ psf) Rate (S$ million) (S$ psf) Rate
Causeway Point 1,305.0 3,108 4.75% 1,298.0 3,090 4.75%
Northpoint City North Wing1 771.5 3,517 4.75% 771.5 3,517 4.75%
Changi City Point2 338.0 1,649 5.00% 342.0 1,668 5.00%
Anchorpoint 110.0 1,545 4.50% 113.5 1,599 4.50%
YewTee Point 190.0 2,579 5.00% 189.0 2,566 5.00%
3
Bedok Point 108.0 1,306 NA 94.0 1,136 5.00%
Yishun 10 35.0 3,384 3.75% 38.0 3,674 3.75%
Total FCT Investment property portfolio 2,857.5 2,846.0
Waterway Point4 1,300.0 3,500 4.50%
1. Excludes CSFS space of 10,505 square feet
2. Excludes CSFS space of 3,391 square feet
3. Based on the sale price of Bedok Point in the divestment of Bedok Point as announced on 3 September 2020. The sale price was arrived at after taking into account the independent valuations
conducted by Jones Lang LaSalle Property Consultants Pte Ltd (“JLL”) (commissioned by HSBC Institutional Trust Services (Singapore) Limited (in its capacity as trustee of FCT)) and Colliers
International Consultancy & Valuation (Singapore) Pte Ltd (“Colliers”) (commissioned by the Manager). JLL, in its report dated 1 August 2020, had stated that the open market value of Bedok Point
as at 1 August 2020 was S$108.9 million and Colliers, in its report dated 1 August 2020, had stated that the open market value of Bedok Point as at 1 August 2020 was S$107.2 million.
4. FCT owns 40.0% of Sapphire Star Trust which holds Waterway Point. The value reflected in this table is the total value of Waterway Point and FCT’s 40.0% interest amounts to S$520 million.
33Tenants As % of Total NLA As % of Total GRI
(FCT Portfolio as at 30 September 2020, excluding properties in ARF portfolio)
1 NTUC1 4.6% 3.6%
2 Dairy Farm Group2 3.5% 3.2%
3 Copitiam Group3 2.8% 2.7%
4 Metro (Private) Limited4 4.2% 2.6%
5 Breadtalk Group5 2.0% 2.6%
6 Courts (Singapore) Pte Limited 2.4% 2.2%
7 Koufu Group 2.2% 2.0%
8 Cotton On Group6 1.5% 1.7%
9 Hanbaobao Pte Limited7 0.9% 1.5%
10 Yum!8 1.0% 1.5%
Total for Top 10 25.1% 23.6%
1. NTUC: Include NTUC FairPrice, NTUC Healthcare (Unity) and NTUC Club
2. Includes leases for Cold Storage supermarkets, Guardian Pharmacy & 7-Eleven
3. Operator of Kopitiam food courts, includes Kopitiam, Bagus
4. Includes leases for Metro Department Store & Clinique Service Centre
5. Includes Food Republic, Breadtalk, Toast Box and Din Tai Fung
6. Includes leases for Cotton On, TYPO, Rubi Shoes, Cotton On Body, Cotton On Kids
7. Operates McDonald’s outlets
8. Operates KFC and Pizza Hut outlets
34Trade Classifications As % of total NLA As % of total GRI
(FCT Portfolio as at 30 September 2020, excluding properties in ARF portfolio)
F&B 30.6% 38.2%
Fashion 12.7% 13.0%
Beauty & Health 8.3% 12.0%
Services 4.5% 8.4%
Household 9.9% 7.8%
Supermarket 7.3% 5.3%
Leisure/Entertainment 6.4% 3.0%
Books, Music, Arts & Craft, Hobbies 3.7% 2.8%
Department Store 4.1% 2.6%
Jewellery & Watches 0.8% 2.5%
Sports Apparel & Equipment 2.8% 2.4%
Education 3.8% 2.0%
Vacant 5.1% 0.0%
Grand Total 100.0% 100.0%
35Causeway Point FY 2021 FY 2022 FY 2023 FY 2024 FY 2025 FY 2026 + Grand Total Anchorpoint FY 2021 FY 2022 FY 2023 FY 2024 FY 2025 FY 2026 + Grand Total
No. of leases 78 67 65 2 1 0 213 No. of leases 24 16 11 1 0 0 52
NLA (sq ft) expiring 98,007 170,593 130,417 5,135 1,364 0 405,516 NLA (sq ft) expiring 20,522 22,517 21,619 1,335 0 0 65,993
Expiries as % of total leased area 24.2% 42.1% 32.2% 1.3% 0.3% 0.0% 100.0% Expiries as % of total leased area 31.1% 34.1% 32.8% 2.0% 0.0% 0.0% 100.0%
Expiries as % of total GRI 30.0% 34.4% 34.6% 0.6% 0.4% 0.0% 100.0% Expiries as % of total GRI 31.1% 32.9% 34.5% 1.5% 0.0% 0.0% 100.0%
Northpoint City North Wing FY 2021 FY 2022 FY 2023 FY 2024 FY 2025 FY 2026 + Grand Total YewTee Point FY 2021 FY 2022 FY 2023 FY 2024 FY 2025 FY 2026 + Grand Total
(includes Yishun 10 retail podium)
No. of leases 72 41 48 5 0 1 167 No. of leases 36 17 17 1 0 0 71
NLA (sq ft) expiring 73,394 55,515 42,253 25,798 0 21,248 218,208 NLA (sq ft) expiring 22,238 12,635 28,128 8,547 0 0 71,548
Expiries as % of total leased area 33.6% 25.4% 19.4% 11.8% 0.0% 9.7% 100.0% Expiries as % of total leased area 31.1% 17.7% 39.3% 12.0% 0.0% 0.0% 100.0%
Expiries as % of total GRI 34.5% 25.7% 28.3% 10.3% 0.0% 1.3% 100.0% Expiries as % of total GRI 36.3% 20.0% 33.2% 10.5% 0.0% 0.0% 100.0%
Waterway Point FY 2021 FY 2022 FY 2023 FY 2024 FY 2025 FY 2026 + Grand Total Bedok Point FY 2021 FY 2022 FY 2023 FY 2024 FY 2025 FY 2026 + Grand Total
No. of leases 53 93 43 13 0 0 202 No. of leases 16 16 7 0 0 0 39
NLA (sq ft) expiring 110,275 149,386 54,482 42,502 0 0 356,645 NLA (sq ft) expiring 25,084 32,848 18,169 0 0 0 76,101
Expiries as % of total leased area 30.9% 41.9% 15.3% 11.9% 0.0% 0.0% 100.0% Expiries as % of total leased area 33.0% 43.2% 23.9% 0.0% 0.0% 0.0% 100.0%
Expiries as % of total GRI 29.5% 39.1% 19.0% 12.4% 0.0% 0.0% 100.0% Expiries as % of total GRI 43.4% 46.4% 10.3% 0.0% 0.0% 0.0% 100.0%
Changi City Point FY 2021 FY 2022 FY 2023 FY 2024 FY 2025 FY 2026 + Grand Total FCT Portfolio FY 2021 FY 2022 FY 2023 FY 2024 FY 2025 FY 2026 + Grand Total
No. of leases 62 36 24 1 0 0 123 No. of leases 341 286 215 22 2 1 867
NLA (sq ft) expiring 84,341 61,850 38,385 850 0 0 185,426 NLA (sq ft) expiring 433,861 505,344 333,453 82,832 2,699 21,248 1,379,437
Expiries as % of total leased area 45.5% 33.4% 20.7% 0.5% 0.0% 0.0% 100.0% Expiries as % of total leased area 31.5% 36.6% 24.2% 6.0% 0.2% 1.5% 100.0%
Expiries as % of total GRI 43.8% 35.1% 20.8% 0.3% 0.0% 0.0% 100.0% Expiries as % of total GRI 32.6% 33.6% 27.0% 6.4% 0.2% 0.2% 100.0%
36Northpoint City
Property name Causeway Point Waterway Point2 Changi City Point YewTee Point Anchorpoint
(North Wing)1
Property type Retail Retail Retail Retail Retail Retail
99-year leasehold 99-year leasehold 99-year leasehold 60-year leasehold 99-year leasehold
Title Freehold
(74 years remaining) (69 years remaining) (90 years remaining) (49 years remaining) (85 years remaining)
NLA (sq ft) 420,082 229,709 371,200 205,028 73,669 70,988
Asset Tampines 1 White Sands Hougang Mall Century Square Tiong Bahru Plaza Central Plaza
Property type Retail Retail Retail Retail Retail Office
99-year leasehold 99-year leasehold 99-year leasehold 99-year leasehold 99-year leasehold 99-year leasehold
Title
(69 years remaining) (72 years remaining) (73 years remaining) (71 years remaining) (70 years remaining) (70 years remaining)
NLA (sq ft) 268,577 128,631 150,593 202,446 214,708 144,250
1. Includes Yishun 10 Retail Podium
2. FCT owns 40.0% interest in Waterway Point
37The FRx aims to increase productivity and improve efficiency for retailers and F&B operators,
and provide shoppers with seamless omnichannel experience
Shopping online with Pre-order F&B and pay on
Frasers e-Store Frasers Makan Master
Consolidation of orders from multiple Multi-brand delivery orders, allowing
retailers in a Frasers mall into a single members to place orders from multiple
delivery sent to shopper’s doorstep F&B tenants within the same mall
In store pick up Delivery Delivery Takeaway Dine-in
38You can also read