PORT LANDS ACCELERATION INITIATIVE - Appendix 3 Development Model Assessment - Waterfront Toronto
←
→
Page content transcription
If your browser does not render page correctly, please read the page content below
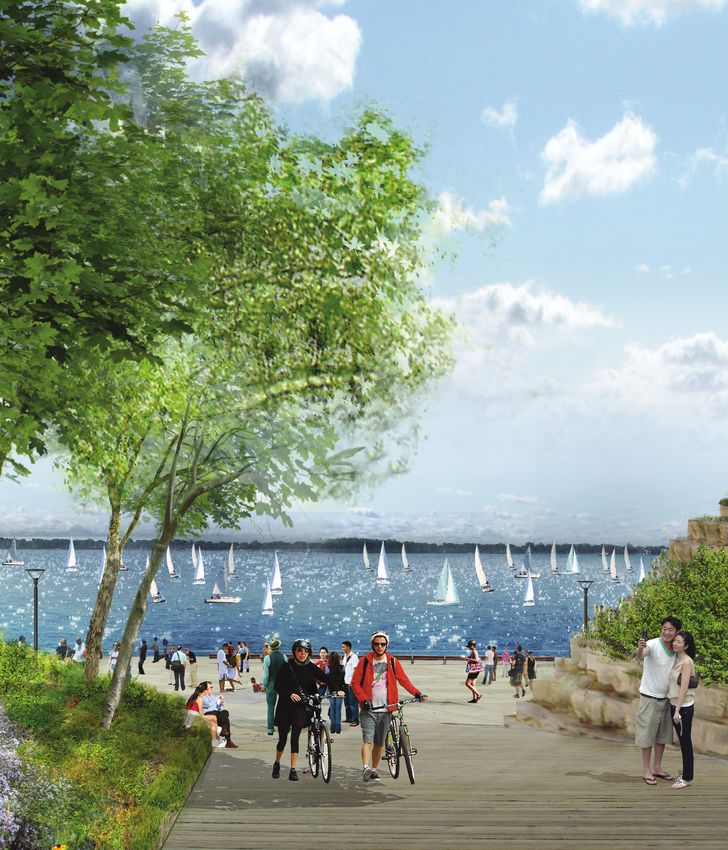
PORT LANDS
ACCELERATION INITIATIVE
Appendix 3
Development Model Assessment

  Rendering of Promontory Park by Michael Van Valkenburgh Associates courtesy of Waterfront Toronto
1.0      Introduction
The City of Toronto, Toronto and Regional Conservation Authority, and Waterfront Toronto have
been engaged in a process that has explored opportunities to accelerate the redevelopment of the
Toronto Port Lands. As part of the Port Lands Acceleration Initiative (PLAI), Cushman and Wakefield
Valuation and Advisory Division (C&W) tested the financial viability of the development concepts
emerging from the PLAI process. This work was based on extensive research including market
soundings from the development industry.

The primary output of the work carried out by C&W is a development pro-forma that incorporates
revenues from the sale of serviced land and from an area-wide development charges that would be
paid by the developers of the serviced land. The results of this work yielded negative results. N.
Barry Lyon Consultants Limited (NBLC) has been retained by the City of Toronto to provide a land
developer's perspective on potential ways in which the development model for the Port Lands could
potentially be improved to advance the pace of revitalization and reduce the net cost to the three
levels of government.

1.1      Summary of Conclusions

      1. The approach and methodology of C&W is sound and reasonable given the current state of
         planning for the area and limitations associated with the costing of infrastructure.

      2. The model, however, underestimates demand for residential development. We would also
         suggest several other adjustments to the inflation and discount rates as well as the
         residential units sizes employed in the model.

      3. In any case, the development community, especially those who are invested in the area,
         would view the C&W model as a high level of assessment of development viability. It
         identifies significant challenges related to infrastructure funding and development phasing
         and timing. It would not be viewed as an immediate deterrent to development. From their
         perspective, the issues of immediate concern are:

              a. certainty of land use; and,

              b. timing to development.

      4. The PLAI process has revealed a requirement for over $350M in infrastructure spending to
         be funded prior to any development revenues. A core issue will be how to finance this
         amount. However, before this question can be answered, several areas require study that
         would be best accomplished with the involvement of the benefiting landowners.

      5. To address the funding issues there are several required intermediary steps. The next step in
         our view is to move this work forward and begin to “flush out” the details through a Land
         Owners Group which would include the City. The terms of reference of the Land Owners
         group could include:

              a. The development of a formal working structure including methodologies for cost
                 sharing and arbitration.
City of Toronto                                                                              P a g e |1
NBLC, August 2012
b. Helping to advance the Planning Act instruments necessary to provide certainty in
land use, better estimates of development timing and make more accurate revenue
projections.
c. Develop more detailed plans for required infrastructure from the PLAI process that
will be satisfactory to the City and the TRCA.
d. With more detailed costing and better estimates of revenue and timing,
participating land owners will be in a better position to discuss front ending
contributions.
e. This more detailed work will also allow the City to explore with greater confidence
development charge revenue opportunities and approval feasibility.
f. From this, determine how much can be raised by participating land owner front
ending contributions.
g. Finally, an assessment of City revenue sources such as the sale or joint venture
opportunities on real estate could be made available.
With the advancements in the planning process accomplished through the PLAI process, it is
appropriate to engage the landowners and development community towards development
implementation. This group has significant skill sets and resources that have overcome
many challenges such as those facing the Port Lands.
City of Toronto P a g e |2
NBLC, August 20122.0 Commentary on Market Forecast for the Port Lands
The C&W analysis assumes the following in terms of market demand for various classes of real
estate. These assumptions are important as they have a bearing on the accompanying financial
model.
C&W Absorption Assumptions1
Totals
Residential Office Retail Hotel
Year (Number of (Square (Square (Number of
Units) Feet) Feet) Units)
2015 to 2016 (First 2 Years) 172 289,402 49,503 0
2017 to 2021 (Next 5 Years) 1,048 674,635 83,291 225
2022 to 2026 (Next 5 Years) 2,711 868,207 1,092,790 100
2027 to 2031 (Next 5 Years) 3,469 1,061,779 51,790 125
2032 to 3036 (Next 5 Years) 1,243 788,000 59,000 0
2037 to 2041 (Next 5 Years) 1,032 788,000 64,626 0
Total Absorption 9,675 4,470,023 1,401,000 450
Annual Basis
Residential Office Retail Hotel
Year (Number of (Square (Square (Number of
Units) Feet) Feet) Units)
2015 to 2016 (First 2 Years) 86 144,701 24,752 0
2017 to 2021 (Next 5 Years) 210 134,927 16,658 45
2022 to 2026 (Next 5 Years) 542 173,641 218,558 20
2027 to 2031 (Next 5 Years) 694 212,356 10,358 25
2032 to 3036 (Next 5 Years) 249 157,600 11,800 0
2037 to 2041 (Next 5 Years) 206 157,600 12,925 0
Average Annual Absorption 358 165,556 53,885 30
1
Ba s ed on C&W's Brea kdown us i ng Pl a nni ng Al l i a nce Devel opment Dens i ties for C&W's Revenue Projections , whi ch i s
di ffers from the Dema nd Summa ry
In terms of office and retail development we believe that these estimates are appropriate. However,
for residential development, the inputs into the financial model are conservative. While we
understand and appreciate the rationale of C&W in developing these forecasts, we offer the
following comments for consideration.
The core element of the forecast is the residential component. Given the large amount,
acknowledged market demand, and development charge revenue potential, an understanding of
the potential demand of residential development is critical and has the most bearing on any
financial model.
There is no doubt that as we move into the summer of 2012, the condominium market is finally
slowing after several record breaking years. Economic uncertainties, pricing detaching from
incomes, building performance issues and new mortgage rules all are having an impact on demand
from a range of buyer groups. However, thanks to Provincial legislation and a limited supply of low
density land, as well as changing demographics and buyer preferences, high density living in the City
City of Toronto P a g e |3
NBLC, August 2012of Toronto is likely here to stay. So while we see a near term softening, Toronto is likely to see consistent demand for some time to come. In fact, to achieve the Provincial forecast to 2030, NBLC forecasts a required average annual demand of about 14,000 to 15,000 each year within the City. While we expect some of this demand to spread out into areas such as the Eglinton corridor with the new LRT, buyers will for some time prefer the downtown and waterfront areas. The majority of the City of Toronto’s demand materializes in the downtown core and waterfront area. To date much of the demand has focused in the core and downtown west with over 2,500 and 5,000 sales respectively in the past year. In the past few years, new investments such as the East Bayfront, Distillery District, Regent Park and Pan Am Games Athlete’s Village have begun to shift demand eastward. Downtown East as a submarket is expected to compete strongly for the West’s market share by 2015 when the West Donlands development is complete. With the downtown east area already accounting for about 1,000 sales a year, even with a modest shift and softening in the market, demand of 2,000 to 3,000 units in the east end is feasible. Assuming the Port Land emerges as the planners have proposed, we expect that the waterfront properties, especially Polson and Cousin Quays will represent the most sought after properties in the City. This because, unlike existing waterfront sites, they will offer a good number of units not only with waterfront views but also, city views. This and the proximity to the massive Cherry Beach park system, highway access and transit will, in our view, drive very strong demand. Based on this, we would expect that a conservative estimate of residential demand in the order of 500 to 750 units per year would be appropriate for modeling purposes. City of Toronto P a g e |4 NBLC, August 2012
3.0       The Financial Model
C&W, as part of PLAI reporting, has employed a financial model that examines, based on
development costs and expected revenues, the viability of the plan from the perspective of a Master
Developer over a 30 year period. This is a well accepted approach to assessing, at very high level,
the development feasibility of a project. At this stage in the process of the planning and
development of the Port Lands it is the only viable tool to develop an early picture of viability and
indicator of key issues.

However, development pro forma, in general, can be very sensitive to certain variables and small
changes can have a large impact on the results, especially 1) if analyzed over a long period of time
and 2) for a large scale project such as the one anticipated for the Port Lands. While we understand
and appreciate the opinion of the authors in developing their assumptions we offer a differing view
that would support a different result.

The assumptions used within the report that we would revisit are as follows:

                                         C&W Pro Forma Assumptions
                      Inflation Rate                                             2.5%
                      Average Residential Gross Unit Size (square feet)          1,000
                      Discount Rate                                               10%
                      Average Residential Absorption Rate (units per year)         358

3.1       Inflation Rate of 2.5%

For some context, the average inflation rate in Toronto for the past four years (furthest back data)
has averaged 2.1%1. National historical data also show an average inflation rate of 2.1%2 for the
past 10 years. The inflation rate specifically for owned accommodation in Ontario for the past 5
years has been 2.48%3. However, this average includes both new and resale housing and includes
homes in cities with little investment and typically low appreciation rates.

Based on the Toronto’s Real Estate Board’s (TREB) MLS Home Price Index, created this year, the
average appreciation has been 4.07% year over year from June 2011 to June 2012 for the whole
City. The value of the Port Lands is anticipated to carry at least this much once construction begins.
 Based on market sales data from TREB, the average condominium apartment sale price was
$184,000 in June 2003. In June 2012, the average sale price of a condo unit was $342,044. This
represents an annualized return of 6.40% over a 10 year period for high rise units in the City.
Townhouse appreciation would be even greater.

A masterplanned, high investment community such as the one planned for the Port Lands has a high
potential for above average value appreciation over the course of all its phases. New (at the time)
successful master communities at a much smaller scale across the City, such as CityPlace and the
Bayview and Sheppard area, have observed substantial value increases over a relatively short time
frame. For instance, a one bedroom condominium apartment unit in CityPlace’s Parade sold for

1
 Statistics Canada.
2
 Statistics Canada.
3
 Statistics Canada.
City of Toronto                                                                              P a g e |5
NBLC, August 2012
approximately $220,000 in 2007 and the same unit would sell for about $300,000 in 2012, an
increase of 35% in five years or an annualized return of 6.0%. Also, a two bedroom unit in NY
Towers in North York sold for about $420,000 in 2012 compared to about $210,000 in 2000,
representing an annualized increase of 5.94%.
In addition, the phasing of each development parcel in the Port Lands will allow each subsequent
phase of development to piggyback off the value created from the previous phase. As the
community is beautified and services offered flow into the community from the increased
population, home values and land values in the Port Lands will increase.
This means a non-uniform inflation rate on the appreciation of land values in the Port Lands. During
the pre-development stage, land values may increase at a normal inflation rate like 2.5%. However,
once much of the infrastructure has been put in, construction begins, and presales start, land values
should begin to appreciate at a faster rate than average. Below shows a staggered schedule of the
rate of appreciation of land in the Port Lands from 2012 to 2041, based on the C&W’s absorption of
residential units projected for each year.
Appreciation rates are estimated to be highest at the peak of sales and should remain higher than
average while the Port Lands community as a whole is still undergoing improvements. If the master
planned community becomes what it is envisioned to be, appreciation rates could be even higher
than our assumptions and remain high after the entire project is completed.
NBLC Inflation Rate Assumptions - Residential
Residential
C&W
Residential
Absorption
Year Inflation Rate
Rates
(Per Year)
(Number of
Units)
2012 to 2014 (Pre-Development) 2.5% -
2015 to 2016 (First 2 Years) 3.0% 86
2017 to 2021 (Next 5 Years) 5.0% 349
2022 to 2026 (Next 5 Years) 8.0% 678
2027 to 2031 (Next 5 Years) 8.0% 867
2032 to 3036 (Next 5 Years) 7.0% 310
2037 to 2041 (Next 5 Years) 6.0% 263
The appreciation of value for commercial property is expected to follow a similar pattern with slow
initial growth and an acceleration of growth as overall development at the Port Lands proceeds.
The difference between residential and commercial inflation rates is that there must be a critical
population present to support commercial development. This population comes from the future
residents of the Port Lands. Therefore, the lands are expected to have a higher initial residential
value increase and a slower initial commercial value increase reflecting commercial development
occurring after residential development.
City of Toronto P a g e |6
NBLC, August 2012NBLC Inflation Rate Assumptions - Office & Retail
Office & Retail
Year Inflation Rate
(Per Year)
2012 to 2014 (Pre-Development) 2.5%
2015 to 2016 (First 2 Years) 3.0%
2017 to 2021 (Next 5 Years) 4.0%
2022 to 2024 (Next 3 Years) 6.0%
2025 to 2031 (Next 7 Years) 7.0%
2032 to 3036 (Next 5 Years) 6.0%
2037 to 2041 (Next 5 Years) 5.0%
Following these schedules, the value increase to the City is estimated to be $14.0 which improves
the resulting net present value from ($189.2 million) to ($175.2 million).
3.2 Discount Rate of 10%
The discount rate which determines the net present value of the project is naturally a very
important variable to consider. Particularly because the Port Lands project is large scale and long
term in nature, the project can actually show a large positive future value, but a negative present
value, especially with large expenditures at the start of the project.
In order to consider an appropriate discount rate for the project, let us consider how
funds/revenues used for project costs (ie. proceeds from land sale and DC charges) would
alternatively be invested.
First, because these funds belong to the City, it must be invested under the constraints of the City’s
investment policy on asset class restrictions in terms of type and maximum value, and quality
restrictions, which reflects the City’s more conservative risk profile. We do not know what this mix
is, but it is not 100% in stocks and risky investments. The lower risk taken necessarily impacts the
corresponding expected return on the investment, used as the discount rate.
Over the past 10 years, the S&P/TSX Composite Index has had an annualized return of 5.40%4. This
is very different from looking at the shorter five-year boom period of 2003 to 2008 in which returns
on the TSX composite averaged 9.1%5 annually.
This suggests we can lower the discount rate assumption to 8.0% to reflect lower average
investment returns expected over a regular economic cycle. If the funding gap is negative, lowering
the discount rate will obviously create a larger present value gap. Conversely, if the project has extra
funding (positive gap), the project’s present value will be higher.
4
Calculated based on TSX Composite Index level in June 12, 2002 at 6,820.0 to June 12, 2012 at 11,554.64.
5
Calculated based on TSX Composite Index on March 14,2003 at 6,304.0 to June 18, 2008 at 15,073.13. This period was selected because
it represented a constant rise in index value on an almost daily basis.
City of Toronto P a g e |7
NBLC, August 20123.3 Market Assumptions and Absorption Rates
The C&W absorption assumptions on page 3 of this report are used in the revenue projections.
These have some impact on the funding gap, but not as substantial as the foregoing variables. If we
adjust the absorption for residential units alone, assuming an average of about 500 residential units
per year instead of 358 (see market commentary in this memo), then the gap would decrease by
$10.1 million, assuming a shorter development timeline.
3.4 Unit Sizing of 1,000 Square Feet Gross
The average size of a new condominium apartment unit in the City is 848 square feet, which
translates to a gross size of 1,000 square feet, based an 85% efficiency factor. This average includes
larger condominium units more common to suburban locations in Scarborough and Etobicoke. The
average net unit size in the downtown Toronto is smaller. We have estimated a net unit size of 800
square feet or 941 square feet on a gross basis.
Reducing the assumption for unit size means that there will be more residential units. Based on a
unit size of 941 square feet, this adds approximately 594 more units to the E1, E2 and F Precincts.
This has an effect on revenues in two ways: 1) development charges, which are collected on a per
unit basis and, 2) land values, as smaller units have higher values on a per square foot basis.
3.5 Combined Impact
Combining these assumptions (see table below) results in an improvement of approximately $20
million in net cash flow to the City. These profit figures should be viewed as results of a sensitivity
analysis based a reasonable set of assumptions. Assumptions are subject to market performance
based on the Canadian and world economies as a whole.
NBLC Pro Forma Assumptions - Residential
Residential
Year Inflation Rate
(Per Year)
2012 to 2014 (Pre-Development) 2.5%
2015 to 2016 (First 2 Years) 3.0%
2017 to 2021 (Next 5 Years) 5.0%
2022 to 2026 (Next 5 Years) 8.0%
2027 to 2031 (Next 5 Years) 8.0%
2032 to 3036 (Next 5 Years) 7.0%
2037 to 2041 (Next 5 Years) 6.0%
Average Residential Gross Unit Size (square feet) 941
Discount Rate 10%
Average Residential Absorption Rate (units per year) 500
City of Toronto P a g e |8
NBLC, August 2012NBLC Inflation Rate Assumptions - Office & Retail
Office & Retail
Year Inflation Rate
(Per Year)
2012 to 2014 (Pre-Development) 2.5%
2015 to 2016 (First 2 Years) 3.0%
2017 to 2021 (Next 5 Years) 4.0%
2022 to 2024 (Next 3 Years) 6.0%
2025 to 2031 (Next 7 Years) 7.0%
2032 to 3036 (Next 5 Years) 6.0%
2037 to 2041 (Next 5 Years) 5.0%
Projected Net Cashflows to the City of Toronto ($Millions)
Assumptions C&W Assumptions NBLC Assumptions
Total Future Net Cashflow ($540.4) ($506.2)
Total Present Value ($189.2) ($169.0)
The core, unresolved issue, is the significant infrastructure costs that are required in the early years
of the development program before development revenues can be realized. It is this large amount
of investment that both the C&W and NBLC would likely agree inhibit a more positive outlook at this
initial stage. However, as stated at the outset, this is a very early indicator of the project and more
detailed analysis is now required to determine the best approach to funding and development
implementation.
City of Toronto P a g e |9
NBLC, August 20124.0 The Development Model
The PLAI process has helped refine the vision of the Port Lands and identified a broad list of
infrastructure projects. It is appropriate now to consider the involvement of land owners and
associated development interests to explore with the City, Waterfront Toronto and the TRCA, the
initial phases of development at greater detail.
4.1 Issues to be Considered
The PLAI has clearly advanced the discussion of accelerating development in the Port Lands. It has
identified several key issues included the early requirement for significant funding. However, to
move the project further a development model that forms a basis by which the necessary up front
planning and infrastructure work can be funded and implemented is required. In considering this
model the following issues must be addressed.
1. Land ownership in the Port Lands is highly fragmented. Each owner is likely to have a variety
of interests and real estate objectives as well as skill sets. For some with operating
businesses, there may be no interest in redevelopment. Others are highly sophisticated real
estate developers who are actively engaged in the future of the Port Lands. A process must
be devised that recognizes the variety of skill sets and interests within the area. It must
recognize and provide for a vehicle for owners not interested in funding at this time. It must
also establish a process to adjudicate differences.
2. While the PLAI has advanced the vision on the Port Lands, translating the vision into
Planning Act instruments is still required. Typically this is the process that offers
developers/land owners certainty in terms of timing and revenue. Currently, developers in
the Port Lands do not have enough confidence to understand what is likely to be approved
and the timing of the approvals to make accurate revenue projects. These revenue
projections are necessary to assess what contributions could be made toward area wide
infrastructure requirements.
3. In terms of revenues, the City owned lands will appreciate in value rapidly as the planning
instruments become confirmed and the market continues its eastern movement. In the
Etobicoke Motel Strip land values increased from about $22 psf in 2003 to over $50 psf in
2011. Deferring land sales or joint venturing sites that reward the City for deferred land
payments is worthy of serious consideration as part of any model.
4. The development model should focus only on the areas that have the greatest development
potential. Within the initial phase the model has to assume that some areas, such as
expansion to Filmport, could proceed immediately while other parcels and land uses will
take longer.
5. On the costs side, the supporting costing memorandum acknowledges that the estimates
are necessarily at a high level and include significant contingencies.
“The cost estimates in this report are generally based on limited site investigation data and
very preliminary design information or extrapolation of designs from on-going waterfront
City of Toronto P a g e | 10
NBLC, August 2012development. …. The area is too big and the roll-out of development still too ill-defined to
allow revitalization of the Port Lands to fit the traditional definition of a project.”
Work is therefore required to take the PLAI projects and costing estimates to the next stage
that will allow more accurate cost estimates and consideration of the impacts of timing and
approvals.
4.2 Land Owner Groups
There are numerous examples in the GTA that faced the same set of dynamics as those facing the
Port Lands. Typically found suburban greenfield areas where there are large numbers of owners,
and extensive infrastructure requirements including land dedications for schools and open spaces
these new communities are realized through the co-operative efforts of a Land Owners Group. Land
owner groups are established with an understanding that each owner shares a common interest in
resolving issues that extend beyond their lands.
Land Owner Groups are established for a variety of reasons but are commonly used where external
infrastructure costs will be shared by a large number of benefiting owners and frequently where the
municipality is unable or unwilling to fund these costs, in whole or in part. The land owner group
frequently self finances/front ends a portion or all of the infrastructure costs to service land, which
is typically administered by a third party legal practice. Land owners are not obligated to join the
cost sharing agreement. However, the cost sharing agreement typically allows the required funding
to be extracted from the non-contributing owners, through a local area development charge, prior
to redevelopment in the future which is then returned to contributing parties.
4.3 Port Lands Owner Group
In the case of the Port Lands, as indicated earlier, there are likely a number of parties with a variety
of interests in the area, not all of whom will be fully aligned. There are also many issues to be
addressed. It may be appropriate therefore, at the outset for the City, to explore the idea of
initiating meetings on an informal basis with a view to identifying participating parties and to
structuring terms of reference that will form the basis of the formal group.
The terms of reference of this group could include items such as:
1. Helping to advance the Planning Act instruments necessary to provide certainty in land use,
better estimates of development timing and make more accurate revenue projections.
2. Develop more detailed plans for required infrastructure from the PLAI process that will be
satisfactory to the City and the TRCA.
3. The development of a formal working structure including methodologies for cost sharing
and arbitration.
With more detailed costing and better estimates of revenue and timing, participating land owners
will be in a better position to discuss front ending contributions. This more detailed work will also
allow the City to explore with greater confidence development charge revenue opportunities and
approval feasibility.
City of Toronto P a g e | 11
NBLC, August 2012As with the developers, a better assessment of development potential and timing will allow the City to explore the role of revenue sources such as the sale or joint venture real estate opportunities in any funding solution. We recognized that even after all this, there still may be a funding issue. However, the work should be able to clearly define the unfunded component of the Port Lands which sets the basis for a senior level funding request. We also recognize that in the current environment a successful request of this nature is dubious at best. However, in the event the political environment evolves favourably, the basis and rationale for the request will be available. City of Toronto P a g e | 12 NBLC, August 2012
You can also read