THE ARAB POPULATION IN ISRAEL - State of Israel Prime Minister's Office

Page created by William Sherman
 
CONTINUE READING
THE ARAB POPULATION IN ISRAEL - State of Israel Prime Minister's Office
arab&ju8 4/11/02 11:52 Page 1

                                                                     Statistilite No. 27
         State of Israel
         Prime Minister’s Office
                      Central Bureau of Statistics
                      Center for Statistical Information

             THE ARAB POPULATION
                   IN ISRAEL

                                                           November 2002
THE ARAB POPULATION IN ISRAEL - State of Israel Prime Minister's Office
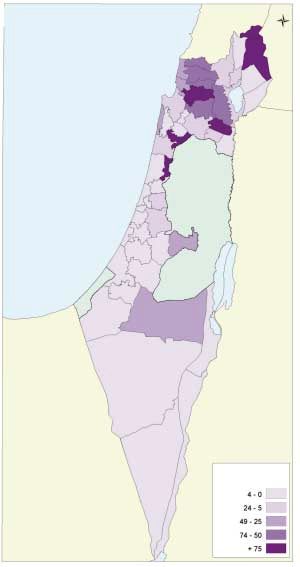
arab&ju8 4/11/02 11:52 Page 2

         Shalom,                                         A. Population growth                        comprise 85% of the Arab population,
                                                                                                     Christians will comprise 7% and Druze
         The Central Bureau of Statistics (CBS)     1. At the end of 2001, the Arab                  - 8%.
         is pleased to present another pamphlet     population of Israel numbered 1.2
         in the Statistilite series, this time on   million people (graph A-1) - 8 times             3. In recent years, the rate of growth
         the Arabs in Israel, who now comprise      its size in 1948 (156,000 people);               of the Moslem population is almost
         almost one-fifth of the country’s          according to the forecast of the CBS,            double that of the Christian population
         population.                                it is expected to number some 2                  (graph A-3).
                                                    million.
         The pamphlet contains information
         on various subjects: population growth,    A-1. Arab population, 000s, 1948-2000
         geographical distribution, marriage,
         fertility, health, education,
         employment, agriculture and standard         000s
         of living. These data and many others       ±¨≤∞∞
         are presented in CBS publications,
         but this is the first time they are         ±¨∞∞∞
         compiled in one publication.

         Information on the Arab population           ∏∞∞
         arouses great interest among
         researchers, policy makers at both the       ∂∞∞
         national and local levels, organizations
         and individuals. The pamphlet is             ¥∞∞
         designed to provide basic information
         on the subject, and anyone wishing           ≤∞∞
         to delve deeper is welcome to peruse
         CBS publications, to contact the                ∞
         Information Unit and its library and              ¥∏ πµ∞     µµ     ∂∞     ∂µ         ∑∞     ∑µ     ∏∞     ∏µ     π∞     πµ     ∞∞
                                                         ±π         ±π     ±π     ±π      ±π        ±π     ±π     ±π     ±π     ±π     ≤∞
         to surf the CBS Internet website.                   ±

                                                    2. Of the total Arab population 82%              4. The Arab population currently
                                                    are Moslems, 9% are Christians and               comprises 19% of the population of
                                                    9% are Druze (graph A-2). The                    Israel, similar to its proportion in 1948.
                                                    proportion of Moslems increased over             In the 1950s, following the mass
                                                    the years (from 70% at the end of the            immigration of Jews, the proportion
                                                    1950s), the proportion of Christians             of the Arab population decreased to
                                                    decreased (from 21%) and the                     11%. Its higher rate of natural increase
                                                    proportion of Druze remained almost              as well as the waning of Jewish
                                                    unchanged. According to the CBS                  immigration and the addition of the
             Written by:                            forecast, in 2020 Moslems will                   70,000 Arab residents of east
             Nurit Yaffe and Dorith Tal                                                              Jerusalem in 1967 and the 12,000
             Map: GIS unit                                                                           Druze residents of the Golan Heights
             Photo: Avinoam Yaffe                   A-2. Arab population, by religion, %,            in 1982, caused an increase in the
                                                    2000                                             proportion of the Arab population to
             Design:     Navon art                                                                   18% at the end of the 1980s. In the
                                                        Moslems      Christians        Druze         course of the 1990s, due to the extent
             e-mail: info@cbs.gov.il                                                                 of immigration from the CIS, the
             Internet: www.cbs.gov.il†                                                               proportion of the Arab population
                                                                                                     stabilized. According to the CBS
                                                                                                     forecast, in 2020 it is expected to be
             Jerusalem   Tel. 972-2-6592666                                                          between 21% and 24%.
                         Fax. 972-2-6521340
             Tel Aviv    Tel. 972-3-5681933                                                          5. The rate of growth of the Arab
                         Fax. 972-3-5681933                                                          population of Israel - 3.4% on average
                                                                                                     per year - is one of the highest in the
             Haifa       Tel.972-4-8602605
                         Fax. 972-4-8645311                                                          world, and is even higher than in
                                                                                                     neighboring Arab countries (for
             Beer Sheva Tel.972-8-6239663                                                            example, 2.8% in Syria and in Jordan
                        Fax 972-8-6232064                                                            and 2.1% in Egypt). In the Palestinian
                                                                                                     Authority, the rate of growth is even
                                                                                                     higher - 4.3% per year.

         ≤
arab&ju8 4/11/02 11:52 Page 3

         A-3. Annual growth rate of the Arab                                        B. Localities of dwelling                            13. The Moslems and the Druze reside
         population, by religion, %, average                                                                                             primarily in localities in which they
         1996-2000                                                              9. Of all Arab residents 71% live in                     comprise the majority. In the past,
                                                                                116 Arab localities (in which they                       half the Christians lived in localities in
                           3.6                                                  comprise almost the entire population).                  which they comprised the majority,
            3.4                                                                 Another 24% live in eight localities                     but due to their lower growth rate,
                                                                                defined by the CBS as “mixed”:                           they lost their majority in some of the
                                                                   2.4          localities in which the decisive majority                localities. Thus, in Nazareth - the
                                           1.9                                  of the population is Jewish, but which                   largest Arab city - the proportion of
                                                                                have a significant minority of Arab                      Christians decreased from 52% in
                                                                                residents. The “mixed” localities are:                   1961 to 34% today.
                                                                                Jerusalem, Tel Aviv-Yaffo, Haifa, Lod,
                                                                                Ma’alot-Tarshiha, Nazerat Illit, Akko                    14. Among the “mixed” localities,
           Arabs        Moslems Christians                     Druze            and Ramla. 1% live in other Jewish                       Jerusalem is conspicuous for its large
           Total                                                                localities that are not defined as                       number of Arab residents - 209,000
                                                                                “mixed”, and 4%, mostly Bedouins in                      at the end of 2000. The number of
                                                                                the south of the state, live in places                   Arab residents in all the other “mixed”
        6. Of the total growth, 97% stems from                                  that are not defined by the Ministry of                  localities together totals 80,000. In
        natural increase (excess of births over                                 the Interior as localities.                              Jerusalem, too, the proportion of Arab
        deaths) and 3% from immigration                                                                                                  residents out of the overall population
        balance, primarily unification of families.                                                                                      of the city is large - 32% - compared
                                                                                10. Out of all 116 Arab localities, 9
                                                                                are cities (graph B-1), 74 are local                     with the other “mixed” localities: in
        7. As a result of a high level of fertility,                                                                                     Akko, Ramla, Lod and Ma’alot-
        the Arab population is very young                                       authorities and 33 are rural villages
                                                                                belonging to regional councils.                          Tarshiha the Arabs are one fifth of
        (graph A-4): youngsters aged 0-19                                                                                                the population; in Haifa, Tel Aviv-
        comprise 51% of this population, and                                                                                             Yaffo and Upper Nazerath they are
        only 3% are 65 and older. For the sake                                  11. In the 1970s, twenty permanent                       less than one tenth.
        of comparison, in the Jewish                                            localities were built for the Bedouin
        population, the corresponding                                           population in the north of the country,
        percentages are 34% (youngsters aged                                    and in the 1980s, seven localities were
        0-19) and 11% (aged 65 and older).                                      built for the Bedouin population in the
        The Moslem and Druze groups, whose                                      south. Following the addition of these
        fertility is higher than that of the                                    localities on the one hand, and the                            B-1. Population in “mixed” localities,
        Christian group, are, therefore, younger                                unification of several Arab localities                         000s, 1990, 2000
        groups. The percentage of those aged                                    on the other, the current number of                                 60
        0-19 among the Christians is 38%,                                       localities is similar to the number which                      54                                                                     ±ππ∞
        among the Druze - 46% and among                                         existed at the time of the establishment                                                                                              ≤∞∞∞
        the Moslems - 53%.                                                      of the state.
                                                                                                                                                                   36
        8. Since the beginning of the 1970s,                                                                                                                                  31
                                                                                                                                                                                        29        29
        the proportion of children in the Arab                                  12. Most of the Arab localities are                                           25
                                                                                                                                                                                   21        21
                                                                                                                                                                                                            23        22
                                                                                                                                                                         20
        population has decreased and the                                        homogeneous in their religious                                                                                         16        16        14
                                                                                                                                                                                                                                19
                                                                                                                                                                                                                                     14
                                                                                                                                                                                                                                          18

        proportion of working age people has                                    composition. Out of 116 localities, in
        increased. The proportion of people                                     81 localities over 90% of the residents
        aged 65 and older has remained                                          are Moslems, in 13 towns over 90%                                   th             hm          t    e    m   a in              a re
                                                                                are Druze, and in two localities almost                       are          -Fa               ha ayib ar’a amr khn Baq ye Ti
        unchanged. The median age rose                                                                                                    z              Al             Ra       T ef      T Sa              i y
                                                                                all are Christians.                                    Na            m                            Sh                  ha
                                                                                                                                                                                                         r b
        during this period from 15.1 to 19.6.                                                                                                  Um                                                  -G
                                                                                                                                                                                                Al
         A-4. Arab and Jewish population, by age, %, 2000
                                                          Arabs
                                                       Ìȯ·‚                       Jews
                                                                              ∏µ´                                                        15. While there are almost no Druze
                                                                             ∏∞≠∏¥                                                       residents in the “mixed” localities, one
                                                                             ∑µ≠∑π                                                       third of the Christians and one quarter
                                                                             ∑∞≠∑¥
                                                                             ∂µ≠∂π                                                       of the Moslems live in these localities,
                                                                             ∂∞≠∂¥                                                       the Christians primarily in Haifa and
                                                                             µµ≠µπ
                                                                             µ∞≠µ¥                                                       Jerusalem and the Moslems primarily
                                                                             ¥µ≠¥π                                                       in Jerusalem.
                                                                             ¥∞≠¥¥
                                                                             ≥µ≠≥π
                                                                             ≥∞≠≥¥                                                       16. Within the “mixed” localities, the
                                                                             ≤µ≠≤π                                                       Arab residents are concentrated in
                                                                             ≤∞≠≤¥
                                                                             ±µ≠±π                                                       neighborhoods in which they comprise
                                                                             ±∞≠±¥                                                       the majority of the population. Thus,
                                                                              µ≠π                                                        for example, Arab residents comprise
                                                                              ∞≠¥ 0 1 2 3
                  16 15 14 13 12 11 10 9   8   7   6   5   4   3   2   1   0                4   5 6   7   8   9 10 11 12 13 14 15 16
                                                                                                                                         over 95% of the old city of Akko and
                                           •                                Age                           •                              about 70% of the lower city in Haifa.

                                                                                                                                                                                                                                     ≥
arab&ju8 4/11/02 11:52 Page 4

         Arab population in natural regions (% of total population in region), 2000                   C. Geographical distribution
                                                                                                    17. Almost half (46%) of the Arabs in
                                                                                                    Israel live in the Northern district,
                                                                                                    primarily in its western area - the Akko
                                                           Lebanon                                  and Yizre’el sub-districts. In the other
                                                                                                    districts there reside between 18%
                                                                                                    (in the Jerusalem district) and 1% (in
                                                                                            Syria   the Tel Aviv district) of all Israeli Arabs.
                                                                                                    The population distribution by district
                                                                                                    is shown in graph C-1.
                                                                               Lake of
                                                                               Galilee
                                                                                                    C-1. Arab population, by district, %,
                                                                                                    1948, 2000
                                   Sea

                                                                                                                    ±π¥∏
                              nean

                                                                                                                      2
                         terra

                                                                                                               8
                     Medi

                                                                                                      10
                                                        Judea and
                                                        Samariaa

                                                                                                       18
                                                                                                              2                  58

                                                                                                                    ≤∞∞∞
                                                                                                             10       1
                                                                    Dead Sea

                                                                                                      10
                         Gaza
                         area
                                                                                                     15
                                                                                                                                      46

                                                                                                               18
                                                                                                            Northern District         Central District
                                                                                   Jordan                   Jerusalem District        Southern District
                                                                                                            Haifa District            Tel Aviv District

                                                                                                    18. Compared with a large proportion
                                                                                                    of the Jewish residents (48%) who live
                                                                                                    in the center of the country - in the
                                                                                                    Tel Aviv and Central districts - the
                                                                                                    small proportion of the Arab
                 Egypt                                                                              population in this area (11%) is
                                                                                                    noteworthy.
                                                                       % Arab population
                                                                                                    19. At the time of the establishment
                                                                                                    of the state, only 2% of all the Arabs
                                                                                                    in Israel lived in the Jerusalem district.
                                                                                                    Following the incorporation of East
                                                                                                    Jerusalem into Israel in 1967, the
                                                                                                    proportion of the Arab population in
                                                                                                    this district increased, making it the
                                                                                                    second largest district in terms of Arab
                                         Gulf of Elat                                               population (previously it was the Haifa
                                                                                                    district) and today it totals 18%. At

         ¥
arab&ju8 4/11/02 11:52 Page 5

        the same time, there was a decrease                                           4 shows the proportion of Arabs in             D-1. Median age at first marriage of
        in the percentage of Arabs in the                                             each natural region. In 24 natural             Arab grooms and brides, by religion,
        Northern district (from 58% to 46%)                                           regions, the Arab residents constitute         1970, 1999
        and in the Haifa district (from 18% to                                        less than 5% of all residents. In five
        15%).                                                                         natural regions in northern and central
                                                                                      Israel, they constitute over 75% of
        20. The proportional distribution of                                          the residents.                                                 Grooms
        the Arab population among the districts
        remained unchanged in the period                                              23. There are differences in the                               27.3 27.6
        1948-1967. The annexation by Israel                                           geographic distribution of the three             24.1
                                                                                                                                              25.0                         25.2

        of East Jerusalem in 1967 caused an                                           religious groups. Almost all the Druze                                        22.5

        increase in the proportion of Arabs in                                        live in the Northern district (80%) and
        the Jerusalem district. Since 1967 the                                        in the Haifa district (19%). The extent
        proportional distribution of the Arab                                         of the concentration of Christians in
        population among the districts has,                                           these districts (70% and 13%
        again, remained almost unchanged.                                             respectively) is smaller as some of
        The stability is due to the similar rate                                      them also live in the Jerusalem district
        of natural increase in the various                                            (11%), in the Central district (3%) and
        districts (with the exception of the                                          in the Tel Aviv district (3%). Moslems
        Southern district in which the rate of                                        are more widely distributed among                Moslems       Christians      Druze
        natural increase is much higher), and                                         the various districts: 40% live in the
        the very low rate of internal migration                                       Northern district, 21% in the                                                  ±π∑∞
        between them.                                                                 Jerusalem district, 15% in the Haifa                                           ±πππ
                                                                                      district, 12% in the Central district,
        21. Because of changes that occurred                                          11% in the Southern district and 1%                             Brides
        over the years in the distribution of                                         in the Tel Aviv district.
        the Jewish population among the                                                                                                               21.5
                                                                                                                                                             22.7

        districts (due to the non-uniform                                                          D. Marriage                         19.3
                                                                                                                                              20.3
                                                                                                                                                                    18.9
                                                                                                                                                                           20.2

        settlement of immigrants and the large
        amount of internal migration), and also                                       24. At a time when almost all Moslem
        because of the different rates of growth                                      and Druze men marry at least once
        of the Arab and the Jewish                                                    during their lifetime, there has been a
        populations, their relative weight in                                         marked increase in the phenomenon
        the various regions also changed. The                                         of Moslem and Druze women who
        sharpest change occurred in the                                               remain single. Thus, in 1988, the
        Southern district in which in 1948 the                                        proportion of Moslem and Druze
        Arab population comprised 72% of                                              women aged 40-44 who never married
        the total population and today it                                             (10%) was more than double the                   Moslems        Christians      Druze
        comprises only 13% (graph C-2).                                               proportion in 1970 (4%). For the sake
                                                                                      of comparison, only 3% of Moslem               27. In the past three decades, the
        C-2. Arab population, by district (%                                          and Druze men of the same age were             marriage age in the Arab population
        of total population), 1948, 2000                                              single. Among the Christians, men              (except among Druze men) rose one
                                                                                      and women, the extent of those                 year, on the average, a moderate rise
                                                             ±π¥∏                     remaining single was always greater            compared with the trend in the Jewish
                                                             ≤∞∞∞                     than among the Moslems and Druze,              population, in which the marriage age
                                                                                      due, in part, to the existence of clerics,     during this period rose by over 2.5
                                                                         72           who do not marry, among them.                  years.
                              63
                                                                                      25. One of the factors in the increased        28. The average difference in age
                                   51
                                                                                      rate of women who remain single is             between Arab brides and grooms is
                                                                                      the shortage of potential bridegrooms,         close to five years - double the age
                         28                                                           which is related to the rapid increase         difference between Jewish brides and
         18 19                           16
                                              21
                                                    13                        13
                                                                                      in the population (the bridegrooms are         grooms. The custom of the bride-
                     3
                                                         8                            born several years before the brides,          price, whereby the groom must
                                                                1 1
         Total Jerusalem D. Northern D. Haifa D. Central D. Tel Aviv D. Southern D.
                                                                                      in years in which the birth cohorts are        accumulate property before marriage,
                                                                                      smaller). The “competition” from               may be a factor in this.
        22. The districts are divided into sub-                                       Palestinian brides may augment the
        districts which are further divided into                                      phenomenon.
                                                                                                                                     29. More educated people marry at
        51 natural regions. The map on page                                           26. The median age at first marriage           a later age than those who are less or
        4 shows the proportion of Arabs in                                            in the Moslem and Druze populations            uneducated. Thus, for example, only
        each natural region. In 24 natural                                            is currently a little higher than 20           15% of the Moslem women who have
        regions, the Arab residents constitute                                        among women and 25 among men                   over twelve years of education married
        less than 5% of all residents. In five                                        (graph D-1). The marriage age among            younger than age 20, compared with
        districts which are further divided into                                      the Christians is about two years older than   54% of those who have no education
        51 natural regions. The map on page                                           that of the Moslems and of the Druze.          at all.

                                                                                                                                                                                  µ
arab&ju8 4/11/02 11:52 Page 6

                                                                           which is now lower than the level
                                    E. Fertility                           required for replacement (which is two                                   F. Health
                                                                           births per woman).
         30. The most dramatic of the changes                                                                                     36. Since the establishment of the
         that have occurred in the patterns of                             32. Among Christian women, the                         state (1948), life expectancy in the
         family formation in the Arab society,                             decline in fertility began in an earlier               Arab population has increased 27
         was the change in fertility. From the                             period: at the beginning of the 1970s                  years and reached 74.6 years for men
         beginning of the 1970s to the middle                              it was already lower than 4 births per                 and 77.9 years for women in 2000.
         of the 1980s, the fertility of Arab                               woman and in the mid-1980's it                         At the end of the 1940s, life
         women decreased sharply (graph E-                                 reached 2.6 births per woman. Since                    expectancy for Arabs was fifteen years
         1). Before the 1970s, Moslem women                                then, there has been almost no change,                 lower than that for Jews; by the
                                                                                                                                  1970s, the gap had decreased to 2-
         E-1. Average number of births per Arab woman, by religion, 1955-1999                                                     3 years; since then it has remained
                                                                                                                                  almost unchanged.
                                   10                                                                           Moslem
                                                                                                                Druze             37. Life expectancy of the Arab
                                   9
                                                                                                                Christian         population in Israel is higher than in
                                   8
                                                                                                                                  the neighboring Arab countries (graph
                Births per woman

                                   7                                                                                              F-1); the difference with some
                                   6                                                                                              countries amounts to ten years.
                                   5
                                   4
                                   3
                                   2
                                                                                                                                  F-1. Life expectancy, 1999-2000
                                   1
                                   0
                                        1955-59   1960-64   1965-69   1970-74   1975-79   1980-84   1985-89   1990-94   1995-99
                                                                                                                                                         Men
                                                                                                                                    74.6   71.3   70.3    69.8   68.9   68.6    65.3

         gave birth to more than nine children,                            and fertility is similar to that of Jewish
         on the average, and Druze women to                                women.
         more than seven, this occurring after
         a rise in fertility caused mainly by                              33. The differences in fertility among
         improvements in medical care and in                               the groups affect family size: the
         living conditions. This rate of fertility                         average number of persons in a
         approaches what is termed “natural                                Moslem family is 5.7, in a Druze family                Arabs Lebanon Saudi Syria Jordan Libya       Egypt
                                                                                                                                    in         Arabia
         fertility” i.e., a pattern of fertility in a                      - 5.0, and in a Christian family - 3.9.                Israel
         population that does not use                                      On average, an Arab family totals 5.4
         contraceptives or abortions. Since                                persons, almost two persons more
         then, within fifteen years, the average                           than a Jewish family.                                                         Women
         number of births by Moslem and                                                                                             77.9
         Druze women has declined by about                                 34. The decline of fertility that occurred                      74.4   72.7    72.1   71.5   72.5   68.5

         half (to 4.7 births per Moslem woman                              in various countries in the modern era
         and 4.2 per Druze woman). This rate                               and among women in Israel, both Arab
         of decline in fertility is one of the                             and Jewish, is closely connected with
         highest observed in any population.                               the rise in the level of education -
                                                                           women with higher education have a
         31. From the mid-1980s, the pattern                               lower number of children. Thus, the
         of fertility of Moslem women differs                              1995 census showed that Arab women                     Arabs Lebanon Saudi Syria Jordan Libya       Egypt
         from that of Druze women. Among                                   aged 35-39 who had no education at                       in
                                                                                                                                  Israel
                                                                                                                                               Arabia
         the Druze, fertility continued to decline,                        all gave birth to 6 children on the
         similar to the trend that characterized                           average, while women who had more
         other societies in the process of                                 than 12 years of schooling gave birth
         modernization, and in 2000 it reached                             to only 3.5 children.                                  38. At the beginning of the 1950s,
         3.1 births per woman. Among Moslem                                                                                       the mortality rate of Arab infants
         women, the decline in fertility ceased                            35. Differences in fertility also exist                reached about 60 deaths per thousand
         and the average number of births per                              between women who work outside                         live births. By the end of the 1960s
         woman remained at 4.7. Such a                                     the house and those who do not work                    there was a 50% drop in this rate,
         fertility rate is high, not only in                               (women who work are more educated                      reflected primarily in the decline in
         comparison to that of the other                                   than those who don’t). In the 1995                     mortality from pneumonia and
         population groups in Israel, but even                             census it was found that women aged                    infectious diseases. From the mid-
         in comparison to those of women in                                35-39 who worked gave birth to an                      1970s to 2000 there was a further
         neighboring Arab countries and, of                                average of 3.6 children compared with                  decline of more than 70% (from about
         course, in comparison to the fertility                            5.1 children born to women who did                     32 deaths per thousand births to 8.6
         rates in western European countries,                              not work.                                              per thousand).

         ∂
arab&ju8 4/11/02 11:52 Page 7

         F-2. Infant mortality rate (per 1000 live births), 1955-2000                                            than that of infants of mothers with
                                                                                                                 less than five years of schooling (13.8
                                                                                                                 per thousand).

                                                                                                                 43. The most common cause of death
           70                                                                                          Arabs     in the overall Arab population (graph
           65                                                                                          Jews      F-3) is heart disease (19%) and the
           60
           55
                                                                                                                 second most common is cancer (17%).
           50                                                                                                    In the Jewish population, which is
           45                                                                                                    older than the Arab population, the
           40                                                                                                    proportion of deaths from these two
           35
                                                                                                                 causes is even greater (24% died from
           30
           25
                                                                                                                 each of the two causes).
           20
           15                                                                                                    44. Deaths from external causes (i.e.
           10
                                                                                                                 not diseases), such as road or work
           5
           0
                                                                                                                 accidents, are more common in the
                                                                                                                 Arab population than in the Jewish
                19
                  55
                       19
                         60
                              19
                                65    19
                                        70
                                              19
                                                75
                                                      19
                                                        80
                                                                      19
                                                                        85
                                                                                 19
                                                                                   90
                                                                                           19
                                                                                             95
                                                                                                          20
                                                                                                            00   population (11% and 5% of all deaths,
                                                                                                                 respectively).

                                                                                                                 45. In the past three decades, there
                                                                                                                 has been a decline among both Arabs
                                                                                                                 and Jews in the mortality rate from
         The decline in infant mortality resulted                                                                heart diseases and cerebrovascular
         mainly from the improvements in                                                                         diseases; among Arabs, there was a
         environmental conditions, in the living                                                                 slight rise in the mortality rate from
         standard and in the education of the                                                                    cancer (compared with stability among
         population, and recently also from the      F-3. Deaths by Cause, %, 1997                               Jews).
         increased use of health services and
         innovations in medical care. However,
         infant mortality rate of the Arab                                                                       46. Diabetes is more common among
                                                                                 Arabs                           the Arabs than among the Jews. In a
         population remains double that of the
         Jewish population (graph F-2).                                                         19               health survey conducted by the CBS
                                                                  30                                             in 1999/2000, 14% of Arabs aged
         39. In 2000, the mortality rate among                                                                   45-64 reported that they suffered from
         Moslem infants was 9.1 per thousand                                                                     this disease, compared with 8% of
         births (in 1996 - 10.0), among Druze                                                                    Jews. A larger percentage of Arabs
         infants - 6.3 per thousand (8.9), and                                                            17     also reported that they suffered from
                                                             2                                                   myocardial infarction (7% compared
         among Christian infants - 3.9 per                        3
         thousand (6.1).                                              4                                          with 4%). On the other hand, relatively
                                                                             7              11                   fewer Arabs than Jews suffered from
         40. In neighboring Arab countries,                                           7                          hypertension (25% of the Arabs aged
         infant mortality rate is much higher,                                                                   55-64 compared with 31% of the
         e.g., 24 per thousand in Syria, and                                                                     Jews).
         31 per thousand in Jordan.                                              Jews
                                                                                                  24             47. The rate of mammograms (for
         41. The main reason for mortality                   29                                                  the early detection of breast cancer)
         among Arab infants is congenital                                                                        among Arab women was much lower
         anomalies, which cause 35% of all                                                                       than among Jewish women. Only
         deaths. The second reason is                                                                            16% of Arab women aged 40 and
         immaturity, which causes 16% of the                 2                                                   older underwent the test in the six
         deaths. For the sake of comparison,                 1
                                                              1                                                  months preceding the survey,
         among Jewish infants congenital                          6                                  24          compared with 32% of Jewish
         anomalies cause 27% of all deaths                                   8                                   women.
         and immaturity causes 31% (1993-                                         5
         1996 data).                                                                                             48. Arab men smoke more than
                                                      Heart diseases                  Congenital anomalies       Jewish men. Almost half of Arab men
         42. The more educated the mothers,           Cancer                          Perinatal conditions       aged 20 and older smoke at least one
         the lower the infant mortality rate.         External causes                 Infectious diseases        cigarette a day, compared with about
         Thus, the mortality rate of Arab infants     Cerebrovascular                 Other causes               a third of Jewish men: Arab women
                                                      diseases
         whose mothers have more than fifteen         Diabetes                                                   smoke less than Jewish women - 7%
         years of schooling (7.7 per thousand                                                                    and 17% respectively.
         births in 1993-1996) is much lower

                                                                                                                                                     ∑
arab&ju8 4/11/02 11:52 Page 8

                                                       educated than the Moslem and Druze                   students in the Arab education system
                      G. Education                     populations. Among the Christians                    (6% in the Hebrew education system)
                                                       the proportion of those with more                    dropped out of school in the 9th to
         49. In the past three decades there           than twelve years of schooling is 27%,               11th grades that year.
         has been a dramatic rise in the level         with almost no difference between
         of education of the Arab population.          men and women; among Moslems                         56. As in the Hebrew education
         In 1970, half of this population had          and Druze it is 14% (about 16% of                    system, the parents’ education has a
         up to five years of schooling; today          the men and about 11% of the                         marked effect on the likelihood that
         half have almost ten years of schooling       women).                                              a child will drop out. 16% of the
         (graph G-1).                                                                                       students whose fathers had fewer than
                                                       53. At a time when almost all 6-13                   nine years of education dropped out
         G-1. Arab population at ages 15+, by          year-olds (97%) in the Arab sector                   of school in 1998/99 compared with
         years of schooling, %, 1970, 2000             attend school, the level of kindergarten             10% of students whose fathers had at
                                                       attendance in this sector is still low               least nine years of education (in total,
                           ±π∑∞                        (graph G-2). Only 27% of Arab                        14% of Arab students dropped out
                                                       children aged 2-4 attend kindergartens,              that year).
                            2                          compared with 80% of Jewish
                      13
                                         32            children. However, the rate of                       57. The rate of students who earned
                                                       schooling of 3-4 year-old children in                a matriculation certificate out of all
                                                       the Arab education system, (i.e. in                  12th grade students in the Arab
                                                       learning institutions in which the                   education system rose from 33% in
                                                       language of instruction is Arabic), is               1994 to 46% in 1999 and it is close
                                                       six times higher in Israel than in Egypt,            to the rate in the Hebrew education
                                                       and three times higher than in Jordan.               system (52%). The rate of Arab girls
                   53                                  The rate of schooling among 14-17                    who earned a matriculation certificate
                                  Years of schooling   year-olds in the Arab education system               (51%) was higher than that of the boys
                                         ∞
                           ≤∞∞∞        ∏≠±             has risen over the past three decades                (39%). In the Hebrew education
                                8     ±≤≠π             (29% in 1970; 79% in 2000) and the                   system, the rate of entitlement to
                   15                 ±≥´              gap between the Arab and the Hebrew                  matriculation among girls was also
                                                       education systems decreased (67% and                 higher than among boys, but the gap
                                                       96% respectively).                                   is smaller - 57% and 47% respectively
                                          27                                                                (graph G-3).
                                                       G-2. Enrollment Rates at ages 2-17, by age, %, 1999/2000
                                                                                Arab education                 Hebrew education

                 50                                                 79                                 ±¥≠±∑                                     96

                                                              97                                       ∂≠±≥                                       98

                                                                    79                       2.6        µ                                   90

                                                                               43                       ¥                                        96
         50. The rise in the level of education
         was highest among women, mostly                                            34                  ≥                              82

         due to the fact that their initial level                                                  6    ≤                         67
         of education was much lower than
                                                                                         •             Age             •
         that of men. The proportion of women
         who have more than eight years of
         schooling rose from 9% in 1970 to             54. In 1970, girls comprised only one-               58. The rate of students entitled to a
         59% in 2000 (more than sixfold), and          third of all students in high schools in             matriculation certificate among
         the proportion of men rose from 21%           the Arab education system. Thereafter,               Christians is much higher than among
         to 70% (less than fourfold).                  the increase in the number of Arab                   students of the other religions -
                                                       girls attending high schools exceeded                Moslems, Druze and Jews.
         51. Over the years the educational            the increase in the number of boys,
         gap between Arabs and Jews                    and in 2000 they comprised a little                  59. The higher the father’s education,
         decreased but did not disappear. In           more than half the students (51%).                   the greater the chances of a 12th
         1970, the median number of school                                                                  grade student earning a matriculation
         years of the Jewish population was            55. The school dropout rate among                    certificate. The rate of students who
         over four years more than that of the         Arab boys is higher than that of girls.              earned a matriculation certificate
         Arab population, while today the gap          In the 1999/2000 school year 21%                     among students whose fathers had
         is three years. The "import” of               of the 9th grade boys dropped out                    completed at least thirteen years of
         education by immigrants in the 1990s          compared with 8% of the girls, in 10th               schooling was 70% - double that
         made the closing of this gap more             grade - 16% of the boys compared                     among students whose fathers had
         difficult.                                    with 6% of the girls, and in 11th grade              completed fewer than eight years of
                                                       - 12% of the boys compared with 6%                   schooling (1998).
         52. The Christian population is more          of the girls. Overall, 12% of the

         ∏
arab&ju8 4/11/02 11:52 Page 9

          G-3. Persons entitled to matriculation                                                           H-1. Persons aged 15-64 in the labour
          certificate, by religion (% of all 12th                        H. Employment*                    force, by sex and age (rates per 100),
          graders), 1994, 1999                                                                             2000
                                                                65. The extent of the Arab
                                                                population’s presence in the labour
                                   33                           force is lower in comparison to that                                    Men
         Total Arabs                                            of the Jewish population, which itself
                                             46                                                                                                      88
                                                                                                                                          86
                                                                is low compared with Western                                    82 82           80

                                  31                            countries. Only 40% of all persons                                                             68
           Moslems
                                            43
                                                                aged 15 and older in the Arab                              61                             63
                                                                population are part of the labour force,
                                                                compared with close to 60% in the
                                             46                                                                                                                     39
          Christians                                            Jewish population. While the labour                  36
                                                           64   force participation rate of Arab men
                                                                is almost identical to that of Jewish       11
              Druze
                                       36                       men (about 61%), the rate for Arab               9

                                            44                  women - only 15% - is much lower
                                                                than that for Jewish women - 53%.          ±µ≠±∑ ±∏≠≤¥ ≤µ≠≥¥ ≥µ≠¥¥ ¥µ≠µ¥ µµ≠∂¥
                                                 47             Therefore, the overall Arab                                             Age
               Jews                                             participation rate is low.
                                                      52

                                                                66. The participation rate of Arabs in                            Women
            ±ππ¥       ≤∞∞∞                                     the labour force in Israel is lower than
                                                                the rates in Arab countries. In Egypt,                          79         79
                                                                                                                                                     75
         60. The gap in education between                       for example, the rate among men is
         the Arab and Jewish populations is                     74% and among women 20%; in Syria
         most noticeable in the transition to                   - 80% and 21%, respectively.                          54
         higher learning. Out of all Arab 12th                                                                                                                 42
         grade students in 1991, up to 1998                     67. As the Arab population is younger
         26% began to study in post-secondary                   than the Jewish population, the Arab                                 22
         schools and institutions of higher                     labour force is younger than the Jewish                    19                   18
         learning (11% in universities),                        labour force - 62% of the Arabs in the
                                                                                                            11
                                                                                                                                                          8
         compared with 46% of the Jewish                        labour force are aged 15-34 compared             1                                                  2

         students (24% in universities).                        with 40% among the Jews, and only          ±µ≠±∑ ±∏≠≤¥ ≤µ≠≥¥ ≥µ≠¥¥ ¥µ≠µ¥ µµ≠∂¥
                                                                14% are aged 45 and older, compared                                  Age
         61. In 1999, some 7,200 Arab                           with 35% of the Jews.
         students were studying in universities                                                              Jews         Arabs
         in Israel: 4,300 Moslems, 900 Druze                    68. Even though the overall
         and 2,000 Christians. The proportion                   participation rate of all the Arab men
         of Arab students studying for advanced                 in the labour force is almost identical    ages belong to the labour force). At
         degrees was 19% - lower than among
         the Jewish students (more than 33%).                   to that of Jewish men, there are           older ages, the exit of Arab men from
         The Arab students comprise 7% of all                   differences by age, and the differences    the labour force precedes that of
         students: 9% of all students studying                  in the timing of their entrance to and     Jewish men - less than two-thirds of
         for bachelor's degrees and 4% of all                   exit from the labour force are             Arabs aged 45-54 are in the labour
         students studying for advanced                         particularly marked (graph H-1). Arab      force compared with almost 90%
         degrees.                                               men begin their working life at a          among Jews.
                                                                younger age than Jews - around age
         62. In the 1999/2000 school year                       20 - since most of them do not serve
         almost 2,000 Arab students attended                    in the army and the proportion of
         academic colleges (about 6% of all the                 students among them is lower than          69. In the past two decades there has
         students in those colleges), and a                     among the Jews. In the primary work        been a significant decline in the labour
         similar number attended teacher                        ages, 25-44, participation rates of        force participation rate of Arab men
         training colleges (9%).                                Arab and Jewish men are similar (and       (from nearly 70% to 61%), similar to
                                                                substantially lower than that in other     the trend among Jewish men. The
         63. In the past 20 years, the number                   countries, in the majority of which        decline has occurred in all age groups
         of daily newspapers and periodicals                    more than 90% of the men in these          and is particularly prominent in the
         in Arabic increased from 37 to about                                                              youngest and oldest age groups. The
         60.                                                                                               increase in high school and post-
                                                                                                           secondary enrollment rates has caused
         64. According to a study conducted                     *The data relate to the population in      a drop in the number of teenagers
         in 1996, 130 books were published                      the Arab localities and in East            and young adults in the labour force.
         that year in Arabic (2% of all books                   Jerusalem (without the population in       Expansion of the social welfare system
         published), almost all of them                         other “mixed” localities), which           is one of the main reasons for the
         textbooks.                                             comprises about 95% of the total           decline in the labour force participation
                                                                Arab population).                          in the older groups.

                                                                                                                                                                    π
arab&ju8 4/11/02 11:52 Page 10

         70. Among Arab women, the highest                  women (13%) and Druze women                                                of Jews). 16% of Arab women are
         rate of labour force participation is              (17%), probably due to their higher                                        employed in the health and welfare
         that of women aged 25-34, and even                 educational level.                                                         sector (17% of Jewish women)
         at these ages, the rate is very low -                                                                                         primarily as nurses and social workers.
         only 22% (79% among Jewish                         74. The labour force participation rate                                    The proportion of Arab women
         women).                                            of the Arab (Bedouin) population in                                        employed in industry (16%) is larger
                                                            the Southern district is lower than in                                     than that of Jewish women (11%).
         71. As is true everywhere, more highly             the other districts: only 49% of the
         educated Arabs are more likely to be               Arab men and 6% of the Arab women                                          79. The rise in the level of education
         in the labour force, and the differences           are in the labour force.                                                   of the Arab population in general,
         are particularly prominent among                                                                                              and of those in the labour force in
         women. The labour force participation              75. The rate of unemployment among                                         particular, as well as the exit of older
         rate of Arab women who have more                   the Arabs is higher than among the                                         workers from the labour force, are
         than 15 years of education is 64% -                Jews. 12% of the Arab men who were                                         reflected in a significant rise in the
         seven times that of women with 5-8                 in the labour force in 2000 were                                           proportion of skilled workers (from
         years of education.                                unemployed compared with 7.6% of                                           27% in 1970 to 54% in 2000), and
                                                            the Jews. Unemployment among Arab                                          in a decrease in the proportion of
         72. In general, in almost all educational          women (8.4%) is similar to that among                                      unskilled workers.
         groups the rate of Arab men in the                 Jewish women (9%).
         labour force is higher than that of                                                                                           80. The proportion of academic and
         Jewish men; only among those with                  76. The main branch of employment                                          associate professionals and technicians
         13 or more years of education is the               of Arab men is construction (23% of                                        among Arab employed men rose in
         rate lower among Arabs (graph H-2).                those employed), which replaced                                            the 1990s from 9% to 12%. However,
                                                            agriculture as the largest employer                                        it is still less than half of the proportion
                                                            (half of those employed in the 1950s,                                      among the Jews (25%). Among the
         H-2. Persons aged 15+ in the labour                about one quarter in the 1970s and                                         Arab men employed in these
         force, by sex and years of schooling               about 3% today). Among Jewish men,                                         occupations, more than a third are
         (rates per 100), 2000                              only 7% of the employed persons                                            teachers (14% among the Jews).
                                                            work in construction (graph H-3).
                                Men                                                                                                    81. In recent years, there has been a
                                                     72     H-3. Employed men, by economic                                             decline in the proportion of men
                          60
                                      65
                                                68
                                                            branch, %, 2000                                                            among the teachers in the Arab
                                           57

                                40                                   Agriculture         4

             26
                                                                                     3
                                                                                                                                       H-4. Employed men, by occupation,
                   19                                        Industry, electricity                                 18                  %, 2000
                                                                        & water                                                   26

                                                                   Construction                                              23
                                                                                                                                                         Arabs
                                                                                                 7
             ∞≠¥           µ≠∏        π≠±≤       ±≥´
                                                              Trade and repairs                                    18                               13              12
                        Years of schooling
                                                                                                             14
                            Women                    71
                                                                                                                                                                             3
                                                          Accomodation services                  7
                                                                                                                                                                                 5
                                                                                         4
                                           49
                                                45
                                                                Transportation,                      8
                                                                Communication
                                                                                             5
                                                                                                         9                                       ©•13®                           13
                                20                         Finance and Business                                   17
                   8       9
                                      14                                                                                                      54
             2                                                    Public admin.                                    18
                                                              Education, Health                                         20

             ∞≠¥           µ≠∏        π≠±≤       ±≥´                                                                                     Academic and           Sales workers
                                                               Community and         3
                                                                                                                                         associate              Skilled workers
                        Years of schooling                    Personal Services              5
                                                                                                                                         Managers               Unskilled workers
                                                                                                                                         Clerical workers
           Arabs         Jews
                                                                Arabs                                                                                        Jews
                                                                Jews
                                                                                                                                                         7
         73. The labour force participation                                                                                                                                  25
         rates of Moslem and Christian men                   77. The proportion of Arabs in the
         are identical (62%) and higher than                 business activities sector - 4% - is                                           32
         those of Druze men (53%). The latter                conspicuously lower than among Jews
         are more likely to serve in the regular             -13%.
         army (which is not included in the                                                                                                                                      12
         civilian labor force). The labour force             78. More than a third (36%) of the
         participation rate of Christian women               employed Arab women work in                                                                                 9
         (26%) is higher than that of Moslem                 education, primarily as teachers (21%                                                       15

        ±∞
arab&ju8 4/11/02 11:52 Page 11

         education system, both in elementary         86. Most of the field crops are in the         only 16%). From the end of the 1980s
         schools (57% in 1985/86; 36% in              Negev; most of the plantations and             there has been a significant decrease
         1997/98) and in secondary schools            vegetable crops are in western Galilee.        in the proportion of expenditures on
         (76% and 63% respectively during                                                            food (from 38% to 26%) and on shoes
         these periods).                              87. Olives are prominent among the             and clothing (from 12% to 6%), while
         In elementary schools in the Arab            plantations in Arab localities: the groves     there was a significant rise in the
         education system, the rate of teachers       comprise 73% of all the plantation             proportion of expenditures on
         with academic degrees (24%) is half          area. For the purpose of comparison,           transportation and communications
         the rate in the Hebrew education             in the Jewish sector, the main plantation      (from 9% to 16%). Such trends
         system; in secondary schools the             crops are citrus fruits (35%), while olives    characterize societies in the process
         difference in the rates is smaller (62%      are grown in only 7% of the area.              of raising their standard of living.
         and 71% respectively).
                                                      88. Prominent among the animals
         82. The proportion of Arab women             raised on Arab farms are sheep and             92. Almost all the Arab households
         employed in academic and associate           goats (cattle on Jewish farms).                (92%) own the dwellings in which they
         professionals and technicians (36%)                                                         live (69% among Jews).
         is similar to the proportion of Jewish
         women in these occupations (34%).            I-1. Percent of Arab farms, 2000               93. The value of the dwelling owned
                                                                                                     by an Arab household is NIS 490,000
                                                                   %                                 on the average, compared with NIS
                     I. Agriculture                                                                  805,000 for a dwelling owned by a
                                                              Sheep                      74          Jewish household. The average
         83. Among Arabs, as among Jews,                       Goats                   67
                                                                                                     number of rooms in the dwellings is
         there has been a long-term decline in                                                       almost identical - about 3.8; however,
         the number of people employed in                      Cattle   10
                                                                                                     since the average number of people
         agriculture. Today some 9,000 Arabs                    Pigs                            98   in Arab households (5.2) is larger than
         are employed in agriculture — less                                                          in Jewish households (3.4), the density
                                                      Total crop area    12
                                                                                                     in the former is greater.
         than a third of the number at the
         beginning of the 1960s. However, the             Field crops   8

         amount of the agricultural land in the           Plantations         22
                                                                                                     94. Since the end of the 1980s there
         Arab sector, apparently due to its                                                          has been a significant rise in ownership
                                                          Vegetables    10
         distance from the center of the country                                                     of durable goods among the Arab
         and therefore its being less attractive                                                     population, even though it is lower
         for non-agricultural uses, has remained                                                     than in the Jewish population. The
         almost the same as it was. A                                                                difference between the two groups in
         phenomenon characteristic of the Arab               J. Standard of living*
                                                                                                     the level of ownership of telephone
         sector is the reduction in the size of                                                      lines and cars is small (graph J-1).
         the plots due to the profusion of heirs.     89. In 2000 the average gross hourly
                                                      income of an Arab wage earner was
         84. Agricultural crops of the Arab           NIS 25 - and the monthly income -
         sector, most of which is in the Negev        NIS 4,472 (a little more than 60% of           J-1. Ownership of durable goods, %,
         (the southern part of the country), rely     the income of a Jewish wage earner).           1986/7, 2000
         mostly on rain and not on irrigation,                                                                         6
         as in the Jewish sector. In 2000, 86%        90. Income from work constitutes 56% Vacuum cleaner                            33
         of the crop areas of Arabs were              of the total income of Arab households                                                           68

         unirrigated, compared with 39% in            (66% in Jewish households), income
         Jewish settlements. As a result of the       from allowances and subsidies - 25%                                  11

         reliance on rain, the damage to crops        (11%), income from capital 17% (17%) Stereo system                        22
                                                                                                                                                  61
         in drought years, such as 1999, was          and income from pensions and
         great. In the western Galilee, which         provident funds - 2% (6%). The                                       11

         is the second-largest crop area in the       proportion of income from work has             VCR                              38
                                                                                                                                                        71
         Arab sector after the Negev, the reliance    declined since 1986/7 (from 68%),
         on rainwater is smaller than in the          and the proportion of income from One phone                                    33
         Negev.                                       allowances and subsidies has increased line at least                                                   85
                                                      (from 20%).                                                                                                 95

         85. Close to 60% of all crop areas in                                                                     2
         Arab localities in 2000 were field crops     91. The largest expenditure in Arab              Personal                 21
                                                      households is on food - 26% of the              computer
         such as wheat, similar to their proportion                                                                                         50

         in the Jewish sector. The proportion         total expenses in 2000 (in Jewish
                                                                                                                           9
         of plantations in the Arab sector (33%)      households, the largest expenditure is           One car                             46
         is larger than in the Jewish sector          for housing, 23%, and food constitutes            at least                                 56
         (24%), while the area of vegetable
                                                                                                       Arabs 1986/7
         crops is smaller (9% and 17%                 * In 2000 the data do not include East           Arabs 2000
         respectively).                               Jerusalem.                                       Jews 2000

                                                                                                                                                              ±±
arab&ju8 4/11/02 11:52 Page 12

                  Table A: Demographic and Social Indicators, Arabs in Israel and in Arab Countries

                                                            Arabs in                                                            Saudi
                                             Period         Israel       Egypt        Jordan    Lebanon          Libya          Arabia         Syria

           Natural increase rate - %         2001            3.1          2.1          2.2          1.7            2.4            2.9            2.6
           Percent aged 0 -14                1999           41           36           40        32               35             43             42
           Percent aged 65+                  1999            3            4            3            6              3              3              3
           Life expexpectancy - males        1999           74.6         65.3         68.9      71.3             68.6           70.3           69.8
           Life expexpectancy - females      1999           77.9         68.5         71.5      74.4             72.5           72.7           72.1
           Infant morality rate              1970           33*          157          77        45               105            118            90
           Infant morality rate              1999            9            41          29        28                 19           20             25
           Total fertility rate              1970-1975       8.0          5.5          7.8          4.9            7.6            7.3            7.7
           Total fertility rate              1995-2000       4.3          3.4          4.7          2.3            3.8            6.2            4.0
           Adult literacy - males - %        1999           95           66           95        92               90             84             88
           Adult literacy - females - %      1999           88           43           83        80               67             66             59
           Economic activity rate - males    1999           61.0         78.4         78.2      76.5             77.2           79.6           78.3
           Economic activity rate - females 1999            15.0         34.5         25.8      29.1             24.7           20.7           28.2
           Percent share of consumption**
               Lowest 20%                    1997            8.1          9.8          7.6      ..               ..             ..             ..
               Highest 20%                   1997           39.2         39.0         44.4      ..               ..             ..             ..

           * 1975-1979
           ** Data for Arabs in Israel relate to 96% of the Arab population. The data for Egypt relate to 1995.
           Sources: Natural Increase - Population Reference Bureau 2002, Rest - UNDP, Human Development Report, 2001.

          Table B: Demographic Indicators, Arabs in Israel by District

                                                    Total Jerusalem D. Northern D. Haifa D. Central D. Tel Aviv D. Southern D.

             1. Population (ooo’s)                 ±¨±∏π          ≤±∂          µµ≤           ±∑µ          ±±µ             ±¥            ±±∂
             2.   Increase rate -%                    ≥Æπ          ≥Æ∑          ≥Æ∏           ≥Ʊ          ≥Æ∏            ≤Æπ            ∂Æ≥
             3.   Percent Distribution               ±∞∞           ±∏           ¥∂            ±µ           ±∞               ±            ±∞
             4.   Percent Arabs of total population ±π             ≤π           µ±            ≤±             ∏              ±            ±≥
             5.   Percent Moslem of total Arabs       ∏≤           πµ           ∑∞            ∏∞           π∑             ∑∂            ±∞∞
             6.   Percent aged 0-17                   ¥∂           ¥∂           ¥¥            ¥≥           ¥∂             ¥∞             ∂±
             7.   Percent aged 65+                      ≥            ≥            ≥             ≥            ≥              ≥              ±
             8.   Total fertility rate                ¥Æ≥          ¥Æ¥          ≥Æ∑           ≥Æ∏          ¥Æµ            ≥Æ∏            πƱ
             9.   Infant mortality rate               ∏Æ≥          ∑Æ≤          ∑Æ≤           ∏Ʊ          ∂Æ∏          ®µÆ¥©           ±≥Æ∏

        ±≤
You can also read