COVID19: QUARANTINED ECONOMICS - Global Economic Outlook as of March 2020 - Euler Hermes

Page created by Victor Norris
 
CONTINUE READING
COVID19: QUARANTINED ECONOMICS - Global Economic Outlook as of March 2020 - Euler Hermes
COVID19:
QUARANTINED
ECONOMICS

Economic, Capital Markets
and Industry Research

Global Economic Outlook
as of March 2020

© Copyright Allianz
COVID19: QUARANTINED ECONOMICS - Global Economic Outlook as of March 2020 - Euler Hermes
PRE COVID-19: WALL OF UNCERTAINTIES

     TRADE WAR                               ECONOMIC SLOWDOWN, RECESSION                                               ITALIAN FISCAL POLICY                                    USA 2020 ELECTION
•   February 14: US section 301                        •   No full-fledged global recession                         •    The new governing coalition in Italy                •   Additional volatility, in the US, on the
    tariffs of 15% imposed on                                                                                            takes away, at least temporarily, the                   back of the campaign: trade policies,
                                                       •   Soft landing of the economy: after
    01/09/2019 (subset of $300                                                                                           risk of a strong confrontation with                     financial vulnerabilities, the fragile
                                                           +3.1% in 2018, +2.5% in 2019,
    Billion) cut in half.                                                                                                the EU as the fiscal deficit is likely to               emerging markets and high valuations
                                                           +2.4% in 2020E (expected before
•   Average US tariffs on imports                                                                                        be kept under control                                   will create more volatility.
                                                           COVID-19)
    from China remain elevated at
    19.3 percent.

                              HONG-KONG PROTESTS                                     EARNINGS RECESSION                                            GLOBAL BOND YIELDS
                               •   Economic recession, economic                  •   Strong correction post Q4 2018                            •       Lower for longer: end of period
                                   outlook revised downwards                     •   Since end of Q1, 12-month forward EPS                             forecasts: Bund -0.6% 2019, -0.1%
                                                                                     gradually recovering (despite May +                               2020. 10-year U.S: 1.6% 2019, 1.9%
                                                                                     August disruptions)                                               2020 – before COVID-19

                              NEGATIVE DEBT PILE                                                 BREXIT                                                 CENTRAL BANK AMMO
                          •   Further vulnerabilities due to                         •   The UK formally left the EU on 31                         •     More central bank easing
                              superdovishness of central banks                           January 2020, but there is still a lot to                 •     Diminishing returns to policy mix
    © Copyright Allianz   •   Increasing risks for corporates in U.S.,                   talk about and months of negotiation                                                                                               3
                              Eurozone & China (SOEs)                                    to come.
COVID19: QUARANTINED ECONOMICS - Global Economic Outlook as of March 2020 - Euler Hermes
THE GLOBAL PANDEMIC COULD LAST UNTIL JUNE
             Distribution of confirmed cases of COVID-19 (%)                                 Daily change in number of confirmed cases per 1mln
                                                                                                                  people
      100
                                                                                           1000,0

        80
                                                                                            100,0

        60
                                                                                             10,0
        40
                                                                                              1,0
        20
                                                                                              0,1
        0
      11/01/2020               31/01/2020             20/02/2020             11/03/2020
                                                                                              0,0
                      Rest of the world
                                                                                                    0    2   4   6   8   10 12 14 16 18 20 22 24 26 28 30 32 34 36 38
                      Europe
                                                                                                        Hubei province, from 17/01             South Korea, from 17/02
                      APAC excluding mainland China (and excl. Diamond Princess)
                                                                                                        Italy, from 20/02                      France, from 28/02
                      Rest of mainland China                                                            Germany, from 01/03                    U.S., from 07/03
                      Hubei province                                                                    Spain, from 28/02
    Source: Official reports, Allianz Research                                            Source: Official reports, Allianz Research

    Until 26 February, more than 95% of confirmed                                         Though not completely over yet, the spread of the
    cases of COVID-19 were in mainland China. The                                         epidemic in China took 32 days to recede (on 18
    distribution has since spread to the rest of the world,                               February). Italy, France, Germany and the U.S. are
    with c.33% of cases located in Europe, as of 15                                       trailing the Hubei province by respectively 34, 42, 44,
    March.                                                                                and 50 days.
© Copyright Allianz
COVID19: QUARANTINED ECONOMICS - Global Economic Outlook as of March 2020 - Euler Hermes
COVID-19 SHOCK TRANSMISSION: 3 STAGES

                  STAGE 1              STAGE 2                    STAGE 3

        Epidemic in China       Epidemic starts spreading      Global pandemic and
                                 to rest of the world and     confinement measures
                                authorities react belatedly

               Supply-chain &            Financial                Consumption
                trade shocks           markets shock              and demand
                                                                     shock

© Copyright Allianz
COVID19: QUARANTINED ECONOMICS - Global Economic Outlook as of March 2020 - Euler Hermes
GLOBAL TRADE TO FALL INTO A STRONG RECESSION
IN H1 BOTH IN VOLUME AND VALUE TERMS
            Global Trade growth in volume and value (%, y/y)               Cost for global trade for one month of confinement
                                                                                                 (USDbn)

                                                                                                                                     Transport services
                                                                                                                     Travel          A 50% shock due to
                                                                                                Goods
                                                                                                                No travel during    the closure of borders        Total
                                                                                              20% shock
                                                                                                                  one month            & containement
                                                                                                                                           measures
                                                               EU 28                             104.1                 34.8                  16.1                  155
                                                               China                             72.0                  24.0                  8.0                   104
                                                               US                                42.8                  11.1                  4.2                    58
                                                               Total per month                    219                   70                    28                   317
                                                               Total per quarter                  436                  282                    54                   772
                                                               * For goods and transport services 1 month of lockdown, 1 month of 70% back to normal activity and 1 month of
                                                               80% back to normal activity
                                                                For travel we take full impact for three months

                                                                Sources: ITC, Euler Hermes
    Sources: IHS Markit, Euler Hermes, Allianz Research

    We expect two quarters of recession in trade in            We estimate that one month of confinement in the EU, China
    goods and services (Q1 and Q2) which will bring the        and the US would lead to USD317bn of export losses at the
    annual figure to -3.7% in 2020. In value terms,            global scale. Over a quarter, taking into account a
    plummeting commodity prices will weigh on prices.          progressive come back to normal levels of activity, the losses
© Copyright Allianz                                            would reach more than USD700bn                                 5
COVID19: QUARANTINED ECONOMICS - Global Economic Outlook as of March 2020 - Euler Hermes
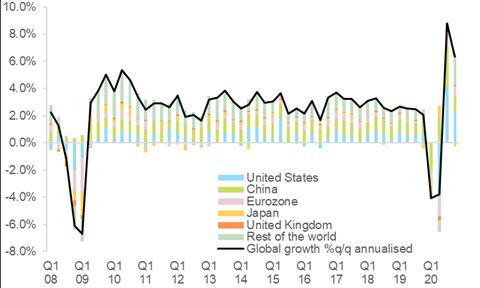
CLOSURE OF BORDERS IS A KEY RISK FOR SUPPLY
CHAINS IN GERMANY, ITALY AND FRANCE
                              Western Europe sector vulnerabilities to imports from Eastern Europe
                                                 Belgium        France     Germany     Italy    Netherlands   Spain
                       Agrifood                      0.22%           0.41%     1.11%      1.00%       0.45%      0.51%
                       Automotive                    0.60%           1.37%     2.82%      0.99%       0.73%      1.14%
                       Chemicals                     0.13%           0.46%     1.02%      0.52%       0.37%      0.43%
                       Commodities                   0.40%           0.04%     0.17%      0.34%       0.22%      0.07%
                       Construction                  0.48%           0.84%     2.25%      1.84%       0.69%      0.61%
                       Electronics                   0.19%           0.42%     0.88%      0.60%       0.25%      0.41%
                       Energy                        0.01%           0.02%     0.22%      0.15%       0.14%      0.08%
                       Household Equipment           0.73%           0.84%     1.98%      1.18%       0.72%      0.85%
                       Machinery & Equipment         0.49%           0.67%     2.43%      0.73%       0.55%      0.74%
                       Metals                        0.23%           0.36%     1.23%      0.71%       0.40%      0.35%
                       Paper                         0.16%           0.41%     1.65%      0.68%       0.53%      0.43%
                       Pharmaceuticals               0.08%           0.24%     0.50%      0.20%       0.29%      0.31%
                       Textile                       0.18%           0.31%     0.78%      1.07%       0.24%      0.18%
                       Transport Equipment           0.23%           0.18%     0.73%      0.54%       0.45%      0.18%
                       Total (incl. Others)          0.26%           0.56%     1.39%      0.74%       0.43%      0.52%
                       Sources : ITC, Euler Hermes, Allianz Research

Germany appears as the most dependent to imports from Eastern Europe (most notably in the agri-food, construction and
machinery and equipment sectors). Germany is followed by Italy (with the highest dependency in construction, household
equipment, textile) and France (with automotive, construction and household equipment). Sectors the most at risk of supply
chain disruption are the automotive, construction and household equipment sectors. It appears that the chemicals, electronics,
pharmaceuticals and transport equipment are the most resilient due to low levels of importations from Eastern Europe. When
looking at the risk of insolvencies due to sourcing issues, in the top 5 sectors/countries most at risk, four sectors are in
Germany: construction, paper, automotive and household equipment. The construction sector in France is the fifth sector.
© Copyright Allianz
COVID19: QUARANTINED ECONOMICS - Global Economic Outlook as of March 2020 - Euler Hermes
MARKET DASHBOARD
                                                            16.03.2020   Year-to-date   Week-on-week   16.03.2020 - 20.02.2020   16.03.2020 - 20.01.2020
                      Sovereign Yields (10y)                     %                                           bps
                      US                                       0.73         -118             23                  -80                      -111
                      Eurozone                                -0.46          -27             39                   -1                       -24
                      Germany                                 -0.46          -27             39                   -1                       -24
                      France                                     65          34              19                   42                        39
                      Italy                                     262          101             37                  127                      105
                      Spain                                     131          65              20                   63                        64
                      United Kingdom                           0.44          -39             28                  -14                       -21
                      Japan                                    0.01           3              16                    5                        0
                      Emerging Markets ($)                     558           257            112                  248                      265
                      Corporate Credit - Investment Grade       bps                                          bps
                      US                                       255          154             67                   151                      156
                      Europe                                   189          95              33                   100                       97
                      Corporate Credit - High Yield             bps                                          bps
                      US                                       838          478             170                  476                      500
                      Europe                                   713          405             174                  413                      413
                      Foreign Exchange                         level                                          %
                      USD EUR                                  1.11         -0.8            -2.5                 3.1                       0.5
                      JPY USD                                105.69         -2.7             3.1                 -5.7                     -4.1
                      GBP EUR                                  0.91         6.7              4.1                 8.2                       6.4
                      Equities                                 level                                          %
                      US                                       2386         -26.1          -13.1                -29.3                    -28.3
                      Eurozone                                 2450         -34.6          -17.2                -35.9                    -35.5
                      Germany                                  8742         -34.0          -17.7                -36.0                    -35.5
                      France                                   3881         -35.1          -17.6                -36.0                    -36.1
                      Italy                                   14980         -36.3          -18.9                -40.3                    -37.6
                      Spain                                    6107         -36.0          -20.8                -38.5                    -36.8
                      United Kingdom                           5151         -31.7          -13.7                -30.7                    -32.7
                      Japan                                   17002         -28.1          -13.7                -27.6                    -29.4
                      Emerging Markets ($)                     833          -25.3          -12.1                -23.9                    -27.3
                      World ($)                                1703         -27.8          -14.7                -29.6                    -29.5
                      Equity Volatility                        level                                   absolute change
                      US                                       82.7         68.9            28.2                 67.1                     70.6
                      Eurozone                                 85.6         71.7            31.5                 71.5                     74.4
                      Commodities                              level                                          %
                      Oil Brent ($ per barrel)                 30.0         -54.8          -17.9                -49.6                    -54.1
                      Gold ($ per ounce)                     1502.2          -1.2           -9.8                 -7.3                     -3.8
© Copyright Allianz
                      Sources: Refinitiv, AZ Research
                                                                                                                                                           7
COVID19: QUARANTINED ECONOMICS - Global Economic Outlook as of March 2020 - Euler Hermes
GLOBAL RECESSION IN H1 2020, FOLLOWED BY A
U-SHAPE RECOVERY
               Global real global GDP growth, q/q annualized                       Real global GDP growth by country, annual
                                                           Forecasts

                                                                       Real GDP growth          2019        Dec forecasts   2020   2021

                                                                       World                     2.5             2.4         0.9   3.0
                                                                       United States             2.3             1.6         0.5   2.7
                                                                       China                     6.1             5.9         4.0   5.8
                                                                       Japan                     0.7             0.9        -0.5   1.0
                                                                       Eurozone                  1.2             1.0        -1.8   2.1
                                                                       Germany                   0.6             0.6        -1.8   2.2
                                                                       France                    1.3             1.2        -1.3   2.2
                                                                       Italy                     0.3             0.4        -3.5   1.7
                                                                       Spain                     2.0             1.6        -0.8   1.9
                                                                       United Kingdom            1.4             1.0        -0.7   1.2

                                                                       Sources: Euler Hermes, Allianz Research
    Sources: Euler Hermes, Allianz Research

    We expect the supply and demand shocks to push                     Global GDP growth has been revised by -1.5pp in 2020
    the global economy into recession in H1 2020 with                  and we expect a very strong technical recession at the
    the U.S. and the Eurozone being in recession.                      global scale in H1 followed by a U shape recovery

© Copyright Allianz
COVID19: QUARANTINED ECONOMICS - Global Economic Outlook as of March 2020 - Euler Hermes
POLICY RESPONSES WILL HURT PUBLIC FINANCES
    Fiscal stimulus by country and impact on                                   Fiscal balance, % of GDP                               Public debt, % of GDP
       real GDP growth and fiscal balance

                     Fiscal             Impact on     Impact on
                              Share of
                  stimulus             GDP growth fiscal balance
                                 GDP
                  (EURbn)                  (in pp)        (in pp)
Germany                 12      0.4%           0.1           -0.3
France                  45      2.0%           0.8           -1.3
Italy                   25      1.4%           0.7           -0.9
Spain                   18      1.4%           0.5           -1.1
UK                      30      1.4%           0.6           -0.9
US                    1000      4.6%           1.2           -4.1

                                                                    Note: forecasts do not include State guarantees and   Note: forecasts do not include State guarantees and
                                                                    potential nationalisations of firms.                  potential nationalisations of firms.
  Sources: Euler Hermes                                             Sources: Euler Hermes                                 Sources: Euler Hermes

  Bazooka economic policy responses                                 Fiscal responses in every impacted                    The increase in fiscal deficits in 2020
  will not avoid a global recession in H1                           country amount to as high as 6% of                    would push public debts above 100%
  2020, but should help companies and                               GDP by supporting companies’ working                  of GDP in France and Spain and to
  consumers withstand the severe albeit                             capital requirements (credit lines for                147% of GDP in Italy
  temporary shock.                                                  SMEs, tax reliefs) and scaling up social
                                                                    safety nets (temporary unemployment
  © Copyright Allianz                                               and other transfers).
COVID19: QUARANTINED ECONOMICS - Global Economic Outlook as of March 2020 - Euler Hermes
MONETARY POLICY: A LOT ALREADY ANNOUNCED,
WITH ROOM FOR MORE IF NECESSARY
                                            ECB                                                    FED
Whatever it           -   EUR 120bn QE envelope till end-2020          - 150bps rate cut
takes 2 –             -   SSM looser bank regulation                   - Restart of QE to the tune of USD700bn
already               -   Bold and generous TLTRO terms                - USD1.5tn of supplementary liquidity injections in the repo
implemented /         -   Deposit rate cut                               market to backstop liquidity in the Treasury market
expected in           -   More QE                                      - three-month credit in U.S. dollars on a regular basis and
coming months         -   Capital key drop                               at a rate cheaper than usual arranged among G6 central
                      -   Increase in issuer limit to above 40%          banks
                                                                       - Instalment of commercial paper funding facility
                                                                       - Further increase in QE purchase

Whatever it           -   (unconditional) OMT                          -   Negative rates
takes 3 –             -   Sovereign bond yield targeting               -   Yield targeting
If crisis             -   direct financing of fiscal expansion (MMT)   -   Strong step-up in asset purchases
deepens,              -   Helicopter money                             -   direct financing of fiscal expansion (MMT)
measures will                                                          -   Helicopter money
become more
exotic
© Copyright Allianz                                                                                                            10
JOBS AT RISK: 65 MILLION PEOPLE AND EUR140BN
AT THE EU LEVEL (~1% OF GDP)
         Monthly new bank loans and stock of corporate debt,            Employment at risk and cost for public finances
                              EUR bn
                                                                                          Compensation (incl.
                                                               Cost of Kurzarbeit at        employer social         Full time-jobs at
                                                                  70% subsidy           contributions, EUR bn) at    risk in Million
                                                                                                   risk

                                                               EU 27                                140                    65
                                                               Eurozone                             122                    49
                                                               Germany                               40                    12
                                                               France                                25                    7
                                                               Italy                                 16                    8
                                                               Spain                                 12                    9

    Sources: ECB, BIS, Euler Hermes, Allianz Research           Sources: Eurostat, Euler Hermes, Allianz Research

    Public guarantees in the Eurozone of EUR1000bn             A lockdown is estimated to shutdown 30% of the economy
    (EUR500bn in Germany, EUR300bn in France,                  and hence put jobs at risk given the temporary pause of
    EUR100bn in Spain) will help avoid company                 activity. We estimate that 65 million people are likely to
    bankruptcy for 3 to 4 months.                              benefit from the partial unemployment benefits which
© Copyright Allianz                                            would cost EUR140bn, or 0.9% of GDP
SCENARIOS: U-SHAPE V. PROTRACTED CRISIS
                                      Upside: V-shaped                                             Baseline: U-shaped                                              Protracted crisis
                                         (limited impact)                                             (important impact)                                           (very severe impact)

                                                                                        Outbreaks in China, Europe & US call for drastic
                       Secondary outbreaks outside China & upward trend in                                                                        A longer sanitary crisis triggers trigger brutal market dive
                                                                                               confinement measures which take
                                                   Scenario
                         global contagion trigger strong market corrections.
                                                                                     a heavy toll on the economy & markets. Recovery is U-
                                                                                                                                                   & global recession similar to 2008-09 crisis. A liquidity
                      Resilient consumer & credible policy responses allow for a                                                                   crisis is drive by a systemic credit event. Policymakers
                                               in a nutshell
                                V-shaped recovery within two quarters.
                                                                                    shaped as other uncertainties incl. the U.S. election weigh
                                                                                              on economic momentum in H2 2020.
                                                                                                                                                              are unable to restart growth engines.

                                                      Health
                          Measured & well-targeted containment strategies,
                                                                                   Belated & uncoordinated policy action subsequently calls for   Belated & uncoordinated policy action subsequently calls
                        including a coordinated response at the EU level, see
                                                      policy
                        economic activity resume by Q2, with catch-up effects
                                                                                     more aggressive containment measures incl. EU border          for more aggressive and longer containment measures
                                                                                   closures with strong negative economic impact beyond H1.          with strong negative economic impact beyond H1.
                                      most pronounced in H2.
                                                   response

                                                 Economic                           Degree of economic disruption and extent of the financial     Fiscal & monetary policy are even more aggressive but
                      Swift implementation of targeted fiscal measures & rapid
                                                    policy
                       monetary policy easing help alleviate demand shock.
                                                                                   market sell-off call for more aggressive fiscal and monetary
                                                                                                               easing
                                                                                                                                                   measures are unable to restart growth and fail to avert
                                                                                                                                                                      liquidity crisis.
                                                 measures

                                                 Economic
                                   Global growth: +2.2% in 2020
                                                                                   Global growth: +0.9% in 2020 (technical recession in H1 in
                                                                                                    much of Europe & Asia)
                                                                                                                                                      Global growth: -1.5% in 2020 (global recession)
                                                    impact
                                       Global trade: +0.5%.
                                                                                                       Global trade -3.7%
                                                                                                                                                                    Global trade -10%
                                    Global insolvencies: +7.5%                                                                                                  Global insolvencies: +25%
                                                                                                   Global insolvencies: +14%
© Copyright Allianz

                                                                                                                                                                                                           12
HARDLY ANY INDUSTRY SPARED BY COVID-19
  Sector’s vulnerability to Covid-19 expansion by stage and                                                           Global sector’s vulnerability to economic cycle* and
                       countries/regions                                                                                      sector risk ratings (as of end 2019)

                                  Stage 1                 Stage 2                         Stage 3

  Metals                       China, RoW                  World                           World
  Energy                           World            North America, RoW                     World
  Machinery                    China, RoW       Europe, North America, RoW                 World
  Electronics (components)  China, APAC, RoW            China, APAC                        World
  Chemicals                    China, APAC                 China                 Europe, North America
  Automotive                China, APAC, RoW            China, RoW               Europe, North America
  Transportation               China, APAC          APAC, Europe, RoW                      World
  Non-food Retail           China, APAC, RoW         China, APAC, RoW                      World
  Textiles                         China                   China           APAC, Italy, France, Germany, Turkey
  Paper                            China                   APAC                            World
  Construction                     China                   China                 Europe, North America
  Agrifood                         China              North America                          -
  Software & IT Services           China                     -                   Europe, North America
  Transport Equipment              China                China, APAC                        World
  Pharmaceuticals          China, North America           Europe                             -
  Computers                        World                     -                             World
  Telecommunications                 -                       -                               -

                                                                                                                  (*) based on the coefficient of regression of global turnover and GDP over the LT
  Source: Euler Hermes, Allianz Research                                                                          Source: Oxford Economics, Euler Hermes, Allianz Research
The stage 1 hit all the Chinese sectors, from BtoC to BtoB ones, and all global sectors with interconnections with China as a key
market (demand shock) or key supplier (supply chain shock), notably transportation, automotive, energy, metal, electronics,
computers and non-food retail. The stage 2 hit most fragile companies due their exposition to liquidity risks (leverage or profitability
issue), adding Energy, in particular in North America, and Machinery to the list of sectors most at risk. The stage 3 is now pushing up
the risk of insolvencies higher the sectors most exposed to global economic cycle: energy, metals, machinery and automotive are on
the
©     topAllianz
  Copyright of the list. Less exposed/most resilient would be telecom, pharmaceuticals and IT services.
GLOBAL INSOLVENCIES HEADING TO NEW
RECORDS SINCE 2008-2009
             EH Global and Regional Insolvency Indices                 2020 re-forecasts – selected key countries and region
                       (yearly changes in %)

  Source: national statistics, Euler Hermes, Allianz Research      Source: national statistics, Euler Hermes, Allianz Research

Global insolvencies have the potential to increase by +14%, looking at historical sensibility to economic cycle and government
interventions to support corporates (tax deferrals, state loans and guarantees, etc..) and to avoid top insolvencies and their
domino effect (nationalization) – lowering insolvencies growth by 3 to 5 pp. This 4th consecutive year of rise would result from a
+7% increase in the US, a +15% rise in China and a +16% surge in Europe. Final figures still depend on (i) the timing and
magnitude of other policy measures yet to announced and (ii) the potential closures of business courts (which would create
 © Copyright Allianz
lags and delays in official registrations of liquidations and restructuring procedures).
FIRMS AT RISK IN CORE EUROZONE: 13,000 WITH AN
AVERAGE TURNOVER OF EUR40MN AT RISK
                  Share of SME & MidCaps at risk, % of total           The share of SME & MidCaps at risk, % of total – top 5 sectors
                                                                            Germany                    France                    Italy
                                                                        Construction      15%      Services       20%   Construction        16%
                                                                        Metals            11%      Construction   19%   Agrifood            11%
                                                                        Agrifood          11%      Retail         12%   Services            11%
                                                                        Machinery         10%      Automotive     8%    Retail               9%
                                                                        Services          10%      Agrifood       8%    Machinery            9%

                                                                              Spain                   Belgium             The Netherlands
                                                                        Agrifood          18%      Construction   20%   Services            26%
                                                                        Construction      16%      Services       15%   Construction        12%
                                                                        Services          15%      Agrifood       10%   Agrifood            11%
                                                                        Transport          9%      Retail         9%    Automotive           9%
                                                                        Automotive         6%      Transport      9%    Machinery            9%

                                                                           Sources: Euler Hermes
           Sources: Euler Hermes

         We find that more than 13,000 SMEs & MidCaps (7% of           Firms at risk were mostly concentrated in three sectors:
         total) in the six biggest Eurozone countries are at risk of   Construction,     Agri-food   and     Services.     The
         going bust after persistent low profitability and turnover    concentration in the top 5 sectors is highest in France
         growth. We find that more than EUR500bn of turnover           (67%) and the Netherlands (67%) followed by Belgium
         (or 4% of Eurozone GDP) could be at risk.                     (64%), Spain (63%), Germany (57%) and Italy (56%).
© Copyright Allianz
CORPORATES: WHAT COULD WRONG?
                                  USD Corporate spreads evolution                                                                 EUR Corporate spreads evolution

                          Technology                                      W-o-W                                        Technology                                      W-o-W
                               Utilites
                                                                          Last - 21.01.2020                                 Utilites                                   Last - 21.01.2020
                                                                          Ytd                                 Telecommunications                                       Ytd
                 Telecommunications
                      Travel & Leisure                                                                             Travel & Leisure

                                Media                                                                                        Media

                                Retail                                                                                       Retail

                          Health Care                                                                                  Health Care

          Personal & Household Goods                                                              Personal & Household Goods
                     Food & Beverage                                                                              Food & Beverage

                                                                                              Sectors
Sectors

                   Automobile & Parts                                                                           Automobile & Parts
           Industrial Goods & Services                                                                  Industrial Goods & Services
              Construction & Materials                                                                     Construction & Materials
                     Basic Resources                                                                              Basic Resources
                           Chemicals                                                                                    Chemicals
                            Oil & Gas                                                                                    Oil & Gas
                           Real Estate                                                                                  Real Estate
                    Financial Services                                                                           Financial Services
                            Insurance                                                                                    Insurance
                               Banks                                                                                        Banks

                                          0   50   100     150      200      250        300                                            0    50       100         150          200          250
                                                           bps                                                                                             bps

  USD corporate markets have shown little issuer discrimination at the                                       Similarly, EUR corporate markets have shown little sector
  beginning of the coronavirus pandemic episode. However, recent                                             selectivity during the outbreak of the virus but are diverging as
  developments, specially within the oil market, have shown some                                             the Covid19 advances. Sectors like Automobile, basic
  discrimination. The sector most hit by this sector split have been                                         resources and insurance are particularly under pressure in the
  oil/gas, automobile and travel/leisure.                                                                    IG universe.
                                                                                                                                                           Sources: Refinitiv, AZ Research
 © Copyright Allianz

                                                                                                                                                                                             16
GERMANY: NO PLACE TO HIDE FOR THE ECONOMY
AS FIRST AND SECONDARY ROUND EFFECTS BITE
     Germany: Manufacturing export expectations in 3m &             Germany: Impact of Covid-19 on quarterly GDP
                China manufacturing PMI
                                                                3

                                                                2

                                                                1

                                                                0

                                                               -1

                                                               -2

                                                               -3

                                                               -4
                                                                           Q1                 Q2    Q3                  Q4

                                                                        Local confinement impact    Exports to Asia
                                                                        Exports to ROW              Supply chain disruption
                                                                        GDP (q/q, in %)

  Sources: Allianz Research                                  Sources: Refinitiv, Allianz Research

German exports are likely to see a decline in H1 2020 that   The German economy will be under pressure on all
resembles the setback during the great financial crisis in   fronts in H1 2020 as confinement measures hurt global
2008/9. While initially driven by a drop of demand from      trade, disrupt supply chains and put a pause on
China, confinement measures in Europe including border       domestic investment and consumption activity. The
restrictions
© Copyright Allianz will trigger a further drop.             rebound in H2 will only partially compensate.
FRANCE: RECORD HIGH SHOCK ON PRIVATE
CONSUMPTION AND INVESTMENT IN Q2
                      Real GDP growth by component                         Manufacturing PMI components

    Sources: Allianz Research                             Sources: AGI, Allianz Research

    The shock on domestic demand will be much worse       Transposing the Chinese shock on France bring the
    than during the 2008-09 crisis, but fiscal spending   total level of activity in the manufacturing sector at
    will alleviate the overall impact                     levels similar to 2009. The inventory to new orders ratio
                                                          is expected to go significantly above 1, which is a sign
© Copyright Allianz                                       of future downside pressures on firms’ turnovers
ITALY: DEEP RECESSION EXPECTED
                                Economy under sudden stop                                                    Weakest quarters since 2009 expected
       6,0
                                                                               Forecast           70                                                                          2,0

       4,0
                                                                                                  60
                                                                                                                                                                              1,0

       2,0                                                                                        50
                                                                                                                                                                              0,0

                                                                                                  40
       0,0
                                                                                                                                                                              -1,0
                                                                                                  30
       -2,0
                                                                                                                                                                              -2,0
                                                                                                  20

       -4,0                                                                                                                                                                   -3,0
                                                                                                  10

       -6,0                                                                                        0                                                                          -4,0
                 12        13     14   15    16     17        18     19        20f     21f          2007      2009      2011       2013       2015          2017       2019

              Households        GFCF   Government    Stocks        Net Trade         real GDP                             PMI Manufacturing          BIP (q/q) (RHS)

    Sources: Refinitiv, Allianz Research                                                        Sources: Refinitiv, Allianz Research

    In 2020: major consumption shock in Q1 and Q2, while                                        With similar fall in manufacturing sentiment in March
    investment will suffer from uncertainty and funding                                         than in China, quarterly growth is expected to
    constraints due banking vulnerability. Trade balance will                                   contract sharply in H2 2020.
    deteriorate strongly due to slump in Tourism receipts.
    In 2021: rebound thanks to fiscal stimulus.
© Copyright Allianz                                                                                                                                                                  19
UK: A FULL YEAR RECESSION IN 2020, FOR THE
FIRST TIME SINCE 2009
                      Real GDP growth by component           Fiscal stimulus package and impact on real GDP growth
                                                                                and fiscal balance

       Sources: ONS, Allianz Research                                Sources: Allianz Research

    The full shock will be visible in Q2. We expect a fall   The BoE cut the key rate by 50bp to 0.25% and
    in private consumption of -1.5% qoq, -5% in business     introduced a new Term Funding scheme for SMEs of an
    investment and -6% in exports. Overall GDP would         estimated GBP100bn to support lending. It also reduced
    fall by -2.2% qoq. The recovery in 2021 will be          the countercyclical capital buffer to 0% of banks'
    capped by Brexit related uncertainty, notably in H1      exposures to UK borrowers for at least 12 months (from
    2021.                                                    1% currently and 2% planned for December 2020). In
© Copyright Allianz
                                                             addition, fiscal stimulus of EUR30bn has been announced
                                                             which will support growth by +0.2pp this year
US POLICY: A POWERFUL ARSENAL OF STABILIZATION
                         New tools of the US monetary policy                              New (proposed) tools of the US fiscal policy
                                                                                                     (size of multiplier)

                                  Government
                                                                                   •   Sending checks to households (High)
                                                                                   •   Guaranteeing paid sick leaves (High)
                                                                                   •   Giving credit guarantees to companies
                                        USD 700 bn                                     (Low)
                                        of Treasuries                              •   Allowing income tax holidays for 2020
                                        Purchases
                                                                                       (Average)
                                                                                   •   Developing infrastructure spending
USD 1.5 trillion of                                Commercial Paper Funding            (High)
liquidity injections,                              Facility (CPFF), potential to
easing of prudential
                                    Fed
                                                   activate GBCF: Government-
                                                                                   •   Increasing healthcare spending (High)
conditions                                         Backed Credit Facility          •   Authorizing loan forbearance (Average)
                                                                                   •   Providing food aid (High)
   Banks                                                                           The White House is likely to announce a fiscal package
                                                            Private
    and
                                                           economic                worth USD 1 trillion, we expect its overall multiplier size
 financial
                                                            actors                 to reach 0,9, leading to a positive impact on GDP
 markets
                                                                                   growth of 1,2 pp between 2Q 2020 and 2Q 2021
   © Copyright Allianz

                                                                                                                                                 21
EMERGING MARKETS: VULNERABILITY TO A SUDDEN
REVERSAL OF EXTERNAL FINANCING FLOWS
                   Emerging Markets: Gross external financing                                                                                                                                                               Frontier Markets: Gross external financing
                        requirement (% of FX reserves)                                                                                                                                                                            requirement (% of FX reserves)
300%                                                                                                                                                                                                 500%
                                                                                                                                                             Major oil producers                                                                                                                                                                                          Other FM

                                                                                                                                                                                                            5921%
                                                                                                                                                                                                                    3580%

                                                                                                                                                                                                                             1540%
         250%
                248%

                                                                                                                                                             Other EM                                                                                                                                                                                                     Major oil producers

                                                                                                                                                                                                                                     378%
                       216%
                              210%

                                                                                                                                                                                                     400%

200%
                                     167%

                                                                                                                                                                                                                                            260%
                                            150%

                                                                                                                                                                                                     300%
                                                   140%
                                                          138%

                                                                                                                                                                                                                                                   231%
                                                                 118%

                                                                                                                                                                                                                                                          200%
                                                                        106%

                                                                                                                                                                                                                                                                 180%
                                                                                                                                                                                                                                                                        178%
                                                                                                                                                                                                                                                                               159%
                                                                               99%

                                                                                                                                                                                                     200%
                                                                                     93%
                                                                                           89%

                                                                                                                                                                                                                                                                                      134%
                                                                                                                                                                                                                                                                                             129%
                                                                                                 79%
                                                                                                       77%

100%
                                                                                                             75%
                                                                                                                   73%

                                                                                                                                                                                                                                                                                                    106%
                                                                                                                                                                                                                                                                                                           100%
                                                                                                                         62%

                                                                                                                                                                                                                                                                                                                  88%
                                                                                                                                                                                                                                                                                                                        81%
                                                                                                                               40%

                                                                                                                                                                                                                                                                                                                              70%
                                                                                                                                     37%

                                                                                                                                                                                                                                                                                                                                    65%
                                                                                                                                           36%

                                                                                                                                                                                                                                                                                                                                          62%
                                                                                                                                                                                                     100%

                                                                                                                                                                                                                                                                                                                                                61%
                                                                                                                                                 32%

                                                                                                                                                                                                                                                                                                                                                      58%
                                                                                                                                                       32%

                                                                                                                                                                                                                                                                                                                                                            51%
                                                                                                                                                                                                                                                                                                                                                                  48%
                                                                                                                                                              25%
                                                                                                                                                                    24%
                                                                                                                                                                          19%

                                                                                                                                                                                                                                                                                                                                                                        34%
                                                                                                                                                                                                                                                                                                                                                                              29%
                                                                                                                                                                                13%

                                                                                                                                                                                                                                                                                                                                                                                    13%
                                                                                                                                                                                                                                                                                                                                                                                          11%
                                                                                                                                                                                      7%
                                                                                                                                                                                           7%
                                                                                                                                                                                                5%

                                                                                                                                                                                                                                                                                                                                                                                                5%
   0%                                                                                                                                                                                                 0%

    Sources: IHS Markit, Allianz Research                                                                                                                                                             Sources: IHS Markit, Allianz Research

    Risk appetite likely to deteriorate in markets with high                                                                                                                                          Frontier markets in Africa and CIS+ particularly
    gross external financing requirements.                                                                                                                                                            exposed to deteriorating risk appetite.

© Copyright Allianz                                                                                                                                                                                                                                                                                                                                                                                  22
EMERGING MARKETS: HIGH CORPORATE AND
SOVEREIGN DEBT POSE RISKS
       Foreign exchange-denominated sovereign and NFC                                                                                                                                                                        Currency breakdown of NFC debt (% of GDP),
             debt (% of GDP), Q3 2019, selected EM                                                                                                                                                                                      Q3 2019, selected EM
     90                                                                                              FX-denominated NFC debt                                                                                         120
                                                                                                                                                                                                                                                           LCU                        Other                               EUR                            USD
     80
                                                                                                     FX-denominated public debt                                                                                      100
     70
     60                                                                                                                                                                                                               80
     50
                                                                                                                                                                                                                      60
     40
     30                                                                                                                                                                                                               40
     20
                                                                                                                                                                                                                      20
     10
      0                                                                                                                                                                                                                 0

                                                                                                                                                                                                                                                                                                                                                               Saudi…
                                                                                                                                                                                                                                                                  South…
                                                                                                                    Saudi Arabia

                                                                                                                                                             Russia
                                                                                                                                                 Indonesia

                                                                                                                                                                                          India
                         Turkey

                                            Ukraine

                                                              Poland

                                                                                 Mexico

                                                                                                                                                                      Brazil
                                  Hungary

                                                                       Czechia

                                                                                                     South Africa
                                                      Chile

                                                                                                                                                                                                  Thailand
                                                                                                                                                                                                             China
                                                                                          Colombia
             Argentina

                                                                                                                                                                               Malaysia
                                                                                                                                   South Korea

                                                                                                                                                                                                                                                                                                                                                                        Indonesia
                                                                                                                                                                                                                                                                                               Brazil

                                                                                                                                                                                                                                                                                                                       Russia
                                                                                                                                                                                                                             Turkey

                                                                                                                                                                                                                                                                                                                                                     Ukraine
                                                                                                                                                                                                                                              Hungary

                                                                                                                                                                                                                                                                                                                                                                                                          India
                                                                                                                                                                                                                                                                           Mexico

                                                                                                                                                                                                                                                                                                        South Africa
                                                                                                                                                                                                                                      Chile

                                                                                                                                                                                                                                                                                                                                Poland

                                                                                                                                                                                                                                                                                                                                                                                    Colombia
                                                                                                                                                                                                                                                                                                                                         Argentina

                                                                                                                                                                                                                                                                                                                                                                                               Thailand
                                                                                                                                                                                                                                                        Czechia

                                                                                                                                                                                                                                                                                    Malaysia
    Sources: National statistics, IIF, Allianz Research                                                                                                                                                              Sources: National statistics, IIF, Allianz Research

    Argentina has the highest share of FX-denominated                                                                                                                                                                Turkey has the highest FX-denominated debt of
    debt to GDP (80%). And most of that is sovereign                                                                                                                                                                 NFCs in relation to GDP (36%).
    debt.

© Copyright Allianz                                                                                                                                                                                                                                                                                                                                                                                               23
THANK YOU

    Economic Research

    Global Economic Outlook
    as of March 2020

© Copyright Allianz
You can also read