The Global Economy's Shifting Centre of Gravity
←
→
Page content transcription
If your browser does not render page correctly, please read the page content below
Global Policy Volume 2 . Issue 1 . January 2011
                                                                                                                                                                   3

The Global Economy’s Shifting
Centre of Gravity
                                                                                                                           Danny Quah

                                                                                                                                                         Research Article (special section)
                                                            Economics Department, London School of Economics
                                                               and Political Science and LSE Global Governance

    Abstract
    This article describes the dynamics of the global economy’s centre of gravity, the average location of economic
    activity across geographies on Earth. The calculations here take into account all the GDP produced on this planet. The
    article finds that in 1980 the global economy’s centre of gravity was mid-Atlantic. By 2008, from the continuing rise of
    China and the rest of East Asia, that centre of gravity had drifted to a location east of Helsinki and Bucharest.
    Extrapolating growth in almost 700 locations across Earth, this article projects the world’s economic centre of gravity
    to locate by 2050 literally between India and China. Observed from Earth’s surface, that economic centre of gravity
    will shift from its 1980 location 9,300 km or 1.5 times the radius of the planet.

    Policy Implications
    • If soft power mirrors but lags economic power, then the source for global and political influence will be similarly
      gradually shifting east over the next 50–100 years.
    • Policy formulation for the entire global economy, and global governance more generally, will no longer be the
      domain of the last century’s rich countries but instead will require more inclusive engagement of the east.
    • Many global policy questions will remain the same, e.g. promoting growth in the world economy, but others might
      change in character, e.g. appropriate political and military intervention.

This article presents the dynamics of the global econ-                      the dynamics of the global economy’s centre of gravity,
omy’s centre of gravity. Studying such dynamics forms                       taking into account that that centre of gravity is typically
part of more general ongoing research on the world’s                        located in the interior of the planet.
shifting distribution of economic activity (Quah, 2010).                      I report below that the world’s economic centre of
By economic centre of gravity, I mean the average loca-                     gravity (WECG) located in 1980 at a point in the middle
tion of the planet’s economic activity measured by GDP                      of the Atlantic Ocean. By 2008, however, that centre of
generated across nearly 700 identifiable locations on the                    gravity had drifted to a location at about the same
Earth’s surface. The calculations in this article take into                 longitude as Izmir and Minsk, and thus east of Helsinki
account the entirety of GDP produced on this planet.                        and Bucharest. Of course, this change occurred not due
   Grether and Mathys (2009) have previously estimated                      to the emergence of Turkey or Belarus, but instead from
this same concept of the world economic centre of grav-                     the continuing rise of China and the rest of East Asia.
ity, focusing on large urban agglomerations. Brinkhoff                        Extrapolating growth in the 700 locations across Earth,
(2009) has presented related data on the planet’s urban                     the world’s economic centre of gravity is projected by
areas. The work here builds on Grether and Mathys’                          2050 to locate, literally, between India and China.
important contribution in two ways. First, I extend the                     Observed from Earth’s surface, that economic centre of
observations to cover GDP in all of the world’s econo-                      gravity will shift away from its 1980 location a distance
mies, constructing in each national economy a spatial                       of 9,300 km or 1.5 times the radius of the planet.
conditional average to stand in for the economic activity                     Beyond this substantive conclusion, this article contrib-
located outside the large urban agglomerations. Second,                     utes a methodological innovation. The study of earth
I formulate a cylindrical projection method to represent                    projections by geographers (e.g. Snyder, 1993) has,

Global Policy (2011) 2:1 doi: 10.1111/j.1758-5899.2010.00066.x       2011 London School of Economics and Political Science and John Wiley & Sons Ltd.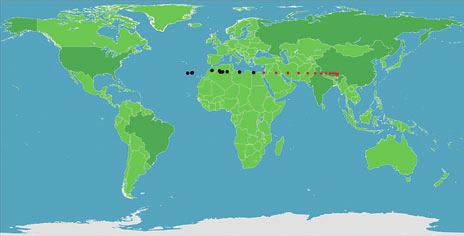
Danny Quah
4

    historically, dealt with the problem of accurately repre-                      economic centre of gravity would be exactly halfway
    senting on a two-dimensional map locations and shapes                          between Beijing and New York. And that centre would
    that rest on the surface of a curved three-dimensional                         show exactly zero economic activity. In this example,
    sphere. The subject matter is extensive but the critical                       there are two clusters – one in Beijing, the other in New
    result is that no perfect representation exists (Gauss’s                       York – but only one centre, precisely midway between
    Theorema Egregium). No one representation can be                               them. Indeed, in general, as the centre is the average,
    necessarily more accurate than all the others in every                         there can only ever be one centre. Each of the different
    characteristic of interest. This study seeks to represent                      concepts contains useful information. Therefore, the
    on to the same two-dimensional map not just the usual                          WECG given here holds interest because it shows ten-
    points on the Earth’s surface but locations and trajecto-                      dencies – the sharp eastward drift of economic activity
    ries that penetrate the surface of that three-dimensional                      as Beijing grows faster than New York – not because
    sphere and tunnel into the sphere’s interior. Therefore,                       that central location is where everyone should seek their
    the mathematical problem is at least as intricate as that                      economic fortunes. For the latter, the appropriate con-
    for the standard Earth projection, and the same impossi-                       cept is clustering, not the centre of gravity. Indeed, in
    bility result implies that no representation can be ideal                      the example I have just given, as long as Beijing and
    in every possible way. Instead, what this article does is                      New York remain equal, a business would wish to locate
    propose and apply a projection (or distance-minimising)                        as far as possible from the centre of gravity.
    technique to describe on a two-dimensional map the
    world’s economic centre of gravity.
                                                                                   1. Motivation
       Aside from the representation problem, the equations
    for calculating a spatial weighted average – as for calcu-                     Typical cross-country studies of income dynamics deduce
    lating any weighted average – are of course invariant                          parameters from the cross-sectional variation to help
    and unique, and thus in this article are necessarily the                       assess the causes of economic growth. Such analyses
    same equations exactly as appear in Grether and Mathys                         hypothesise a representative or average economy in
    (2009). In this direction, the current article only furthers                   whose properties the researcher is interested. This study,
    that line of analysis initiated in Grether and Mathys                          by contrast, takes its principal concern to be the
    (2009) by adding a set of observations to pick up the                          dynamic behaviour of the entire spatial distribution of
    global economy located outside urban agglomerations:                           economic activity. The mean of that spatial distribution
    the Grether and Mathys study considered only that part                         of income across the planet is the global economy’s
    of the global economy within urban agglomerations. I                           centre of gravity. I focus on that mean because it is a
    follow Grether and Mathys in ascribing a constant per                          convenient and tractable representation of that distribu-
    capita income across urban agglomerations within a                             tion, not because of any inherent interest in the repre-
    national economy. However, I also hypothesise a positive                       sentative or average economy.
    but lower per capita income in the areas outside those                            Why do this? There are two large sets of reasons, both
    urban agglomerations. Grether and Mathys, by contrast,                         concerning the dynamics of the distribution of incomes
    impute zero incomes for those (rural) areas.                                   across economies. A first is that understanding the
       While it might be tempting as a result to say that                          changing income distribution across economies gives
    what I do here improves or makes more precise the esti-                        insight into the future evolution of global inequality
    mation of the world’s economic centre of gravity, I think                      more generally (e.g. Held and Kaya, 2006; Milanovic,
    it would be more useful to consider my estimates as sim-                       2005; Quah, 2003) and thus of global justice and the
    ply being different, in substance, from those in Grether                       state of humanity.
    and Mathys. Since what we seek to estimate is unknown                             A second set of reasons is that such understanding
    and unmodelled it is not possible to say which of our                          provides critical input into another wide-ranging group
    estimates is more precise or more reasonable. Compar-                          of questions across the social sciences. Among these are
    ing their table 1 and their figure 1 with Figure 2 and its                      questions surrounding the rise of the BRICs (Goldman
    table in this article cannot determine whose estimates                         Sachs Global Economics Group, 2007); the emergence of
    should be preferred. Reassuringly, however, our substan-                       Asia (Mahbubani, 2008); the relative decline of the
    tive conclusions remain the same although of course the                        world’s established global powers (Cox, 2007); the evolu-
    details will differ.                                                           tion of the world’s reserve currency and, more broadly,
       Finally, the world’s economic centre of gravity should                      change in the global monetary system (Chinn and
    not be confused with a concept of clustering of world                          Frankel, 2008); and the evolving global distribution of
    economic activity. To see this difference, suppose for                         soft power (Nye, 2004). Such issues can be addressed
    instance that the world only had two locations, say                            only by modelling the entire cross-country distribution
    Beijing and New York, and these two places shared                              of economic and political activity, not by analysing a
    equal amounts of economic activity. Then the world’s                           hypothetical representative economy.

     2011 London School of Economics and Political Science and John Wiley & Sons Ltd.                                     Global Policy (2011) 2:1
Global Economy’s Centre of Gravity
5
2. Calculations would then no longer hold. However, nothing essential
changes in the calculations.) Denote the collection of all
I took, to begin, national GDP figures adjusted for pur-
urban agglomerations and rural proxies:
chasing power parity (World Bank, 2010) augmented
with data for Taipei China (Asian Development Bank,
ffðiÞ : i ¼ 1; 2; . . . ; Ng:
2008). This provided 210 data points per year. Then I
used Google Earth to determine the geographical loca- For W the measure of economic activity of interest, here
tions of every urban agglomeration on the planet having income, the world’s economic centre of gravity is that
2009 populations exceeding 1 million (Brinkhoff, 2009 point f 2 e such that
and Grether and Mathys, 2009 have previously also dis-
cussed and presented data on those locations). This gave XN XN
483 urban agglomerations on Earth. Some nation econo- f ¼ i¼1
W ðiÞ fðiÞ = i¼1
W ðiÞ
mies have no such agglomeration, others many: for
example, China had 79; India, 48; the US, 54. < R, that is, this centre of gravity lies within
Typically, jfj
To add to this collection, using Google Earth again the Earth’s volume, not on its surface.
but now together with uniform spatial averaging, I When f = (fx, fy, fz) is an urban agglomeration that
located the point average across geographical extent in rests on the planet’s surface and has latitude u and lon-
each of the 210 nation economies. This gave for each gitude k measured in radians, the Cartesian coordinates
nation economy a single point proxying for the rural relate to latitude and longitude by:
(non-urban) geography. Altogether, these 483 urban
agglomerations and 210 rural proxies provided 693 iden- fx ¼ R cos u cos k
tifiable locations on Earth.
Following Grether and Mathys (2009) I allocated fy ¼ R cos u sin k
national income across locations so that all urban fz ¼ R sin u:
agglomerations within a nation economy had equal per
capita income. I assigned per capita income in the The easiest way to understand this calculation is to pro-
remainder of the nation economy to be 10 per cent ject a point f on to the equatorial plane and then to
lower than in the urban agglomerations. This last step decompose that projection along x and y coordinates in
diverges from Grether and Mathys (2009), who omitted that plane.
all geographies outside urban agglomerations. Put The latitude and longitude of any f = (fx, fy, fz), not
another way, Grether and Mathys (2009) applied a rural necessarily on the planet’s surface, can be recovered as:
discount of 100 per cent. I experimented with varying
this rural discount between 0 per cent and 40 per cent
u ¼ sin1 ðfz =jfjÞ and k ¼ tan1 ðfy =fx Þ ð1Þ
with almost imperceptible change in the end results.
A more extensive study might attempt to model
rural–urban income dynamics more carefully, and with its distance from the physical centre of the planet
analyse changes in spatial locations as cities emerge or given by jfj ¼ ðf2x þ f2y þ f2z Þ1=2 .
vanish. I do not pursue such extensions here. Given the data used in this article, the resulting WECG
To summarise, I took 693 locations to represent the spa- turns out to be well beneath the surface of the planet.
tial distribution of all the economic activity on Earth. Tracking the dynamics of such subterranean locations is
Tracking incomes in these locations over time gives a rep- not straightforward.
resentation of the spatial distribution dynamics of global On a two-dimensional map any point on the Earth’s
economic activity. At any given point in time, calculating surface bears a unique configuration relative to the
the three-dimensional weighted average across the 693 usual landmarks of coastlines, cities and mountains. That
locations yields the WECG. Take the approximation that property fails, however, for points beneath the surface
Earth e is exactly spherical with radius R and that a location of the three-dimensional planet. To see this, suppose
for economic activity is a point on the three-dimensional that some sequence of points inside the planetary
Earth’s surface. Written in Cartesian coordinates, sphere has an east-to-west trajectory when viewed from
one perspective. But when viewed from the other side
1 of the planet that same sequence will instead traverse
f ¼ ðfx ; fy ; fz Þ with jfj ¼ ðf2x þ f2y þ f2z Þ2 ¼ R: west to east. Since any given perspective is arbitrary in
three-dimensional space, without further justification for
(In future, with ongoing scientific progress, locations for fixing a viewing position, no discussion of the centre of
economic activity might be off the Earth’s surface – gravity moving east (or west) can draw a compelling
whether above or below – so that the last equality conclusion.
Global Policy (2011) 2:1 2011 London School of Economics and Political Science and John Wiley & Sons Ltd.Danny Quah
6
Figure 1. Calculating the cylindrical projection. radius) beneath the surface of the Atlantic Ocean. Along
North Pole
the east–west axis, this location is between Iceland and
Brazil. Intuitively, the 1980 WECG sat between North
America and Western Europe because most of the
world’s economic activity then occurred in just those
two geographies.
Latitudinal projection At 66 degrees North relative to the equatorial plane,
0.56 Er the WECG might seem to be as far north as Iceland.
ϕ However, measured along the north–south axis, the
WECG – because it is so deep beneath the planet’s sur-
face – turns out to be only 3,200 kilometres north of the
equator, approximately the same distance north as
Austin, Texas, Tel Aviv or Shanghai.
This account just given suggests a way to describe the
dynamics of the WECG while preserving visual intuition,
as described briefly at the end of the previous section.
Project the WECG onto the Earth’s surface by locating
Note: When the WECG is 0.56 Earth’s radius from the physical
centre, its latitude u makes it appear much further north than it both the WECG and its surface projection on the straight
actually is. The cylindrical projection realigns perspective appropri- line that minimises the distance between Earth’s north–
ately and, by virtue of being a (distance-minimising) projection, south axis and a cylinder tangent to the equator.
locates the closest point on the planet’s surface to the WECG. Roughly speaking, the projection is that point on the
Earth’s surface that someone would be looking at when
Related to this ambiguity, latitudinal and longitudinal they fix their eyes on the north–south axis while encir-
information for subterranean points can be visually mis- cling Earth on the equatorial-tangent cylinder, and the
leading. For instance, a point close to the Earth’s physi- WECG just comes into view. (And that observer is
cal centre but only a little distance north will have a hypothesised to be able to look only orthogonally from
relatively large latitudinal measure. This last will make the surface of the cylinder.)
that location appear much closer to the North Pole Figure 2 shows the shifting WECG at three-year inter-
when it is compared with other locations the same dis- vals between 1980 and 2007 in the historical sample,
tance north of the equatorial plane but which them- and then extrapolated forwards to 2049. I calculated the
selves rest on the planet’s surface (Figure 1). These WECG beyond 2008 by fitting exponential trends individ-
anomalies arise from deeper technical difficulties in ually for each of the nearly 700 geographical locations,
projecting the three-dimensional Earth on to a two- and then re-estimating the WECG each year between
dimensional flat map. In contrast, previous mapping 2009 and 2049. Along with Figure 2, I also provide a
analyses (Snyder, 1993) have only ever considered table containing longitude, latitude and radial distance
projecting points on the Earth’s surface, not locations of each of these WECGs, as well as the latitude of the
deep underground. cylindrical projection on to the planet’s surface: these
To minimise this visual misperception and ambiguity, are the numbers used in the figure.
the maps I present will depict, when indicated, a WECG To emphasise again, in this construction, Figure 2
mapped on to the Earth’s surface by projecting from the shows the sequence of WECGs not from a single fixed
planet’s north–south axis to the cylindrical surface tan- perspective. Instead each point in Figure 2 is from one
gent at the planet’s equator. Again, see Figure 1. It element in a sequence of perspectives that track the
might seem that such cylindrical projection necessarily WECGs as the latter traverse their trajectory.
exaggerates movement in the WECG. A counterexample, By 2008 the WECG had drifted to a location 27
however, confirms it does not. Suppose the shifting degrees East and 74 degrees North (surface projected,
distribution of global economic activity pulls the WECG 31 degrees North). Viewed from the tangent cylinder,
further into the planet’s interior but directly toward the 2008’s WECG appeared just south of Izmir, Turkey, on
north–south axis: then the WECG’s cylindrical projection the same longitude as Minsk and Johannesburg. Over
registers zero variation whereas, in reality, the physical the quarter of a century since 1980, the WECG has trav-
movement can be considerable. elled 1,135 km (18 per cent of Earth’s radius) through
three-dimensional space. Its surface projection – that dis-
tance perceived in Figure 2 – moved 4,800 km or 75 per
3. Results
cent of Earth’s radius across the surface of the planet
In 1980 the WECG located 24 degrees West and 66 from its 1980 location in the middle of the Atlantic
degrees North, but 2,800 kilometres (almost half Earth’s Ocean.
2011 London School of Economics and Political Science and John Wiley & Sons Ltd. Global Policy (2011) 2:1Global Economy’s Centre of Gravity
7
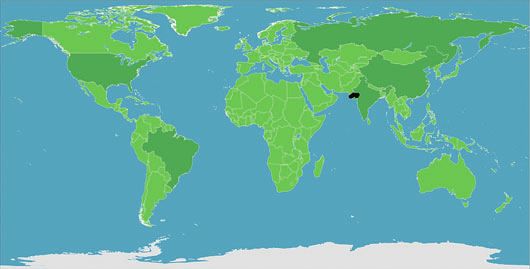
Figure 2. The world’s economic centre of gravity, 1980–2007 (black) and extrapolated (in red, reduced size, italicised in table), at
three-year intervals.
Year Latitude Projected Longitude Radial
(degrees) Latitude (degrees) Distance
(degrees) (Earth’s
radius)
1980 66 31 −24 0.56
1983 68 31 −21 0.56
1986 69 31 −21 0.55
1989 72 33 −6 0.57
1992 73 32 0 0.56
1995 73 32 3 0.55
1998 73 32 1 0.55
2001 74 32 6 0.55
2004 74 32 16 0.55
2007 73 31 27 0.54
2010 73 31 35 0.54
2013 72 31 44 0.54
2016 71 31 53 0.54
2019 69 31 62 0.55
2022 66 31 69 0.56
2025 64 31 75 0.57
2028 61 31 79 0.58
2031 58 31 83 0.60
2034 55 31 86 0.62
2037 52 31 88 0.64
2040 50 31 90 0.66
2043 48 30 91 0.69
2046 46 30 92 0.71
2049 44 30 92 0.72
Source: Author’s calculations.
Global Policy (2011) 2:1 2011 London School of Economics and Political Science and John Wiley & Sons Ltd.Danny Quah
8
Figure 3. Flat world’s economic centre of gravity, 1980–2007.
Source: Author’s calculations.
Note: Karachi is the nearest large city to either 2007’s or 1980’s WECG.
Some readers have suggested that the WECG’s east- 30 degrees North. That location is no large city precisely
ward movement is simply an artefact of a Euro- but surrounding it are Urumqi, China, Kolkata, India,
Asia-centric perspective. Had we viewed this same Dacca and Chittagong, Bangladesh and Mandalay, Myan-
sequence of points from the Pacific Ocean instead, the mar. In this extrapolation, by 2050 the WECG will shift in
traversal would be westward. However, locating the three-dimensional space 4,250 km, or two-thirds of the
map’s perspective in the Pacific Ocean would not trace Earth’s radius. Its surface projection will move 9,300 km,
out the cylindrical projection – which, recall, is defined or 1.5 times Earth’s radius eastward across the surface of
to be a distance-minimising mapping. the planet.
Another striking feature of Figure 2 is how the WECG The forecast limit point is close to what the WECG
seems to move so rigidly along a given latitude, that is, would be if the world were flat, that is, when per capita
visually horizontally in the map. Does this imply that the incomes equalise everywhere. (This uses the same evoca-
north–south divide will remain invariant, so that even as tive phrasing but is obviously a drastic simplification of
the south grows, so too does the north? themes developed in Friedman (2006).) Such a flat-world
To address this point, look at the table following centre of gravity is arithmetically identical to a spatial
Figure 2. That shows the actual latitude of the WECG average using population rather than income as weights
in its second column. Notice that that latitude declines for each location: Grether and Mathys (2009) presented
from 66 degrees North to 44 degrees North by 2049. exactly the same calculation and referred to it as the
This might seem to imply that the south, like the east, demographic centre of gravity. While the calculation is,
is actually gaining considerable relative economic obviously, the same, their and my interpretations
strength. differ for this location. In my description, I consider this
However, at the same time, the radial distance of the flat-world centre of gravity to hold interest because it
WECG from the centre of the earth has risen, from 0.56 describes a possible future when per capita incomes
to 0.72 of the planet’s radius. Therefore, the WECG is equalise. For Grether and Mathys (2009) the interest lies
percolating up to the surface of the planet. These two in how this location is the geographical centre of the
tendencies imply that when viewed from the surface of world’s population. Figure 3 shows the flat world’s WECG
the planet, there is little north–south movement. in 2009 located 68 degrees East and 38 degrees North
To visualise this, consider drawing a circle around the (surface projected, 23 degrees North), close by Karachi.
Earth at about 30 degrees North on the planet’s surface. The WECG under this definition obviously does evolve
Then slice that circle right into the interior of the planet. through time but the variation – whether historical or
What Figure 2 shows is that the WECG remains on that extrapolated (not shown) – is minimal relative to that in
slice even though drifting toward the planet’s surface. Figure 2.
I interpret this to mean that the north–south divide
remains constant, and thus Figure 2 correctly illustrates
Conclusions
the reality.
By 2049 the surface-projected WECG is forecast to This article has documented the dynamics of the world’s
approach a limit point around 92 degrees East and economic centre of gravity. The results show that such a
2011 London School of Economics and Political Science and John Wiley & Sons Ltd. Global Policy (2011) 2:1Global Economy’s Centre of Gravity
9
centre of gravity began in the mid-Atlantic in 1980, Cox, M. (2007) ‘Still the American Empire’, Political Studies Review,
reflecting how most of the world’s economic activity 5 (1), pp. 1–10.
Friedman, T. L. (2006) The World is Flat, second edition. London:
then occurred in either North America or Western
Penguin.
Europe. Goldman Sachs Global Economics Group (2007) BRICs and Beyond.
Since 1980, however, the historical evidence has London: Goldman Sachs.
implied a profound eastward shift in economic activity. Grether, J.-M. and Mathys, N. (2009) ‘Is the World’s Economic Centre
In 2008 the world’s economic centre of gravity had of Gravity Already in Asia?’, Area, 42, pp. 47–50.
moved close to Izmir, thus having been pulled 4,800 km Held, D. and Kaya, A. (2006) Global Inequality: Patterns and Explana-
(75 per cent of the Earth’s radius) eastward across the tions. London: Polity Press.
Mahbubani, K. (2008) The New Asian Hemisphere: The Irresistible Shift
surface of the planet. Extrapolating to 2050, the global
of Global Power to the East. New York: Public Affairs.
economy’s centre of gravity will continue to shift east to Milanovic, B. (2005) Worlds Apart: Measuring Global and International
lie between India and China. Measured on the planet’s Inequality. Princeton, NJ: Princeton University Press.
surface this will be a shift since 1980 of 9,300 km, or 1.5 Nye, J. S. (2004) Soft Power: The Means to Success in World Politics.
times the radius of the Earth. New York: Public Affairs.
Quah, D. (2003) ‘One Third of the World’s Growth and Inequality’,
in T. Eicher and S. J. Turnovsky (eds), Growth and Inequality:
Note Issues and Policy Implications. Cambridge: MIT Press, pp. 27–
58.
I thank Michael Cox, Jean-Marie Grether, David Held, Nicole Mathys,
Quah, D. (2010) ‘The Shifting Distribution of Global Economic
Stryker McGuire, Eva-Maria Nag and Alastair Newton for discussions
Activity’. Working Paper, Economics Department, London School
leading to this article. Two anonymous referees provided extremely
of Economics.
helpful comments.
Snyder, J. P. (1993) Flattening the Earth: Two Thousand Years of Map
Projections. Chicago, IL: University of Chicago Press.
References World Bank (2010) World Development Indicators Online, April.
Available from: http://data.worldbank.org/data-catalog/world-
Asian Development Bank (2008) Key Indicators for Asia and the Paci- development-indicators/wdi-2010 [Accessed 21 July 2010].
fic 2008. Manila: Asian Development Bank.
Brinkhoff, T. (2009) The Principal Agglomerations of the World
[online], October. Available from: http://www.citypopulation.de Author Information
[Accessed 6 October 2009].
Professor Danny Quah, Economics Department, London School of
Chinn, M. and Frankel, J. (2008) ‘Why the Euro will Rival the Dollar’,
Economics and Political Science and LSE Global Governance.
International Finance, 11 (1), pp. 49–73.
Global Policy (2011) 2:1 2011 London School of Economics and Political Science and John Wiley & Sons Ltd.You can also read