Jyske Bank Q1 2021 4 May 2021 - Information for investors and financial ...
←
→
Page content transcription
If your browser does not render page correctly, please read the page content below

Jyske Bank Q1 2021 4 May 2021

Summary
                              Q1 2021

Summary                 02
Financials              11
Volumes                 18
Jyske Bank in brief     22
Macroeconomics          26
Calendar and contacts   30
Financial results
Net profit of DKK 883m and return on equity of 10.0% in Q1 2021 Income statement and key figures (DKKm)
Q1 Q1 Index Q4 Index
Net interest income 0% y/y. Reduced deposit rates counteracted lower 2021 2020 y/y 2020 q/q
bank lending and sale of Jyske Bank (Gibraltar). Net interest income 1,224 1,228 100 1,195 102
Net fee and commission income -11% y/y due to lower performance fees, Net fee and commission income 576 650 89 581 99
lower remortgaging activity as well as the sale of Jyske Bank (Gibraltar).
Value adjustments 362 -113 - 278 130
Value adjustments of DKK 362m – the highest level in five years – due to Other income 33 30 110 38 87
interest rate curve steepener exposure and high activity levels.
Income from operating lease 40 8 500 34 118
Core expenses -13% y/y and -6% y/y on an underlying basis due to 7% Core income 2,235 1,803 124 2,126 105
lower FTE’s, an intensified cost focus and less travelling amid COVID-19.
Core expenses 1,171 1,346 87 1,179 99
Loan impairment charges of DKK 10m, as NPL share reached all-time low
Core profit before loan impairment charges 1,064 457 233 947 112
with a continued broad-based positive development in credit quality.
Loan impairment charges 10 1,003 1 5 200
Investment portfolio earnings of DKK 75m from interest rate curve
steepener exposure and FX positions. Core profit 1,054 -546 - 942 112
Investment portfolio earnings 75 -450 - 157 48
Pre-tax profit 1,129 -996 - 1,099 103
Return on equity Q1 2020 vs. Q1 2021
20% Tax 246 -216 - 268 92
+20pp y/y
15% Net profit for the period 883 -780 - 831 106
Earnings per share (DKK) 11.6 -11.1 - 10.9 107
10%
Return on equity (ann.) 10.0% -10.3% - 9.6% 104
5%
Cost/income ratio 52.4% 74.7% 70 55.5% 94
0%
Capital ratio 23.2% 21.5% 108 22.9% 101
-5%
CET1 ratio 18.0% 16.7% 107 17.9% 100
-10%
Mortgage lending (nominal) 334,559 331,120 101 333,056 100
-15%
ment charges
Net interest
Core expenses
Other income
Income from ope-
Net fee and com-
adjustments
Investment port-
Q1'20
Q1'21
Tax, AT1 etc.
Bank loans (excl. repo) 73,055 79,636 92 73,043 100
Loan impair-
rating lease (net)
mission income
folio earnings
income
Value
New home loans 2,519 3,360 75 2,646 95
Leasing 20,406 19,589 104 19,879 103
Deposits (excl. repo) 126,487 131,215 96 127,461 99
3
Highlights

             Continued strong financial performance
             Highest EPS since 2014 merger in last year; 2021 net profit outlook raised 19% from outset

             Core income up 24% y/y
             High activity levels in capital and property markets supplemented several income initiatives

             Core expenses reduced 13% y/y
             Reduction of staff and branches progressing according to plan amid intensified cost focus

             All-time strong credit quality
             Record low NPL share;impairment charges expected to be at very low level in 2021

             Record-high capital ratios
             Ample capital ensuring high payout capacity; share buy-backs of DKK 750m ongoing

                                                                                                            4
Continued strong financial performance
Highest EPS since merger in last year; 2021 profit outlook +19% from outset

Earnings per share (DKK)
 45

 40

 35

 30

 25

 20

 15

 10

  5

  0
         2015         2016            2017   2018         2019           2020      Last four
                                                                                   quarters
                 Earnings per share            Impact from COVID-19 provisioning

                                                                                               5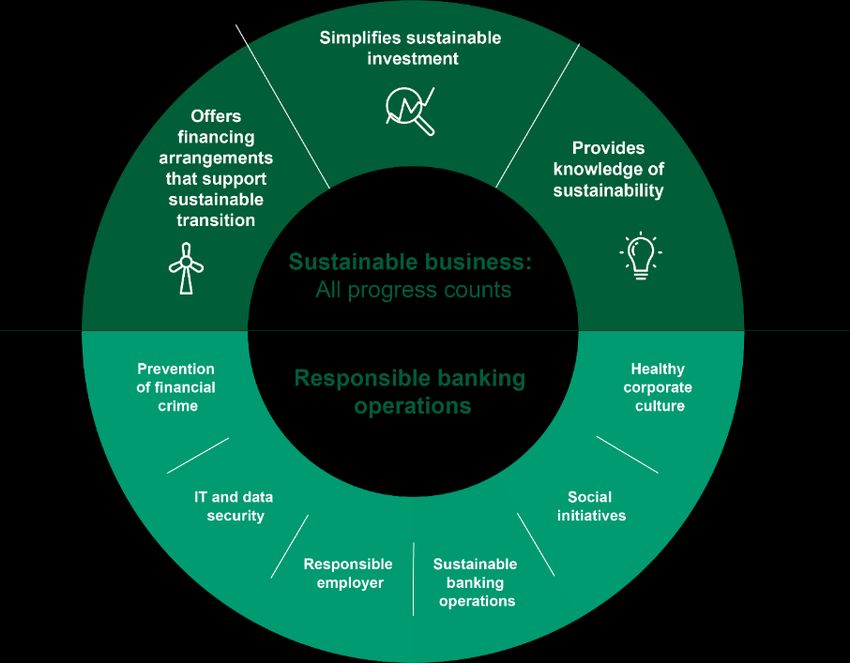
Core income up 24% y/y
High activity in capital and property markets supplemented income initiatives

Core income (DKKm)

2,400
2,200
2,000
1,800
1,600
1,400
1,200
1,000
 800
 600
 400
 200
   0
 -200
           Q2'19         Q3'19   Q4'19         Q1'20       Q2'20             Q3'20       Q4'20      Q1'21
        Net interest income              Net fee and commision income           Value adjustments

        Other income                     Income from operating lease (net)

                                                                                                            6
Core expenses reduced 13% y/y
Reduction of staff and branches on schedule amid intensified cost focus
Core expenses (trailing four quarters, DKKm)
5,200
5,100
5,000
4,900
4,800
4,700
4,600
4,500
4,400
Q2'19 Q3'19 Q4'19 Q1'20 Q2'20 Q3'20 Q4'20 Q1'21
7All-time strong credit quality
Record low NPL share; impairment charges to be at very low level in 2021
Non-performing loans (net) as % of loans, advances and guarantees
1.6%
1.4%
1.2%
1.0%
0.8%
0.6%
0.4%
0.2%
0.0%
Q2'19 Q3'19 Q4'19 Q1'20 Q2'20 Q3'20 Q4'20 Q1'21
8Ample capital ensuring high payout capacity
DKK 750m share buy-back ongoing with capital ratios at all-time high levels
Capital ratio
24%
22%
20%
18%
16%
14%
12%
10%
8%
6%
4%
2%
0%
2015 2016 2017 2018 2019 2020 Q1'21
Common Equity Tier 1 Additional Tier 1 Tier 2
9Outlook
Earnings per share (DKK)
Bank lending and mortgage lending to
Volumes
increase in 2021
2021E
2020
Core income Around the same level as in 2020
2019
2018
Core expenses Lower in 2021 than 2020 level
2017
2016
Loan impairment
Very low level in 2021 2015
charges
2014
Net profit DKK 2.3bn-2.7bn in 2021 2013
2012
CET1 ratio of 15%-17% and capital ratio of 2011
Capital
20%-22% for the coming years
0 5 10 15 20 25 30 35 40
10Financials
Q1 2021
Summary 02
Financials 11
Volumes 18
Jyske Bank in brief 22
Macroeconomics 26
Calendar and contacts 30Net interest income up 2% q/q amid higher lending volumes
Net interest income (NII) Net interest income Q1 2020 vs. Q1 2021 (DKKm)
1,300
NII 0% y/y as reduced deposit rates compensated for lower bank lending 0% y/y
• Core NII unchanged, as reduced deposit rates for private and corporate 1,280
clients offset negative impact from lower bank lending and mix effects. 1,260
• Other NII down due to sale of Jyske Bank (Gibraltar) as well as T2 and
1,240
NPS issues.
1,220
NII +2% q/q due to increased lending volumes and higher other NII
1,200
• Core NII unchanged despite two fewer days of interest, as lending
volumes increased in all segments and deposit rates declined. 1,180
• Other NII up, mainly due to higher NII from trading and excess liquidity. 1,160
• DKK -19m from one-off and from accruing paid commissions under 1,140
leasing activities with effect from 1 January 2020 booked in Q4 2020.
1,120
Zero interest threshold on private clients’ deposits DKK 100K from 1 April. Q1'20 Lending Lending Deposit Deposit Days Other Q1'21
Corporate deposits rates lowered to -0.95% from -0.75% as of 11 June. volumes rates/mix volumes rates/mix
Net interest income (DKKm) Net interest income Q4 2020 vs. Q1 2021 (DKKm)
1,500 Total: 0% y/y 1,260
+2% q/q
Core: +0% y/y
1,300 1,240
1,100
1,220
900
1,200
700
500 1,180
300
1,160
100
1,140
-100
Q2'19 Q3'19 Q4'19 Q1'20 Q2'20 Q3'20 Q4'20 Q1'21
Bank lending (excl. repo) Administration margin income etc. 1,120
Leasing Deposits (excl. repo, triparty) Q4'20 Lending Lending Deposit Deposit Days Other Q1'21
Other net interest income volumes rates/mix volumes rates/mix
Note: Core net interest income is net interest income from lending and deposits. Other net interest income relates to e.g. funding, capital and liquidity management and trading activities. 12Net fee income supported by high activity levels
Net fee and commission income (NFCI) Net fee and commission income Q1 2020 vs. Q1 2021 (DKKm)
700
NFCI -11% y/y due to performance fees and Jyske Bank (Gibraltar) sale -11% y/y
• Performance-related fee income declined from DKK 67m to DKK 7m.
650
• Negative impact from sale of Jyske Bank (Gibraltar) of approx. 2%.
• Covered bond issuance increased fee expenses, while changes to the 600
fee structure supported fee income.
550
• Lower remortgaging partly offset by higher mortgage loan applications.
NFCI -1% q/q as high activity helped offset seasonality and Q4 one-off 500
• Seasonally lower securities trading and safe-custody fees were partly
450
offset by seasonally higher Letpension fees and refinancing activity.
Other fees and
Mortgage fees
commission
commission
and safe-custody
Money transfers
Q1'20
Loan application
Q1'21
Performance fees
Securities trading
Guarantee
card payments
commissions
expenses
Fee and
• High activity levels within capital and property markets.
services
fees
and
• Positive effect of DKK 46m from accruing paid commissions under
leasing activities with effect from 1 January 2020 booked in Q4 2020.
Net fee and commission income decomposed (DKKm) Net fee and commission income Q4 2020 vs. Q1 2021 (DKKm)
900 700
-11% y/y -1% q/q
800
700 650
600
600
500
400 550
300
200 500
100
450
0
Mortgage fees
commission
Other fees and
commission
and safe-custody
Money transfers
Q4'20
Loan application
Q1'21
Performance fees
Securities trading
Guarantee
card payments
commissions
expenses
Fee and
Q2'19 Q3'19 Q4'19 Q1'20 Q2'20 Q3'20 Q4'20 Q1'21
services
fees
Securities trading and safe-custody Performance fees
and
Mortgage fees Loan application fees
Money transfers and card payments Guarantee commission
Other fees and commissions Net fee and commision income
13Positive effect from interest rate curve steepener exposure
Value adjustments and investment portfolio earnings Value adjustments (DKKm)
Value adjustments of DKK 362m in Q1 2021 500
+475m y/y
• High activity levels amid a positive development in financial markets, 400
although option-adjusted spreads on Danish mortgage bonds widened.
300
• Positive contribution from strategic balance and risk management given
200
interest rate curve steepener exposure.
• Significant impact from ACVA and clients’ swaps due to higher long- 100
term interest rates. 0
Investment portfolio earnings of DKK 75m in Q1 2021 -100
• Interest rate curve steepener exposure and FX positions outweighed -200
effect of widening option-adjusted spreads on Danish mortgage bonds.
-300
• FX hedging of AT1 issues in SEK had a negative P/L impact of DKK 30m, Q2'19 Q3'19 Q4'19 Q1'20 Q2'20 Q3'20 Q4'20 Q1'21
counteracted by an equivalent adjustment of shareholders’ equity. Underlying (incl. sector shares) Strategic bal. and risk mgmt. Other (CVA/DVA etc.)
Investment portfolio earnings (DKKm) OAS on Danish mortgage bonds widened in Q1 2021 (bp)
300 -15
+525m y/y
200 -10
100
-5
0
0
-100
5
-200
10
-300
15
-400
-500 20
Q2'19 Q3'19 Q4'19 Q1'20 Q2'20 Q3'20 Q4'20 Q1'21 Q2'19 Q3'19 Q4'19 Q1'20 Q2'20 Q3'20 Q4'20 Q1'21
Investment portfolio earnings AT1 FX hedging 3-year fixed-rate Danish mortgage bonds vs. CIBOR 3M (bp, q/q, inverted axis)
14Core expenses down 13% y/y amid intensified cost focus
Core expenses Core expenses Q1 2020 vs. Q1 2021 (DKKm)
1,400
Core expenses -13% y/y and -6% y/y on an underlying basis -13% y/y
• Excluding DKK 102m related to the operations and sale of Jyske Bank
1,350
(Gibraltar) in Q1 2020, core expenses declined 6% y/y.
• FTE’s reduced by 7% y/y and 26% since Jyske Realkredit merger in 2014.
1,300
• Broad-based reduction of operating expenses from intensified cost
focus, underpinned by less travelling etc. due to COVID-19 pandemic. 1,250
Core expenses -1% q/q due a lower number of FTE’s
1,200
• Number of FTE’s down by 141 since Q2 2020 and 1% in Q1 2021,
reflecting targeted reduction of 150-200 from mid-2020 to mid-2021.
1,150
• IT expenses increased slightly compared with the preceding quarter.
• Slightly lower expenses from prolonged COVID-19 restrictions. Q4 saw 1,100
lower provisions for court cases and higher employee-related provisions. Q1'20 Employees IT Other Q1'21
Core expenses (DKKm) and full-time employees Core expenses Q4 2020 vs. Q1 2021 (DKKm)
1,600 3,800 1,200
-13% y/y -1% q/q
1,400 3,700
1,190
1,200 3,600
1,000 3,500 1,180
800 3,400
1,170
600 3,300
400 3,200 1,160
-7% y/y
200 3,100
1,150
0 3,000
Q2'19 Q3'19 Q4'19 Q1'20 Q2'20 Q3'20 Q4'20 Q1'21
1,140
Employees IT Other Full-time employees (ra.)
Q4'20 Employees IT Other Q1'21
15Credit quality remains solid with NPL ratio at all-time low
Credit quality Cost of risk (bp)
Loan impairment charges of DKK 10m, 0bp cost of risk, in Q1 2021 25
-20bp y/y
• Continued broad-based positive development in credit quality,
20
especially within agriculture.
• Supported by strong property market as well as low level of bankruptcies 15
and unemployment claims amid deferred VAT and tax payments.
10
Balance of impairment charges down 12bp y/y to 1.1%
• 0.5% for mortgage activities and 3.5% (excl. repo) for banking/leasing. 5
• Management’s estimate of DKK 1,272m, down DKK 337m y/y due to
0
individualization of initial COVID-19 management’s estimate.
Non-performing loans declined 24bp y/y to a record low of 1.0% -5
Q2'19 Q3'19 Q4'19 Q1'20 Q2'20 Q3'20 Q4'20 Q1'21
• Share of loans subject to forbearance measures 1.6%. 90-day mortgage Cost of risk
arrears for private and corporate clients 13bp and 4bp, respectively.
Non-performing loans as % of loans, advances and guarantees Impairment charges as % of gross loans, adv. and guarantees
1.6% 1.4%
-24bp y/y -12bp y/y
1.4% 1.2%
1.2%
1.0%
1.0% 2,0% 2,1% 2,1%
2,0% 0.8%
1,9% 1,8% 2,7% 2,7%
0.8% 2,5% 2,4% 2,3%
1,6% 1,6%
0.6% 2,5% 2,5% 2,5%
0.6%
0.4%
0.4%
1,1% 1,0% 1,0% 0,9% 0,8%
0,8% 0,8% 0,7% 0.2%
0.2% 0,5% 0,5% 0,5% 0,5% 0,5%
0,3% 0,3% 0,3%
0.0% 0.0%
Q2'19 Q3'19 Q4'19 Q1'20 Q2'20 Q3'20 Q4'20 Q1'21 Q2'19 Q3'19 Q4'19 Q1'20 Q2'20 Q3'20 Q4'20 Q1'21
Mortgage Banking, Leasing Mortgage Banking, Leasing
16Solid capital and liquidity position
Comments on capital position and capital distribution Capital ratios and capital requirements
Capital ratio of 23.2% and CET1 ratio of 18.0% (+0.3pp and +0.1pp q/q) 26%
+1.7pp y/y
24%
• Positive earnings impact and tier 2 issues, partly offset by higher REA.
22%
• Targeting 20%-22% capital ratio and 15%-17% CET1 ratio for the 20%
coming years. Capital requirement 15.6%, CET1 requirement 10.6%. 18%
16%
• Ongoing share repurchase programme of DKK 750m running as from 28
14%
January 2021 and up to and including 30 September 2021 at the latest.
12%
Risk exposure amount +2% q/q, mainly due to higher lending volumes and 10%
increased market risk. 8%
6%
Issuer activity and funding plans
4%
• On 24 March 2021, Jyske Bank issued NOK 1bn and SEK 1bn tier 2 2%
capital at a spread of 3M CIBOR + 100bp. 0%
Q2'19 Q3'19 Q4'19 Q1'20 Q2'20 Q3'20 Q4'20 Q1'21
• Approx. EUR 500m preferred senior and approx. EUR 300m-500m non-
Common Equity Tier 1 Additional Tier 1 Tier 2 CET1 requirement Capital requirement
preferred senior expected to be issued in 2021.
Risk exposure amount (DKKbn) Accumulated change in yearly funding costs vs. 2018 (DKKm)
220 120
+0% y/y
200
180 100
160
80
140
120
60
100
80
40
60
40 20
20
0 0
Q2'19 Q3'19 Q4'19 Q1'20 Q2'20 Q3'20 Q4'20 Q1'21 2019 2020 2021E 2022E 2023E
Credit risk Market risk Operational risk Acc. change in funding costs vs. 2018 (DKKm)
Note: Funding costs are estimated based on currently expected spreads, run-off profile and funding plans for senior, NPS and capital instruments (excl. AT1). Spreads are 3M CIBOR equivalent. 17Volumes
Q1 2021
Summary 02
Financials 11
Volumes 18
Jyske Bank in brief 22
Macroeconomics 26
Calendar and contacts 30Lending growth in all segments in Q1 2021
Lending volumes (excl. repo) Lending volumes (excl. repo)
Leasing
Lending -1% y/y due to lower bank lending Corporate
5%
bank loans
• Bank loans -8% due to low credit demand amid COVID-19 pandemic, 13%
wide-reaching government support and continued credit policy focus.
• Mortgage loans +1% as significantly higher lending to corporate clients Private Private
more than offset lower mortgage lending to private clients. bank loans mortgages
4% 39%
• Leasing +4% due to structural growth and high demand in Q1 2021.
Lending +1% q/q from higher lending in all segments Subsidised
housing Mortgage-like
• Bank loans increased slightly as higher lending to corporate clients offset 12% 79%
lower lending to public authorities and private clients.
• Mortgage loans up DKK 1.5bn, as higher mortgage lending to corporate
clients more than offset lower mortgage lending to private clients. Corporate
New home loans
mortgages
• Leasing increased 3% amid high activity levels in Q1 2021. 26% 1%
Lending and deposits by segment (DKKbn) Business volumes (Q2 2019=100)
Mortgage loans (nom.) Bank loans (excl. repo) Deposits 115
and leasing (excl. repo, triparty)
350 140 140 DKK 178bn
110
Tusinde
Tusinde
Tusinde
300 120 120
DKK 20bn
105
250 100 100 DKK 335bn
200 80 80 100
150 60 60
95
100 40 40
90 DKK 126bn
50 20 20
DKK 73bn
0 0 0 85
Q1'20 Q1'21 Q1'20 Q1'21 Q1'20 Q1'21
Subsidised housing New home loans Private 80
Leasing Q2'19 Q3'19 Q4'19 Q1'20 Q2'20 Q3'20 Q4'20 Q1'21
Corporate Corporate Assets under management Mortgage loans (nominal)
Corporate Leasing Bank loans (excl. repo, new home loans)
Private Private Leasing Deposits (excl. repo)
Note: Lending and deposits figures are exclusive of repo loans as well as repo and triparty deposits. 19Lending portfolio
Loans, advances and guarantees by sector (DKKbn) Significant de-risking of mortgage portfolio LTV in recent years
Personal clients 42% 100% 68%
Real property 31% 90% 66%
Finance and insurance 10% 80% 64%
Other sectors 3% 70% 62%
62%
Public authorities 3% Personal clients 42%, 60% 60%
59%
Commerce 3% Corporate clients 55%,
50% 58%
Public authorities 3%
Manufacturing, mining etc. 2% 57%
40% 56%
Building and construction 2%
30% 54%
Agriculture, hunting, forestry,… 1%
20% 52% 52%
Transport, hotels and restaurants 1%
Energy supply 1% 10% 50% 50%
Information and communication 0% 0% 48%
Q1 2017 Q1 2018 Q1 2019 Q1 2020 Q1 2021
0 50 100 150 200 250 0%-20% 20%-40% 40%-60% 60%-80%
Fair value (~Mortgage) Amortised cost, guarantees (~Banking, Leasing) 80%-100% >100% Avg. LTV (ra.)
Loans, advances and guarantees by IFRS 9 stages (DKKbn) Clients are opting for fixed-rate mortgages
100% 49%
Q1'20 94,1% 90% 48%
Stage 1
80% 47%
Q1'21 93,0%
70% 46%
Q1'20 4,9% 60% 45%
Higher stage 2 share due to individualization
Stage 2
of part of COVID-19 management’s estimate 50% 44%
44%
Q1'21 in Q1 2021, not due to worsening credit quality
6,1% 40% 43% 43%
43% 42%
30% 42%
Q1'20 1,1% 42%
Stage 3
20% 37% 40% 41%
35% 35% 34%
Q1'21 0,9% 10% 40%
0% 39%
0 100 200 300 400 500 Q1 2017 Q1 2018 Q1 2019 Q1 2020 Q1 2021
Loans, advances and guarantees by IFRS 9 stages Fixed F3 - F10 F1 - F2
Capped floater Non-capped floater Interest-only (ra.)
2079% mortgage lending share improves resilience and growth
Mortgage lending is low risk, high growth and stable margins The Danish mortgage model
The Danish mortgage model
Provides highly attractive, transparent lending terms at a very low cost of
risk by issuing covered bonds with 1:1 matching terms (balance principle).
Mortgage Bonds
Mortgage lending has ~10x lower cost of risk than bank lending
Mortgage
Cost of risk has averaged 5bp for mortgage credit institutions vs. 51bp for Principal, interest credit institute Principal, interest
banks since 2000, peaking in 2009 at 20bp and 224bp, respectively. Borrower Investor
Growth is resilient during times of crisis and benefits from structural trend
Mortgage lending growth remained positive during the financial crisis and
has averaged 4.7% p.a. since 2004 vs. 2.5% p.a. for bank lending. Admin. margin
Mortgage lending supports a more stable margin development
Due to consolidation and full pass-through of interest rates, admin. margins
are up 59% since 2003, whereas banks’ net interest margins are down 44%.
Loan Investment
Mortgage lending growth stayed positive during the last crisis Credit quality of mortgage lending significantly stronger (bp)
3,500 225
Tusinde
200
3,000
CAGR: 4.7% p.a. 175
2,500 150
2,000 125
+3.6x 100
1,500
75
1,000 50
CAGR: 2.5% p.a. 25
500
0
0 -25
2004
2017
2000
2001
2002
2003
2005
2006
2007
2008
2009
2010
2011
2012
2013
2014
2015
2016
2018
2019
2008
2015
2003
2004
2005
2006
2007
2009
2010
2011
2012
2013
2014
2016
2017
2018
2019
2020
2021
Mortgage lending, Denmark (DKKbn) Bank lending, Denmark (DKKbn) Cost of risk, Danish mortgage credit institutions (bp)
Cost of risk, Danish banks (bp)
Sources: Statistics Denmark, Danish FSA and Finance Denmark. Note: Lending to non-financial corporations and households. For further information please see Finance Denmark. 21Jyske Bank in brief Summary 02 Financials 11 Volumes 18 Jyske Bank in brief 22 Macroeconomics 26 Calendar and contacts 30
One of the largest financial institutions in Denmark

                                                                                                                             Nationwide presence
Nationwide operations          Founded in 1967 and now holds approx. 11% market share in AAA-rated economy
in sound AAA economy           with strong nationwide presence following organic growth and succesful M&A.

Complementary, full-           Offering a full range of financial products and services as the third largest bank, the
service offering               fourth largest mortgage credit institute and one of the largest leasing providers.

Structural, low-risk           High share of mortgage lending heightens credit quality, stabilises margins through-
growth exposure                the-cycle and ensures a significant exposure to structural growth.

Founded in 1967 – now a Danish SIFI                    History of succesful M&A                                  Focused on core business
1967                                                   Proven track-record of succesful recent M&A               Divesture of non-core business
Founded by merger of four local banks, some            Acquisitions made at discount to book value and           Sale of Jyske Bank Global Asset Management
dating back to 1882.                                   fully integrated to reap synergies.                       (US) (2013), Silkeborg Data (2014), stake in
                                                                                                                 Berben’s Effectenkantoor (2014), Jyske Bank
                                                       2011
1970’s-1989                                                                                                      Schweiz (2015) and Jyske Bank (Gibraltar) Ltd.
                                                       Acquisition of leasing activities from Spar Nord.
Seven acquisitions of small and medium-sized                                                                     (2020).
banks and establishment of minor, foreign
                                                       Acquired parts of the client portfolio of
subsidiaries.                                                                                                    Ready for new opportunities
                                                       Fjordbank Mors from Finansiel Stabilitet.
                                                                                                                 Growth through acquisitions is an ongoing
1989-2011                                              2013                                                      strategic initiative and Jyske Bank remains
Organic growth while carrying out several              Acquisition of Sparekassen Lolland.                       willing and able to participate in further
strategic initiatives.                                                                                           consolidation of the Danish financial sector.
                                                       2014
                                                       Acquisition of Jyske Realkredit from BRFfonden.

                                                                                                                                                                  23
Sustainability ingrained in vision
Financing a sustainable transition
Financing 4 TWh renewable power in 2025 by supporting
development of wind and solar energy (2020: 2.5 TWh).
In 2025, 40% of new vehicles loans will finance low-
emission vehicles.
Financing DKK 40bn of commercial property with low
energy consumption by 2025 (2020: DKK 31bn).
Sustainable banking operations
Electricity consumption is offset by own renewable
energy production. By end-2022, emissions related to
district heating and company cars will also be offset.
Energy management systems installed on all locations in
order to keep reducing consumption. Company cars will
“We have an ambition of running our business responsibly and in gradually be replaced by low-emission vehicles.
a way that promotes sustainability.” – Jyske Bank’s vision
Note: Please see Jyske Bank’s Sustainability Report for further information. 24From above-market growth to repricing and cost initiatives
Introducing profitability initiatives in next phase of strategy Lower deposit rates increase net interest income (DKKm)
120
Repatriation of Totalkredit loans following merger in 2014 accomplished
• Following a prolonged period of above-market growth, the repatriation 100
of Totalkredit loans has been accomplished. Coincidentally, a 80
precautionary credit policy, implemented due to a late-stage credit
cycle, also reduced growth. 60
Significant repricing initiatives to improve profitability after growth period 40
• Jyske Bank has successfully introduced negative deposit rates for 20
private clients’ deposits and lowered deposit rates for corporate clients,
0
while also making significant changes to the fee structure.
-20
Branch network to be reduced amid elevated pace of headcount reduction
• Branches will be brought down by approximately 20% and FTEs will be -40
Q2'18 Q3'18 Q4'18 Q1'19 Q2'19 Q3'19 Q4'19 Q1'20 Q2'20 Q3'20 Q4'20 Q1'21
reduced by a further 4-6% from mid-2020 to mid-2021, given higher
demand for digital banking services and normalization of market share of
Interest income from deposits (excl. repo, triparty)
branches following period of above-market growth.
Significant reduction of headcount (2006=100) Branch network under structural pressure from digital banking
115 110
110
100
105
90
100
95 80
90 70
85
60
80
50
75
70 40
2013 2014 2015 2016 2017 2018 2019 2020 H1
2014
2006
2007
2008
2009
2010
2011
2012
2013
2015
2016
2017
2018
2019
2020
2021
Jyske Bank Danish banks Locations in Denmark (2013=100) Targeted reduction by mid-2021
Sector (2013=100)
Source: Company data, FinansDanmark, FA. 25Macroeconomics Summary 02 Financials 11 Volumes 18 Jyske Bank in brief 22 Macroeconomics 26 Calendar and contacts 30
Macroeconomics
Real gross domestic product (index 2010, y/y) Inflation rate (HICP, y/y)
10% 6%
5% 5%
4%
0%
3%
-5%
2%
-10%
1%
-15% 0%
-20% -1%
2004
2004
2005
2006
2007
2008
2009
2010
2011
2012
2013
2014
2015
2016
2017
2018
2019
2020
2021
2005
2006
2007
2008
2009
2010
2011
2012
2013
2014
2015
2016
2017
2018
2019
2020
2021
Denmark Euro area Denmark Euro area
Unemployment rate Interest rates, Denmark (monthly averages)
14% 7%
12% 6%
5%
10%
4%
8%
3%
6%
2%
4%
1%
2% 0%
0% -1%
2013
2020
2004
2005
2006
2007
2008
2009
2010
2011
2012
2014
2015
2016
2017
2018
2019
2004
2005
2006
2007
2008
2009
2010
2011
2012
2013
2014
2015
2016
2017
2018
2019
2020
2021
Denmark Euro area 3-month interbank rate 10-year government bond yield
Source: Eurostat. 27Macroeconomics
Real estate prices, Denmark (y/y) House prices to disposable income (2015=100)
30% 140
25%
20% 130
15%
120
10%
5%
110
0%
-5% 100
-10%
-15% 90
-20%
80
2004
2005
2006
2007
2008
2009
2010
2011
2012
2013
2014
2015
2016
2017
2018
2019
2020
2009
2016
2004
2005
2006
2007
2008
2010
2011
2012
2013
2014
2015
2017
2018
2019
2020
One-family houses Owner-occupied flats Denmark Euro area
Lending growth, Denmark (y/y) Economic Sentiment Indicator
30% 120
25%
110
20%
15% 100
10% 90
5%
80
0%
-5% 70
-10%
60
-15%
2005
2004
2006
2007
2008
2009
2010
2011
2012
2013
2014
2015
2016
2017
2018
2019
2020
2021
50
2004
2005
2006
2007
2008
2009
2010
2011
2012
2013
2014
2015
2016
2017
2018
2019
2020
2021
Bank lending to households Mortgage lending to households
Bank lending to non-financial corp. Mortgage lending to non-financial corp. Denmark Euro area
Sources: Statistics Denmark, OECD, Eurostat. 28Forecast
Financial results and key figures DKKbn Real growth (%)
Danish economy
2020 2018 2019 2020 2021 2022
Consumer spending 1,046 2.7 1.4 -3.1 2.9 5.1
Public spending 575 0.3 1.2 -0.4 1.4 0.9
Fixed gross investment 526 4.8 2.8 1.7 0.8 3.8
Inventory investment* 17 0.3 -0.3 -0.1 0.2 0.0
Exports 1,252 3.2 5.0 -8.5 3.9 7.6
Imports 1,111 4.8 2.4 -5.6 2.4 6.6
Gross domestic product (GDP) 2,304 2.2 2.8 -3.3 2.9 4.2
Balance of payments
- DKKbn 158 207 171 188 180
- percentage of GDP 7.0 8.9 7.4 7.9 7.2
Public budget balance
- DKKbn 16 88 -40 -70 -35
- percentage of GDP 0.7 3.8 -1.7 -2.9 -1.4
Unemployment
- Gross unemployment, average (thousands) 108 104 132 129 112
- Percentage of workforce 3.5 3.4 4.3 4.1 3.6
Employment, avg. (thousands) 2,966 3,003 2,981 2,990 3,025
Inflation (%) 0.8 0.8 0.4 1.0 1.5
Wage index (Private, %) 2.2 2.0 1.9 2.1 2.2
House prices (nominal prices, %) 3.8 3.0 4.3 6.8 1.9
Danmarks Nationalbank’s lending rate, year-end (%) 0.05 0.05 0.05 -0.35 -0.35
Danmarks Nationalbank’s CD rate, year-end (%) -0.65 -0.75 -0.60 -0.50 -0.50
* Contribution to growth as a percentage of the preceding year's GDP.
Sources: Statistics Denmark, Jyske Bank as of 26 March 2021. 29Financial calendar and contacts Financial calendar 2021 23 Feb. 2021 Announcement of the 2020 results 23 Feb. 2021 Annual report 23 Feb. 2021 Risk Management Report 2020 23 Mar. 2021 Annual General Meeting 04 May. 2021 Interim report for the first quarter of 2021 17 Aug. 2021 Interim report for the first half of 2021 02 Nov. 2021 Interim report for the first nine months of 2021 Trine Lysholt Nørgaard Head of Investor Relations & Sustainability Phone: +45 89 89 64 29 Mobile: +45 21 58 25 15 E-mail: trine.norgaard@jyskebank.dk Simon Hagbart Madsen Senior Analyst, Investor Relations & Sustainability (Equity IR) Phone: +45 89 89 71 85 Mobile: +45 24 44 83 70 E-mail: simonhagbart@jyskebank.dk Note: ir@jyskebank.dk and investor.jyskebank.com/investorrelations for further information.
Disclaimer

This presentation and the information contained therein is furnished and has been prepared solely for information purposes by Jyske Bank A/S. It is furnished for
your private information with the express understanding, which recipient acknowledges, that it is not an offer, recommendation or solicitation to buy, hold or
sell, or a means by which any security may be offered or sold.

The information contained and presented in this presentation, other than the information emanating from and relating to Jyske Bank A/S itself, has been
obtained by Jyske Bank A/S from sources believed to be reliable. Jyske Bank A/S can not verify such information, however, and because of the possibility of
human or mechanical error by our sources, Jyske Bank A/S or others, no representation is made that such information contained herein is accurate in all
material respects or complete. Jyske Bank A/S does not accept any liability for the accuracy, up-to-dateness, adequacy, or completeness of any such
information and is not responsible for any errors or omissions or the result obtained from the use of such information. The statements contained herein are
statements of our non-binding opinion, not statement of fact or recommendations to buy, hold or sell any securities. Changes to assumptions may have a
material impact on any performance detailed. Historic information on performance is not indicative of future performance. Jyske Bank A/S may have issued, and
may in the future issue, other presentations or information that are inconsistent with, and reach different conclusions from, the information presented herein.
Those presentations or the information reflect the different assumptions, views and analytical methods of the analysts who prepared them and Jyske Bank A/S
is under no obligation to ensure that such other presentations or information are brought to the attention of any recipient of the information contained herein.

Nothing in this presentation constitutes investment, legal, accounting or tax advice, or a representation that any investment or strategy is suitable or
appropriate to your individual circumstances, or otherwise constitutes a personal recommendation to you. This presentation is intended only for and directed to
persons sufficiently expert to understand the risks involved, namely market professionals. This publication does not replace personal consultancy. Prior to
taking any investment decision you should contact your independent investment adviser, your legal or tax adviser, or any other specialist for further and more
up-to–date information on specific investment opportunities and for individual investment advice and in order to confirm that the transaction complies with
your objectives and constraints, regarding the appropriateness of investing in any securities or investment strategies discussed herein.

Jyske Bank A/S or its affiliates (and their directors, officers or employees) may have effected or may effect transactions for its own account (buy or sell or have a
long or short position) in any investment outlined herein or any investment related to such an investment. Jyske Bank A/S or its affiliates may also have
investment banking or other commercial relationship with the issuer of any security mentioned herein. Please note that Jyske Bank A/S or an associated
enterprise of Jyske Bank A/S may have been a member of a syndicate of banks, which has underwritten the most recent offering of securities of any company
mentioned herein in the last five years. Jyske Bank A/S or an associated enterprise may also have, within the last three years, served as manager or co-manager
of a public offering of securities for, or currently may make a primary market in issues of, any or all of the entities mentioned herein or may be providing, or have
provided within the previous 12 months, significant advice or investment services in relation to the investment concerned or a related investment.

Any particular security or investment referred to in this presentation may involve a high degree of risk, which may include principal, interest rate, index, currency,
credit, political, liquidity, time value, commodity and market risk and is not suitable for all investors. Any securities may experience sudden and large falls in their
value causing losses equal to the original investment when that investment is realized. Any transaction entered into is in reliance only upon your judgment as to
both financial, suitability and risk criteria. Jyske Bank A/S does not hold itself out to be an advisor in these circumstances, nor does any of its staff have the
authority to do so.

                                                                                                                                                                     31
You can also read