Data from this session powered by Nutrition Business Journal - Use the promo code STATENBJ for $50 off the - New Hope Network
←
→
Page content transcription
If your browser does not render page correctly, please read the page content below
Data from this session powered
                          by Nutrition Business Journal

    Use the promo code STATENBJ for $50 off the
Dark Issue 2, available now at newhope.com/darkissue2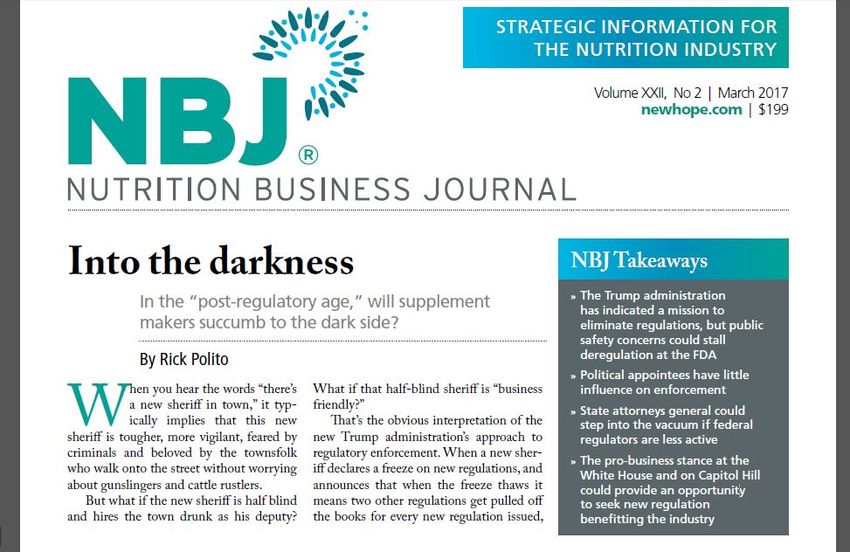
Objectives for this Session
   Provide latest market, financial, and regulatory data/trends for the
                          supplement industry
 Discuss some of the recent challenges facing our industry and ideas to
                       address these challenges
                      Updates on OWL Initiative
You walk away with a better understanding of how to lead your business
            and how to participate in improving our industry

                                                  Produced by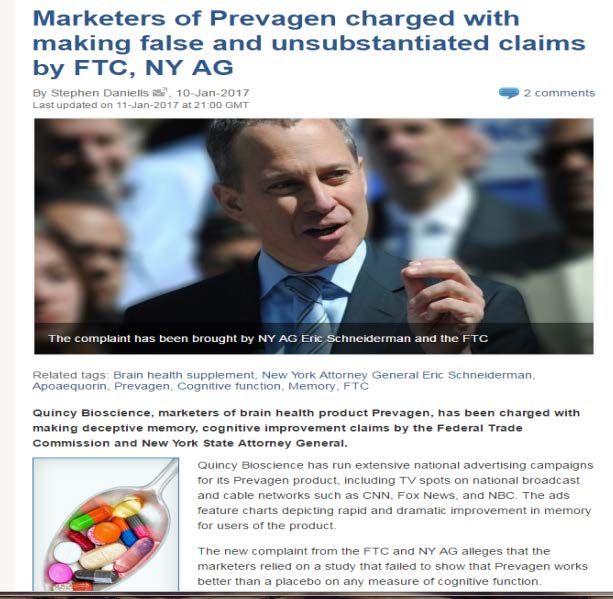
Panel Agenda
              I.  Opening Remarks– Thomas Aarts
        II. Featured Speaker– Senator Martin Heinrich
III.   Market Overview and Trends– Thomas Aarts & Rick Polito
             IV. Financial Overview – William Hood
                   V. Regulatory Overview
I.     What is OWL and how will it improve the supplement industry?
                           i.   Steve Mister
           VI. Discussion and Q&A from the audience

                                                Produced by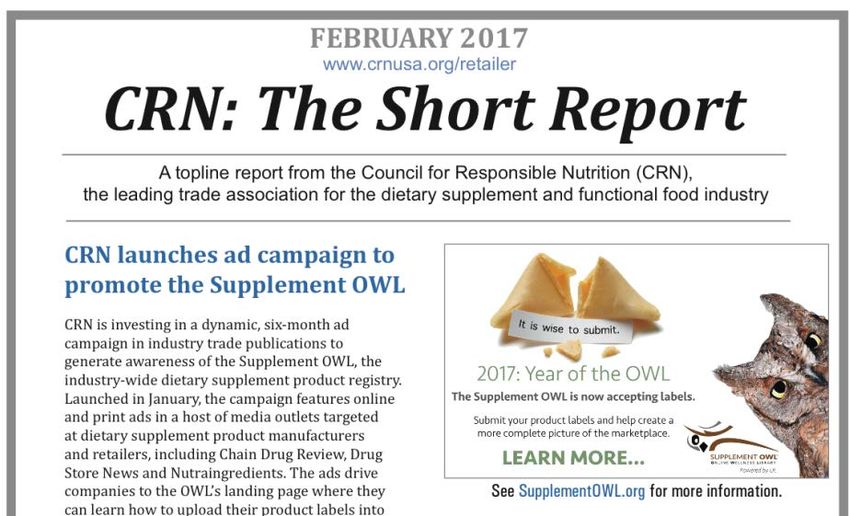
20th Annual NBJ Summit Agenda Highlights:
                             July 17th -20th, 2017
                                               Theme:
                “Building Consumer Confidence through Disruption, Trust & Transparency”
                                           Panels/Topics:
                                        - NBJ State of the Industry
 - The China Opportunity: The Why Behind Chinese Consumer Demand for U.S. Nutrition      Products
               -The Power of Digital Connection in Growing Your Business and Community
                       -Personalized Nutrition: Innovation in Nutrition Customization
                            -The Future of Supplement Retail for Supplements
    -Inside the World of Amazon: What’s Coming and How Your Brand Can Thrive in This Brave New
                                                   World
                           -Radical Transparency in the Ingredient Supply Chain
                                        Featured Speakers:
                   Colin Watts, Doug Rauch, JJ Virgin, Brian Gonsalves, William Hood

                                                                 Produced by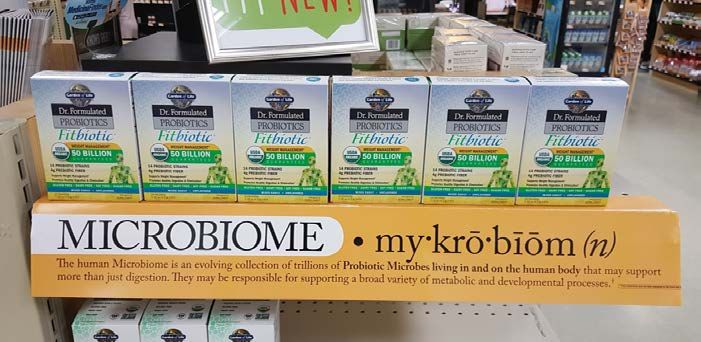
Supplement Industry Market
      Overview 2017
       Thomas Aarts & Rick Polito

                                    Produced by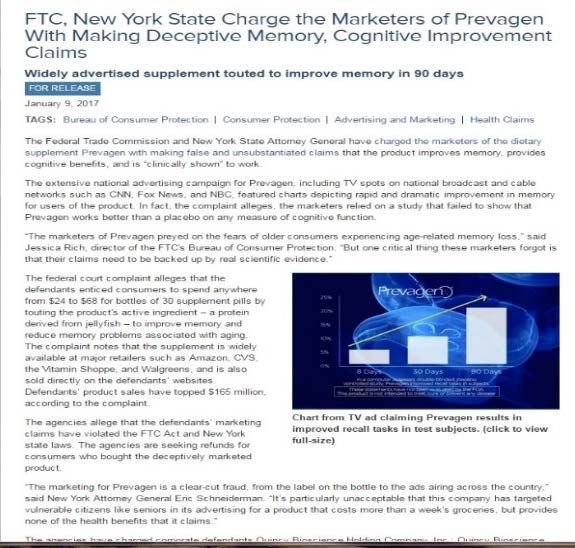
U.S. Natural Products Sales grew 7.7% to $195B in
           2016– adding $14B in Sales
 $300,000                                                                                                                       14%
 $250,000                                                                                                                       12%
                                                                                                                                10%
 $200,000
                                                                                                                                8%
 $150,000
                                                                                                                                6%
 $100,000
                                                                                                                                4%
  $50,000                                                                                                                       2%
         $0                                                                                                                     0%
                2005    2006    2007    2008    2009   2010   2011   2012   2013   2014   2015   2016 2017e 2018e 2019e 2020e

      Supplements                                      Natural & Organic Foods                     Functional Foods
      Natural & Organic Personal Care                  Growth
 Source: Nutrition Business Journal
 (2016 preliminary estimates; $mil, consumer sales)

                                                                                                   Produced by
2016 growth estimates                   FUNCTIONAL

                                                                    +7.6%
                                                                      $59.7 B
               SUPPLEMENTS
          Natural & Organic

           +6.6%
                                                                      NATURAL &

          Food and Bev                                         ORGANIC FOOD AND
                                                                            BEV
                                                                    +8.5%
                                                                      $74.8 B

                                                                     NATURAL
                                                                       LIVING
                                     $68.9
                                     $41.4BILLION
                                           BILLION                  +7.5%
                                                 Produced by
Source: Nutrition Business Journal                                    $18.7 B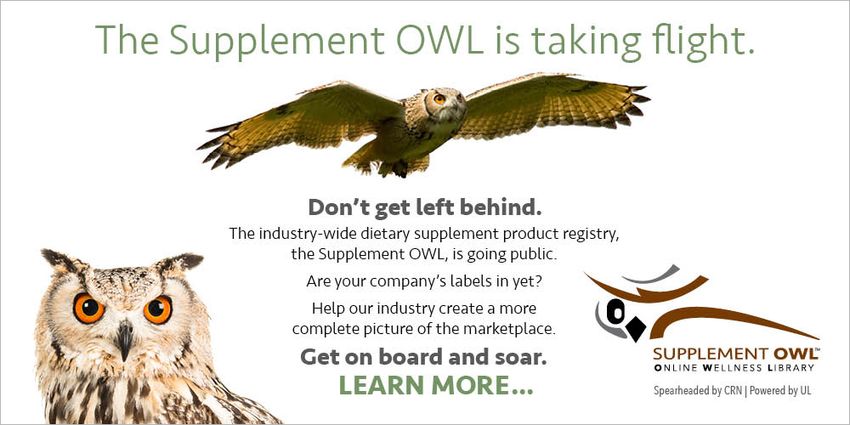
U.S. Functional Food & beverage Sales hit $59.7B
       in 2016, on Estimated 7.6% Growth
 $90,000                                                                                                    9%
 $80,000                                                                                                    8%
 $70,000                                                                                                    7%
 $60,000                                                                                                    6%
 $50,000                                                                                                    5%
 $40,000                                                                                                    4%
 $30,000                                                                                                    3%
 $20,000                                                                                                    2%
 $10,000                                                                                                    1%
       $0                                                                                                   0%
              2009     2010      2011     2012        2013   2014   2015   2016   2017e 2018e 2019e 2020e
 Source: Nutrition Business Journal
 (2016 preliminary estimates; $mil, consumer sales)

                                                                                      Produced by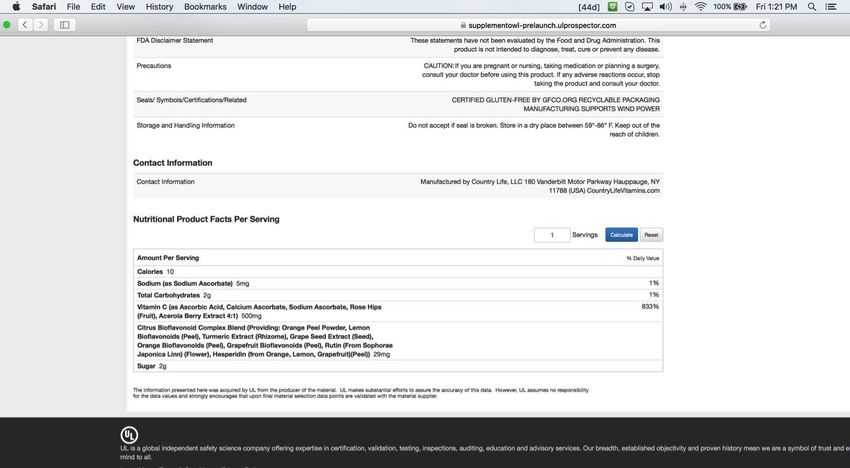
Total U.S. Supplement Sales Grew 6.6% to $41.4B
       in 2016– Adding $2.6B in New Sales
 $60,000                                                                                              8%
                                                                                                      7%
 $50,000
                                                                                                      6%
 $40,000
                                                                                                      5%
 $30,000                                                                                              4%
                                                                                                      3%
 $20,000
                                                                                                      2%
 $10,000
                                                                                                      1%
      $0                                                                                              0%
             2009     2010      2011       2012   2013   2014   2015   2016 2017e 2018e 2019e 2020e
  Source: Nutrition Business Journal
  (2015 estimates; $mil, consumer sales)

                                                                                 Produced by
Supplement Bright Spot: Herbs & Botanicals
$12,000                                                                                                                   9%
                                                                                                                          8%
$10,000
                                                                                                                          7%
 $8,000                                                                                                                   6%
                                                                                                                          5%
 $6,000
                                                                                                                          4%
 $4,000                                                                                                                   3%
                                                                                                                          2%
 $2,000
                                                                                                                          1%
     $0                                                                                                                   0%
            2005   2006    2007   2008   2009    2010   2011   2012   2013   2014   2015   2016 2017e 2018e 2019e 2020e
 Source: Nutrition Business Journal (2015 preliminary
 estimates; $mil, consumer sales)

                                                                                              Produced by
Market Data Update
Category Growth for Supplements
2015
Category 2016 Forecast Y-O-Y Growth (e) Dollars Gained/Lost
Sales
Probiotics $1.61B $1.88B 17.0% $0.27B
Sports nutrition $5.28B $5.72B 8.3% $0.44B
Meals $4.51B $4.86B 7.6% $0.34B
Vitamin D $0.83B $0.89B 7.5% $0.06B
B vitamins $2.02B $2.12B 5.3% $0.11B
Vitamin C $1.08B $1.11B 2.5% $0.03B
Homeopathics $1.23B $1.27B 3.4% $0.04B
Multis $5.78B $5.92B 2.4% $0.14B
Omegas $1.13B $1.15B 1.4% $0.02B
Calcium $1.15B $1.15B -0.4% -$0.004B
Source: Nutrition Business Journal
Multis and Omegas are coming back; significant opportunity in probiotics, sports, and meal
replacements
Produced by
13US Dietary Supplement Industry $41.4 Billion in 2016:
Sales by Segment
Minerals
8%
Meals
• The category lines continue to
12% Vitamins
blur because of the trend of
31%
multi- ingredient formulations
Sports • Combination formulas are
Nutrition
14% helping to boost the herb and
botanical category, which has
struggled for several years
Herbs &
Botanicals Specialty
18% 18%
Source: Nutrition Business Journal Early Estimates
Produced by
14US Dietary Supplement Industry $41.2 Billion in 2016:
Sales by Channel
Internet
6%
Practitioner Natural &
9% Specialty
Retail
• Internet and Practitioner are poised to
37% be the biggest growth channels in the
future
MLM
16%
• Mass market continues to garner large
shares because of low pricing, but
customers are looking for the highest
Mail/DRTV, quality and are looking to natural retail
Radio first- or the store- within- the store of
5%
Mass Market mass market in retail
Retail
27%
Source: Nutrition Business Journal Early Estimates
Produced by
15Market Data Update
US Supplement Sales Growth by Channel in
12.0%
2016 11.0%
10.0%
7.8%
8.0%
6.2%
6.0% 5.7%
4.5% 3.7%
4.0%
2.0%
0.0%
Natural & Mass Market Mail/DRTV, Radio MLM Practitioner Internet
Specialty Retail Retail
• Internet is showing highest growth for several years in a row; Amazon continues to drive this and is starting
to focus on its own private label
Source: Nutrition Business Journal
Produced byAmazon’s Moves to Supplements
Officially launching private label supplements that include Vitamins K
and D, tumeric and Calcium
Produced byMarket Data Update
Amazon Go:
Where Internet Meets Mass Market
Amazon, the e-commerce
technology company, has opened
there first grocery cashier-less
grocery store
– Mass market competitors need
to have a strong presence on
“The goal is for Amazon to completely control the Internet to remain
the physical flow of products from competitive
warehouses to the end consumer, opening up – Amazon has leased over 3,000
a rivals alternative to Target and Walmart.” properties to open up additional
stores throughout the USA
Produced byMarket Data Update
Consumer Supplement Sales by Channel: 2009-2020e
Sales in 2009 Sales 2016 Sales 2020e
Internet
Internet Internet
Practitioner 4% 7% Natural & 10% Natural &
Natural & Practitioner Practitioner
8% 9% Specialty 10% Specialty
Specialty
Retail Retail Retail
37% 37% 36%
MLM
17% MLM MLM
16% 15%
Mail/DRTV,
Radio Mail/DRTV, Mail/DRTV,
5% Radio Radio
Mass Mass
5% 4%
Mass Market Market Market
Retail Retail Retail
29% 26% 25%
Source: Nutrition Business Journal
Produced by
19Market Data Update
Supplement Sales & Growth by Conditions (2016)
Condition Specific Supplements
2015 2016 Y-O-Y Growth
($mil., consumer sales)
Sports/Energy/Weight-Loss 11,740 12,654 7.8%
General Health 5,187 5,366 3.4%
Cold/Flu-Immune 2,595 2,725 5.0%
Gastrointestinal health 2,284 2,672 12.6%
Heart health 2,457 2,535 3.2%
Bone health 1,998 2,065 3.3%
Joint health 1,651 1,678 1.6%
Diabetes 1,458 1,552 6.5%
Anti-cancer 1,423 1,467 3.1%
Hair/Skin/Nails 860 898 4.4%
Sexual Health 710 760 7.1%
Brain Mental 643 657 2.2%
Insomnia 569 594 4.5%
Mood 575 592 3.0%
Menopause 500 513 2.4%
Vision 436 445 2.2%
Anti-aging 418 436 4.4%
Liver & Detox 125 135 8.4%
Sum of top 18 Conditions 35,628 37,646 5.7%
Other Conditions 3,217 3,600 10.8%
Total Supplements 38,845 41,407 6.6%
Produced byMarket Data Update
Key Focus Areas for Consumers:
What Health Issues are Consumers Concerned About?
Sleep Issues
Lack of Energy
Skin or Hair Issue
Frequent Joint Soreness
Menopause
Frequent Muscle Soreness
Others
Frequent Digestive Issues
Respiratory Issues
Blood-sugar Issues
Vision Problems
0.0% 5.0% 10.0% 15.0% 20.0% 25.0% 30.0% 35.0%
Source: Nutrition Business Journal Consumer Study, May 2015
In a consumer survey conducted by NBJ in 2015, over 30% of participants indicated having issues with
sleep or suffering from lack of energy (lack of sleep also causes lack of energy)
Produced byTop Macro Supplement Trends 2016-2018
1. Protein goes mainstream with plant proteins being the next big thing
2. New convenient delivery forms are of interest to consumers
3. Personalization and Semi- Personalization are coming to a theater near you
4. Whole foods supplements holding their own
5. Pet supplements are becoming a legitimate category
6. Non-GMO interest and consumer awareness is impacting supplements
7. Gut health is still hot and the science is becoming stronger – next hot topic here is the
“microbiome”
8. Brain health interest is still growing
9. Internet is a big factor
10. Detox Category leaning towards Liver
11. Sleep remains a huge opportunity that is an unmet need in the mass market
12. Inflammation supplements are very high on consumer radar
13. More transparency and science will be required to succeed
Produced by
22Trend #1: Protein Goes Mainstream with Plant
Proteins Being the Next Thing
Protein is moving out of the gym as more and more people are
moving into the gym
Produced byNumber of Consumers Looking for Foods High in
Protein has Skyrocketed
% of General Population Who Seek Out Foods High in Protein
53%
In 2014, 21% of general population considered
39% themselves as deficient in protein.
2006 2007 2008 2009 2010 2011 2012 2013 2014
Produced byConsumers Are Changing and Adopting More Plant-
Based Diet Options
% of General Population Who Have Used in Past 3 Months
40% 24% 24% 7%
Plant Protein Soy Protein Whey Protein Insect Protein
Consumers are also being more selective about the source of protein: grass-fed, pasture-
raised and plant-based proteins are attempting to meet the growing demand for humanely
and sustainably-raised proteins.
Produced byTrend #2: Pill vs. Non-Pills
Segmentation of U.S. Dietary Supplements Industry (2015)
Shot All Other Chewable
0% 1% 9%
Non-Pills
Effervescent
34% 8%
Powder
37%
Pills
66% Gummy
30%
Non-Pills:
Pills: • Chewables Quick Dissolve Liquid
• Pill packs • Effervescent tablets 4% Lollipop 9%
• Pills • Gummies 0% Lozenge
• Softgels • Liquids 2%
• Capsules • Lozenges
• VegiCaps • Lollipops Non-Pill Forms account for ~$13.3 Billion
• Quick Dissolve tablets (34%) of $38.8 Billion Supplement Industry
Source: IRI data analysis • Powders
• Shots
Produced byGummies: Not Only for Kids
35% AdultGummy
products
Children's Gummy
products
65%
Gummies successfully crossed into the adult VMS category– what is next for gummies? (eg.
Pectin, sugar free, etc.)
Produced by
27Top Supplement Trends
Trend #3: Personalization
Coming to a Theater Near You
o Yesterday: Shakes and a Scale
o Today: Engineered foods and supplements with a saliva, urine, skin,
cheek-swab, blood or skin test
o Tomorrow: Real-time, wearable diagnostic and monitoring
technology with graphical display of nutrients and
biomarkers
Produced byTop Supplement Trends
Recent Personalized Approaches for Nutrition and
Supplements
Your Scientific Path to Wellness
Produced byTop Supplement Trends
Technology and Personalized Nutrition is Trending
Unique new trends found at CES 2017
• A wearable device that • Styr Labs is a razor blade
increases relaxation and sleep company the sells innovative
restoration technology on the forefront
• Magnesium supplements are • The main goal of Styr though, is
also given to increase to sell customized supplements
functionality of the wearable following the sales of the
device technology
Produced byThe Future of Healthcare Driven by Paradigm Shifts in
Medicine & Technology
Mobile
Public Health
Technology
Initiatives
(e.g. ObamaCare)
Lifestyle Personalized Innovative* Social
Healthcare/ Diagnostics
Medicine Lifestyle Networks
Healthcare
Crisis Medicine Innovative*
Nutrition, Rx, Accessible Diagnostics
P4 Medicine Lifestyle (Genetics & Self Care
(Quantified Self) Computing
(Personalized, Therapies Biomarkers)
Power
Preventative,
Private Health Predictive,
Initiatives Participatory)
(Insurers, Corp.
Wellness) *Innovative = Simpler, Faster, Better, Real Time Products & Services Big Data
Sources: PLMI, Eric Topol, G. Ferrier
Produced byTop Supplement Trends
Trend #7: Getting the Gut
CASE STUDY: Bacillus coagulans GBl-30, 6086
OCT 2010: TPG buys 25% stake in Schiff for $50M
JUN 2011: Schiff buys exclusive BC30 rights in
supplements & OTC for $40M
Ganeden focuses on functional applications and is currently
used in multiple products:
In 2015, probiotics reached
> food service (Jamba Juice, Red Mango, Naked Pizza)
$1.6B in sales across all
> yogurt, pasta, chocolate
channels. By the end of 2017,
> alternative sweeteners
the category is expected to
> baked goods
break $2B.
> others and growing significantly
The future of probiotics is in both pills and food/beverage applications
Produced byTop Supplement Trends
Consumers Exhibit a Growing Desire to Add
Probiotics to Their Diet
% of General Population
Want more probiotics in their diet 42% Up from 12%
in 2008
Want more prebiotics in their diet 17%
Use probiotic enriched F&B 19%
Use probiotic supplements 18%
Produced byThe Future of Probiotics
Produced byTop Supplement Trends
Brain Health: Still a Significant and Untapped Market
Opportunity
Consumers a lot / a little Category sales
concerned (%) ($MM)
Market
Potential
Source: Nutrition Business Journal
Produced byTop Supplement Trends
The Prevagen Dilemma:
What Does it Mean for the Brain Space?
Opportunity of Caution Flag?
Produced byTop Supplement Trends
Trend #9: Internet is a Big Factor
Internet channel supplement sales by product
Source: Nutrition Business Journal
While sports supplements have seen the strongest growth of internet sales over the last
decade (10.9%), herbs & botanicals are expected to post the strongest growth over the next 5
years (12.7%).
Produced byTop Supplement Trends
Trend #13: More Transparency and Science Will Be
Required to Succeed
Since 2015 NBJ CEO Summit, the industry has coalesced around a coordinated effort to raise standards
for supplements in all categories
Voluntary chain information with traceability from seed to shelf
– Megafoods has already tapped into this trend
2015 was the year of “We’ve got to do something!” wake-up call moment
Key companies and trade groups have joined in programs to elevate the industry to new levels of quality
and trust
Notable efforts include:
– Product Registry (OWL) led by CRN
– GNC Quality Control Initiative led by GNC and AHPA
– NPA Audit Scorecard led by NPA and GNC
– Global Retailer and Manufacturer Alliance Initiative led by NSF and top retailers
– Attorney General outreach led by CRN, AHPA and UNPA
Source: Nutrition Business Journal CEO Summit, 2015-2016
Produced byThe Dark Side of the new political reality
and the “Post-Regulatory Age”
Rick Polito
Editor in Chief NBJ
Produced byGoing Dark
Source: Nutrition Business Journal ($mil., consumer sales)
Produced byPercent of Total 15,000 Dietary Ingredients on Vitamins
the Pre- DSHEA List
+5.9 $38.8 BILLION
CY 2015
Source: Nutrition Business Journal ($mil., consumer sales)
Produced bySKU’s byGoing Dark Count
Dietary Ingredient
Produced byVitamins
SUPPLEMENTS +4.8%
$12.8 B
+6.
Minerals
$2.9 B
Specialty
$41.3 BILLION +7.7%
$7.7 B
CY 2016e
Source: Nutrition Business Journal ($mil., consumer sales)
Produced byWhat’s next? That’s up to you
Produced byGetting Started on the
Supplement OWL ™
Natural Products Expo
Saturday, March 11, 2017
Steve Mister
President & CEO, CRN
www.SupplementOWL.orgwww.SupplementOWL.org
Our Stakeholders are Watching… Congress – Proposed Third Party Certification of Products on Military Bases State Attorneys General – New York, Oregon, Vermont State Legislatures – New York, Massachusetts, New Jersey Consumer Organizations – continued concerns for quality Retailers – uneasiness about what’s on the shelf, concerns for liability Consumers – questions about safety, benefits and quality www.SupplementOWL.org
Regulators Should Know the Industry They Regulate Who are the companies in the industry? What brands are being marketed? What ingredients are in the marketplace? Which products contain which ingredients? www.SupplementOWL.org
THE
         Supplement OWL                                    ™

                     Online Wellness Library
     A single authoritative registry of dietary supplement product
    information where all stakeholders can find information about
 products, ingredients, and additional quality and safety information.

www.SupplementOWL.org
What is THE
Supplement OWL ? ™
• Industry-wide, self-regulatory initiative that promotes
transparency and accountability.
• Assists regulators, retailers and other stakeholders in
understanding the marketplace.
• Demonstrates responsibility by the industry.
www.SupplementOWL.orgTHE
Supplement OWL ™
GUIDING PRINCIPLES:
• Self-regulation is a hallmark of a mature and responsible
industry
A voluntary product registry, developed and supported by industry, is
preferable to a mandatory federal or state registry.
• The OWL will connect outside stakeholders to other industry
quality and safety initiatives.
www.SupplementOWL.orgWhat’s in The Supplement OWL?
Two Tiers of product information
• Tier 1 is FREE to all product marketers who are willing to provide the basic
information about their products.
• It will include the information that is accessible from the product label.
• It will provide regulators with information about the product manufacturer
and packager.
• Tier 2 will allow product marketers who want to provide additional
documentation and supporting materials to specific audiences they select.
• Tier 2 will generate financial resources to support the administration of the
registry.
www.SupplementOWL.orgWhat information will be included?
• Tier 1 information will include:
• brand, product name, product category, delivery description, intended users,
ingredients, Daily Values, serving size, label claims, precautionary
statements, storage information, seals & certifications, allergy statements;
• Images of the product and the product label;
• A unique alpha-numeric identifier (may be used on the product, but not
required).
• Tier 2 information will include:
• Product specification sheets, supporting documents for product attributes
and certifications, evidence of third-party audits and GMP compliance.
www.SupplementOWL.orgwww.SupplementOWL.org
Example of results from
                                      clicking on Chewable Vitamin
                                      C on search results page

                                                                  Tier 2 feature. Only visible to users that
              See label by clicking                               manufacturer provides access. This can be, a
                                                                  single person, multiple people, a company,
                                                                  and/or an entire persona such as retailers. Users
                                                                  without access would only see General
                                                                  Information

www.SupplementOWL.org      Tier 1 Information in tabular format
Tier 1 Information (Continued) www.SupplementOWL.org
Tier 1 Information (Continued)

               Confidential contact Information only viewable by FDA-
               Manufacturing company and Packaging company or responsible               Public Contact Information
               senior quality professional contact information

www.SupplementOWL.org
We want everyone to participate in the Supplement OWL! www.SupplementOWL.org
www.SupplementOWL.org
www.SupplementOWL.org www.SupplementOWL.org
THE
         Supplement OWL ™

                        OPENING TO THE PUBLIC ON APRIL 10TH

                             We want the industry to be
                           well represented on opening day

www.SupplementOWL.org
Getting Started
Step #1
1. Request Service Order Form (SOF) – it’s easy
Send email to: OVP.SalesSupport@ul.com
Subject: Request for OWL SOF
Click HereDocuments/Information that will be needed
Signed Order Form & Service Agreement
Manufacturing and Packaging Company
Contact [Company name, address, phone number]
Information is only viewable by regulatory agencies (FDA, etc.)
(OR)
FDA Confidential
Information
Senior Quality Professional Contact
[Name, title, phone number and email address of responsible professional
that can provide manufacturing /packaging company contact information]
Information is only viewable by regulatory agencies (FDA, etc.)
Label in readable PDF format
(300 dpi recommended)
(Carton image can be provided in addition – ensure does not
contain confidential information (i.e. die line, color scheme, etc.)
Picture and Label
Files
A Picture of the Product itself
(min of 72 dpi recommended)
ODS/DSLD verification form, if applicable
Other tier 2 documentation Files
(Certifications, etc.), if applicableSending Information and Content to UL – it’s easy
Web Upload Faster
Website for document upload:
loaded
Speed to get information
https://www.ulprospector.com/media/upload.htm
l
Email
Email documents to
OVP.SalesSupport@ul.com
Thumb Drive
Mail to: UL
Attn: Supplements Label
7930 Santa Fe, 3rd floor
Overland Park, KS 66204
SlowerGetting information from your labels
into the OWL – this requires some thought
Slower
Manual Entry
Please refer to “Decide best method to submit labels to the OWL” section of
Product information
the document may be
Getting manually
Started entered
With the into theOWL
Supplement template spreadsheet
on our website: using
Manual Upload
Speed to get information loaded
www.SupplementOWL.org
the .
Guide
Use an Upload Service
UL or other vendors can extract data from your PDF readable labels for a fee.
Extraction from ODS/DSLD:
Please Click Here to request verification form.
Electronic Transfer
API Connection or CSV file:
Please refer to IT_Field_Layout.p
df
.
FasterYOUR CONTACT AT UL:
Erik Eberhart, Global Business Development
will explain how to get started with the Supplement OWL.
Reach out to Erik at Erik.Eberhart@ul.com or 913-304-7841
www.SupplementOWL.orgWill a product registry build trust? • Demonstrates pro-active self-regulation by industry. • Strengthens the industry’s relationship with the FDA, by providing FDA with relevant information about supplements and improving its ability to obtain product, ingredient and manufacturer information. • Counters the perception (sometimes perpetuated by FDA itself) that the agency does not know, and cannot determine, the size and breadth of the industry—so we will change the landscape. • Establishes an industry-run, voluntary registry that could serve as a model for a mandatory program if it should ever be imposed in the future. (NOTE: We are not proposing, recommending or supporting a mandatory registry.) www.SupplementOWL.org
Will a product registry build trust?                                  YES!
• Assists retailers to more easily evaluate dietary supplements and select quality
  products for their customers;
• Ultimately, allows consumers to identify, examine and evaluate dietary supplements
  based on labeling, contents and indicia of quality, to more wisely “navigate the aisle”;
• Improves the perception of all stakeholders in the industry (elected officials,
  regulators, retailers, consumers, healthcare practitioners, media) by demonstrating
  increased transparency and accountability.

   www.SupplementOWL.org
It’s THIS EASY to be in the
              Supplement OWL ™
                                before April 10:
 Take these three easy steps:

  1. Contact UL: OVP.SalesSupport@ul.com for a service agreement
  2. Sign and return Service Order Form (SOF)
  3. Get Started uploading your labels!

  All information available at: www.SupplementOWL.org

  www.SupplementOWL.org
Thanks for listening!
Steve Mister
Council for Responsible Nutrition
smister@crnusa.org
www.SupplementOWL.orgYou can also read


